Business Intelligence Market
Business Intelligence Market By Components (Solutions - Dashboards and Scorecards, Data Integration and ETL, Reporting and Visualization, Query & Analysis, Services - Consulting Services, Deployment & Integration Services, Support & Maintenance Services), Deployment Mode (On-premises, Cloud) & Region - Forecast 2022 - 2032
Market Insights on Business Intelligence covering sales outlook, demand forecast & up-to-date key trends
Business intelligence Market Outlook (2022-2032)
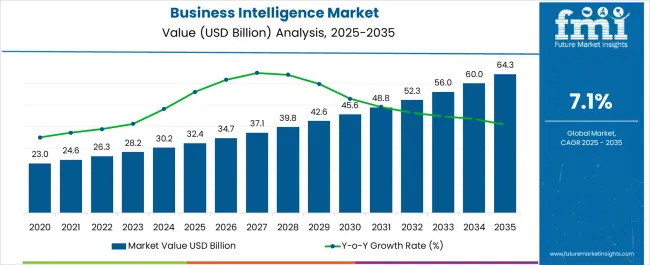
[344 Pages Report] The business intelligence market is likely to strengthen its hold on the global market at an average CAGR of 7.0% between 2022 and 2032.
The market is valued at US$ 26.7 bn in 2022 and is likely to reach US$ 52.6 Bn by 2032. Previously, the market was booming at a higher CAGR of 7.7% (2016-2021), resulting in market size of US$ 24.9 Bn in 2021.
“Business intelligence market thrives on growing digitization of corporate spaces that need data processing and analytical software support and solutions along with increased use of cloud and big data in business integration programs.”
As the data visualization dashboard and integrated business modeling take place in the latest corporate practices, the use of business intelligence platforms along with data analytics software provide helps the data generation. The adoption of the latest cutting-edge technology is increasing competition in the market space that leading companies to adopt business intelligence platforms.
Attributes |
Details |
Business Intelligence Market CAGR (2022-2032) |
7.0% |
Business Intelligence Market Value (2022) |
US$ 26.7 Bn |
Business Intelligence Market Value (2032) |
US$ 52.6 Bn |
What is the COVID-19 Impact on the Business Intelligence Market?
Covid-19 has impacted multiple global markets by rearranging the supply chains because of the market restrictions and logistics bans introduced by governments around the world. Yet there were some markets that had only a slight impact from the pandemic. The business intelligence market got affected by the advent of coronavirus, but it helped the market’s growth ultimately.
The increasing need for problem-solving and navigation tools that make things easier for the user as there was no strong support system while working from home.
Covid-19 also impacted the supply chains through online and offline channels; business intelligence systems helped the businesses reach the dead-end of their marketing and sales funnel to carry on their businesses with the same intensity. Business intelligence systems are also used in creating strategies for the recovery programs introduced for countering the impact of novel coronavirus.
The opportunities provided by the lockdown and new markets opening up because of market restrictions have also helped the business intelligence market, pushing the sales of business intelligence systems.
Let us know your requirement to get
100% FREE customization
What are the Key Drivers and Restraints for Growth of the Business Intelligence Market?
“With the latest trends in businesses and frequently rising competition, the role of business intelligence platforms is increasing as it provides a perspective that companies use in navigating multiple channels is increasing.”
The major factors driving the sales of business intelligence systems are the growing demand for integrated business models along with the latest technology such as machine learning, the Internet of things (IOT), artificial intelligence, and predictive decision making.
The latest advanced analytics and better statistical support provided by the business intelligence system are also helping the market grow.
Machine learning, along with business intelligence systems, helps the corporate spaces in problem-solving tactics and predicting possible final conclusions. This also helps in optimizing internal business processes, increasing revenue growth, and integrating systems to enhance processing, providing a competitive edge to the companies over other brands.
The data visualization dashboard provides quantitive data analysis and competitive analysis. Here, Covid-19 has also helped with the growth of distribution channels that, lastly, enhance the sales of business intelligence systems in new markets. These integrated features help the companies in hitting their KPIs that push their score in the market rankings.
Businesses like healthcare, education, and IT hold high expectations from business intelligence platforms with the latest features like perspective building, salesforce research, and surveys.
Business intelligence platforms have provided great help to businesses in looking at their operations, revenue generation, and sales during the covid-19 crisis. It provided an estimate idea or forecast of a company’s performance with the help of data visualization.
This data helped multiple companies in countering the impact of the pandemic and provided a silver lining to a lot of businesses. Metric collection done with the help of survey tools in order to provide a segmented outlook to multiple dimensions of a business is another process that business intelligence platforms help the corporates with, integrating with new generation technology.
Apart from the benefits that business intelligence platforms provide, high capital investment and unjustified ROI are some of the major challenges that the business intelligence market faces. This involves the implementation, maintenance, and training costs that don’t justify the return on investment.
Another restraint that the business intelligence market faces is the incubation phase of the market, which doesn’t allow the market to function properly as there are frequent advancements.
Integration of business intelligence platforms in any space is another crucial factor that challenges the growth of the market as it involves complex implementation processes like cloud deployments that are disturbed by the unavailability of certain components and other security issues.
Comparative View of Adjacent Business intelligence Market
Business intelligence Market :
Attributes |
Business intelligence Market |
CAGR (2022-2032) |
7% |
Market Value (2026) |
US$ 35 Bn |
Growth Factor |
Adoption of latest technologies to enhance the decision making and funnel navigation, pushing the sales of business intelligence platforms. |
Opportunity |
Enabling opportunities for vendors to experiment more with perspective and conclusive decision making, helping companies take productive actions. |
Key Trends |
Integration of business intelligence tools with upcoming technology like AI, Machine learning and Internet of things (IOT) |
Business Analytics Market :
Attributes |
Business Analytics Market |
CAGR (2022-2032) |
7.1% |
Market Value (2026) |
US$ 103.65 Bn |
Growth Factor |
Analytical support needed to counter the impact of covid-19 and increasing data game in businesses are pushing the sales of business analytics tools/platforms. |
Opportunity |
Market provides opportunities to new vendors that come up with innovative ideas, segmentized analytics and perspective building approach to help businesses grow. |
Key Trends |
Use of augmented analytics along with its use in data-testing operations without any IT support is the latest trend in the business analytics market |
Business Process Management Market :
Attributes |
Business Process Management Market |
CAGR (2022-2032) |
6% |
Market Value (2026) |
US$ 4.78 Bn |
Growth Factor |
Automation of different sectors including the elements of Industries 4.0 are helping in the growth of business process management market. |
Opportunity |
Market helps in building or strengthening the IT ecosystem that makes different operations easy and smooth and provides security, quality and efficiency to the end user. |
Key Trends |
Use of artificial intelligence along with business process management suits are trending in the business process management market. |
The upward trend of the business intelligence market is attributed to the integration of predictive decision-making through artificial intelligence and machine learning. The trends also involve the use of master data management, use of big data platforms, and analytics applications.
It enables businesses in data integration involving metrics, dimensions, and funnels that lastly push the business intelligence market. It also shows the operations where the company is doing better and where it is struggling. This way, companies work on their future plans that involve new tools and technologies.
Data visualization support provided by business intelligence platforms also helps brands in segmenting and prioritizing their key performance indicators, eliminating all the unnecessary data that doesn’t affect the company’s future decisions. This helps the brand in discovering new trends and patterns and then form future strategies with it, pushing the sales of business intelligence platforms and integrated systems.
Find your sweet spots for generating winning opportunities in this market.
Talk to AnalystWhat is the Segmentation Outlook for the Business intelligence Market?
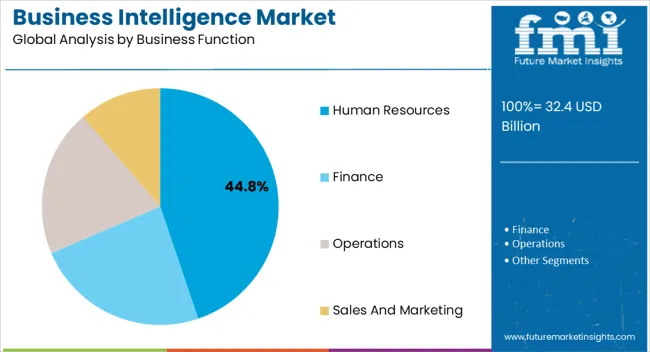
The business intelligence market is categorized by component, deployment mode, organization size, business function, and vertical. These categories are further divided into small segments that expand their channels in multiple market spaces.
These segments perform differently in multiple markets as they have a stronghold in multiple regions. The component category is segmented into solutions and services, while deployment mode is segmented into on-premise and cloud.
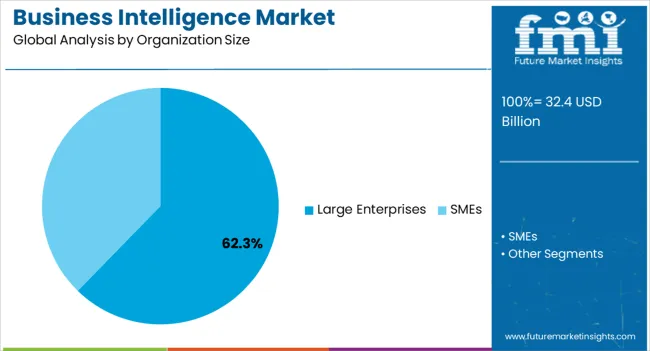
The organization size divides the segments into large enterprises, SMEs, and verticals are segmented into retail, manufacturing, government & public services, media & entertainment, transportation & logistics, BFSI, Telecom & IT, healthcare & life sciences, and tourism & hospitality.
Which Segment is likely to Lead the Business Intelligence Market by Components?
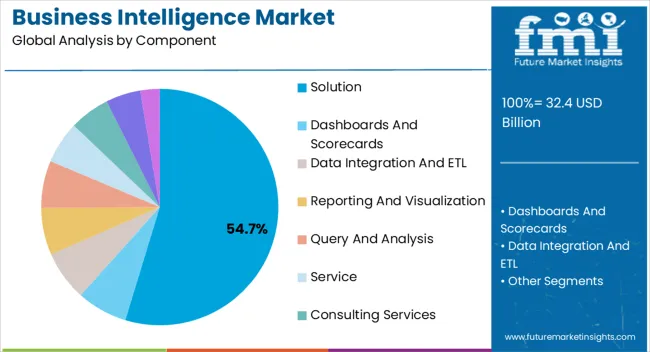
By components, the solutions segment is the biggest segment in the business intelligence market and is likely to hold the largest portion in the forecast period.
The segment is thriving at a promising CAGR of 6.9%. The solutions segment is further segmented into dashboards and scorecards, data integration and ETL, reporting and visualization, and query & analysis. The growth of this segment is attributed to easy implementation and less maintenance charge of these systems.

An unified Market Research Subscription Platform, built for today’s disparate research needs.
Which Segment is likely to Lead the Business Intelligence Market by Deployment?
By deployment, the cloud segment is the biggest segment of the deployment category and is likely to hold the largest portion of the market. This segment is thriving at a moderate CAGR of 6.4% and expanding the market in new regions.
The factors behind the growth of this segment are safe and secure deployment, enhanced storage, and better maintenance. Another segment that is on-premise is also growing with the personalized use of business intelligence systems.
Which Segment is likely to Lead the Business Intelligence Market by Vertical?
By vertical, BFSI is the biggest segment in the business intelligence market and is expected to hold the largest portion in the forecast period. The reason behind the growth of this segment is the expanding banking sector in different regions and technological advancements in banking and financial services.
However, the healthcare and life sciences segment is expected to grow at the highest CAGR in the forecast period.
What is the Regional Analysis for the Business Intelligence Market?
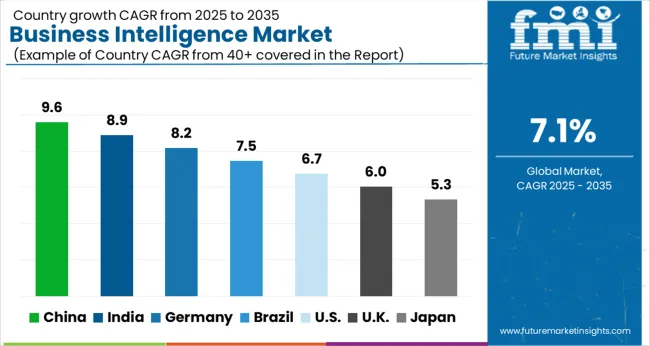
The Business intelligence market is divided into regions; North America, Latin America, Asia Pacific, Middle East and Africa (MEA), and Europe. The biggest market is the United States, which is thriving at a CAGR of 6.8% between 2022-2032.
The region is expected to hold a market revenue of US$ 18.3 Bn by the end of 2032. IT spaces, expanding banking and finance sector, especially after the spread of covid-19, are generating the demand for upgrades in their business structure, including their management and analytics.
Another reason behind the high growth of the business intelligence platform market in this region is high competition and new private players in the sector. Apart from this, China is the second highest growing market for business intelligence market.
Chinese region is likely to hold US$ 3.8 Bn by the end of 2032 as it thrives on a moderate CAGR of 6.3% between 2022-2032. United Kingdom (UK) also grows along with China with the forecasted value of US$ 2.2 Bn (2032) at a CAGR of 6% between 2022-2032.
Regions |
CAGR (2022-2032) |
United States |
6.8% |
United Kingdom |
6% |
China |
6.3% |
Japan |
5.4% |
South Korea |
4.9% |
The United States holds the biggest portion of the business intelligence market. The US is also the highest growing market making the North American region the highest growing region.
While China is the second highest growing market for Business intelligence market with a CAGR of 6.3% between (2022-2032). Technological advancements, growing market competition, and frequently growing business intelligence industry in developed countries like the US and UK are pushing the demand for Business intelligence solutions and services in the region.
How is the Competition in the Business Intelligence Market?
The competitive landscape of business intelligence is diversified and makes the market more exclusive for new players. The competitors focus on adopting the latest technology in order to enhance the corporate workings.
Business intelligence vendors focus on creating new business specific platforms that help new types of businesses. Companies also work in the direction of making their platform more flexible so that it can integrate with new age tools like Machine learning and artificial intelligence.
Recent Developments in the Business Intelligence Market
- IBM has introduced watson works that help the businesses in letting the employees return to their workplaces, focusing on navigating many aspects that counter the impacts of coronavirus, fueling the sales of business intelligence platforms.
- IBM cognos analytics has provided the dashboard that explains the effects of covid-19 and also derives the solutions that help in countering the coronavirus pandemic. It also shows the data reflected from WHO, pushing the overall sales of business intelligence platform.
- Microsoft has tied up with SAS in order to form an extensive technology and strategic platform that is likely to migrate SAS analytical products, pushing the sales of business intelligence systems.
Key Segments
By Component:
- Solution
- Dashboards and Scorecards
- Data Integration and ETL
- Reporting and Visualization
- Query and Analysis
- Service
- Consulting Services
- Deployment and Integration Services
- Support and Maintenance Services
By Organization Size:
- Large Enterprises
- SMEs
By Business Function:
- Human Resource
- Finance
- Operations
- Sales and marketing
By Vertical:
- Retail
- Manufacturing
- Government and Public Services
- Media and Entertainment
- Transportation and Logistics
- BFSI
- Telecom and IT
- Healthcare and Hospitality
By Deployment:
- On-premise
- Cloud
By Region:
- United States
- United Kingdom
- China
- Japan
- South Korea
Frequently Asked Questions
Business intelligence market is set to grow at a CAGR of 7% by 2032.
United States is the biggest region in business intelligence market with a CAGR of 6.8% by 2032.
Solutions is the leading segment in the business intelligence market by component.
The business intelligence market is set to reach US$ 52.6 Bn.
North America has the highest growth potential in the business intelligence market, where US has the highest growth rate 6.8% by 2032.
1. Executive Summary
1.1. Global Market Outlook
1.2. Summary of Statistics
1.3. Key Market Characteristics & Attributes
1.4. Fact.MR Analysis and Recommendations
2. Market Overview
2.1. Market Coverage / Taxonomy
2.2. Market Definition / Scope / Limitations
3. Market Risks and Trends Assessment
3.1. Risk Assessment
3.1.1. COVID-19 Crisis and Impact on Business Intelligence Demand
3.1.2. COVID-19 Impact Benchmark with Previous Crisis
3.1.3. Impact on Market Value (US$ Mn)
3.1.4. Assessment by Key Countries
3.1.5. Assessment by Key Market Segments
3.1.6. Action Points and Recommendation for Suppliers
3.2. Key Trends Impacting the Market
3.3. Formulation and Product Development Trends
4. Market Background
4.1. Business Intelligence Market, by Key Countries
4.2. Business Intelligence Market Opportunity Assessment (US$ Mn)
4.2.1. Total Available Market
4.2.2. Serviceable Addressable Market
4.2.3. Serviceable Obtainable Market
4.3. Market Scenario Forecast
4.3.1. Demand in optimistic Scenario
4.3.2. Demand in Likely Scenario
4.3.3. Demand in Conservative Scenario
4.4. Investment Feasibility Analysis
4.4.1. Investment in Established Markets
4.4.1.1. In Short Term
4.4.1.2. In Long Term
4.4.2. Investment in Emerging Markets
4.4.2.1. In Short Term
4.4.2.2. In Long Term
4.5. Forecast Factors - Relevance & Impact
4.5.1. Top Companies Historical Growth
4.5.2. Growth in Automation, By Country
4.5.3. Business Intelligence Adoption Rate, By Country
4.6. Market Dynamics
4.6.1. Market Driving Factors and Impact Assessment
4.6.2. Prominent Market Challenges and Impact Assessment
4.6.3. Business Intelligence Market Opportunities
4.6.4. Prominent Trends in the Global Market & Their Impact Assessment
5. Key Success Factors
5.1. Manufacturers’ Focus on Low Penetration High Growth Markets
5.2. Banking on with Segments High Incremental Opportunity
5.3. Peer Benchmarking
6. Global Business Intelligence Market Demand Analysis 2015-2021 and Forecast, 2022-2032
6.1. Historical Market Analysis, 2015-2021
6.2. Current and Future Market Projections, 2022-2032
6.3. Y-o-Y Growth Trend Analysis
7. Global Business Intelligence Market Value Analysis 2015-2021 and Forecast, 2022-2032
7.1. Historical Market Value (US$ Mn) Analysis, 2015-2021
7.2. Current and Future Market Value (US$ Mn) Projections, 2022-2032
7.2.1. Y-o-Y Growth Trend Analysis
7.2.2. Absolute $ Opportunity Analysis
8. Global Business Intelligence Market Analysis 2015-2021 and Forecast 2022-2032, By Component
8.1. Introduction / Key Findings
8.2. Historical Market Value (US$ Mn) and Analysis By Component, 2015-2021
8.3. Current and Future Market Value (US$ Mn) and Analysis and Forecast By Component, 2022-2032
8.3.1. Solutions
8.3.1.1. Dashboards and Scorecards
8.3.1.2. Data Integration and ETL
8.3.1.3. Reporting and Visualization
8.3.1.4. Query and Analysis
8.3.2. Services
8.3.2.1. Consulting Services
8.3.2.2. Deployment and Integration Services
8.3.2.3. Support and Maintenance Services
8.4. Market Attractiveness Analysis By Component
9. Global Business Intelligence Market Analysis 2015-2021 and Forecast 2022-2032, By Organization Size
9.1. Introduction / Key Findings
9.2. Historical Market Value (US$ Mn) and Analysis By Organization Size, 2015-2021
9.3. Current and Future Market Value (US$ Mn) and Analysis and Forecast By Organization Size, 2022-2032
9.3.1. Large Enterprises
9.3.2. SMEs
9.4. Market Attractiveness Analysis By Organization Size
10. Global Business Intelligence Market Analysis 2015-2021 and Forecast 2022-2032,By Deployment Mode
10.1. Introduction / Key Findings
10.2. Historical Market Value (US$ Mn) and AnalysisBy Deployment Mode, 2015-2021
10.3. Current and Future Market Value (US$ Mn) and Analysis and ForecastBy Deployment Mode, 2022-2032
10.3.1. On-premises
10.3.2. Cloud
10.4. Market Attractiveness Analysis By Deployment Mode
11. Global Business Intelligence Market Analysis 2015-2021 and Forecast 2022-2032, By Business Function
11.1. Introduction / Key Findings
11.2. Historical Market Value (US$ Mn) and Analysis By Business Function, 2015-2021
11.3. Current and Future Market Value (US$ Mn) and Analysis and Forecast By Business Function, 2022-2032
11.3.1. Human Resource
11.3.2. Finance
11.3.3. Operations
11.3.4. Sales and Marketing
11.4. Market Attractiveness Analysis By Business Function
12. Global Business Intelligence Market Analysis 2015-2021 and Forecast 2022-2032, By Vertical
12.1. Introduction / Key Findings
12.2. Historical Market Value (US$ Mn) and Analysis By Vertical, 2015-2021
12.3. Current and Future Market Value (US$ Mn) and Analysis and Forecast By Vertical, 2022-2032
12.3.1. Retail
12.3.2. Manufacturing
12.3.3. Government and Public Services
12.3.4. Media and Entertainment
12.3.5. Transportation and Logistics
12.3.6. BFSI
12.3.7. Telecom and IT
12.3.8. Healthcare and Life Sciences
12.3.9. Tourism and Hospitality
12.3.10. Others
12.4. Market Attractiveness Analysis By Vertical
13. Global Business Intelligence Market Analysis 2015-2021 and Forecast 2022-2032, By Region
13.1. Introduction
13.2. Historical Market Value (US$ Mn) and Analysis By Region, 2015-2021
13.3. Current Market Size (US$ Mn) & Analysis and Forecast By Region, 2022-2032
13.3.1. North America
13.3.2. Latin America
13.3.3. Europe
13.3.4. Asia Pacific
13.3.5. Middle East and Africa (MEA)
13.4. Market Attractiveness Analysis By Region
14. North America Business Intelligence Market Analysis 2015-2021 and Forecast 2022-2032
14.1. Introduction
14.2. Pricing Analysis
14.3. Historical Market Value (US$ Mn) and Trend Analysis By Market Taxonomy, 2015-2021
14.4. Market Value (US$ Mn) & Forecast By Market Taxonomy, 2022-2032
14.4.1. By Country
14.4.1.1. U.S.
14.4.1.2. Canada
14.4.1.3. Rest of North America
14.4.2. By Deployment Mode
14.4.3. By Component
14.4.4. By Organization Size
14.4.5. By Business Function
14.4.6. By Vertical
14.5. Market Attractiveness Analysis
14.5.1. By Country
14.5.2. By Deployment Mode
14.5.3. By Component
14.5.4. By Organization Size
14.5.5. By Business Function
14.5.6. By Vertical
15. Latin America Business Intelligence Market Analysis 2015-2021 and Forecast 2022-2032
15.1. Introduction
15.2. Pricing Analysis
15.3. Historical Market Value (US$ Mn) and Trend Analysis By Market Taxonomy, 2015-2021
15.4. Market Value (US$ Mn) & Forecast By Market Taxonomy, 2022-2032
15.4.1. By Country
15.4.1.1. Brazil
15.4.1.2. Mexico
15.4.1.3. Rest of Latin America
15.4.2. By Deployment Mode
15.4.3. By Component
15.4.4. By Organization Size
15.4.5. By Business Function
15.4.6. By Vertical
15.5. Market Attractiveness Analysis
15.5.1. By Country
15.5.2. By Deployment Mode
15.5.3. By Component
15.5.4. By Organization Size
15.5.5. By Business Function
15.5.6. By Vertical
16. Europe Business Intelligence Market Analysis 2015-2021 and Forecast 2022-2032
16.1. Introduction
16.2. Pricing Analysis
16.3. Historical Market Value (US$ Mn) and Trend Analysis By Market Taxonomy, 2015-2021
16.4. Market Value (US$ Mn) & Forecast By Market Taxonomy, 2022-2032
16.4.1. By Country
16.4.1.1. Germany
16.4.1.2. France
16.4.1.3. U.K.
16.4.1.4. Italy
16.4.1.5. Russia
16.4.1.6. Rest of Europe
16.4.2. By Deployment Mode
16.4.3. By Component
16.4.4. By Organization Size
16.4.5. By Business Function
16.4.6. By Vertical
16.5. Market Attractiveness Analysis
16.5.1. By Country
16.5.2. By Deployment Mode
16.5.3. By Component
16.5.4. By Organization Size
16.5.5. By Business Function
16.5.6. By Vertical
17. Asia Pacific Business Intelligence Market Analysis 2015-2021 and Forecast 2022-2032
17.1. Introduction
17.2. Pricing Analysis
17.3. Historical Market Value (US$ Mn) and Trend Analysis By Market Taxonomy, 2015-2021
17.4. Market Value (US$ Mn) & Forecast By Market Taxonomy, 2022-2032
17.4.1. By Country
17.4.1.1. China
17.4.1.2. Japan
17.4.1.3. South Korea
17.4.1.4. Rest of Asia Pacific
17.4.2. By Deployment Mode
17.4.3. By Component
17.4.4. By Organization Size
17.4.5. By Business Function
17.4.6. By Vertical
17.5. Market Attractiveness Analysis
17.5.1. By Country
17.5.2. By Deployment Mode
17.5.3. By Component
17.5.4. By Organization Size
17.5.5. By Business Function
17.5.6. By Vertical
18. Middle East and Africa Business Intelligence Market Analysis 2015-2021 and Forecast 2022-2032
18.1. Introduction
18.2. Pricing Analysis
18.3. Historical Market Value (US$ Mn) and Trend Analysis By Market Taxonomy, 2015-2021
18.4. Market Value (US$ Mn) & Forecast By Market Taxonomy, 2022-2032
18.4.1. By Country
18.4.1.1. GCC Countries
18.4.1.2. South Africa
18.4.1.3. Turkey
18.4.1.4. Rest of Middle East and Africa
18.4.2. By Deployment Mode
18.4.3. By Component
18.4.4. By Organization Size
18.4.5. By Business Function
18.4.6. By Vertical
18.5. Market Attractiveness Analysis
18.5.1. By Country
18.5.2. By Deployment Mode
18.5.3. By Component
18.5.4. By Organization Size
18.5.5. By Business Function
18.5.6. By Vertical
19. Key Countries Business Intelligence Market Analysis 2015-2021 and Forecast 2022-2032
19.1. Introduction
19.1.1. Market Value Proportion Analysis, By Key Countries
19.1.2. Global Vs. Country Growth Comparison
19.2. US Business Intelligence Market Analysis
19.2.1. Value Proportion Analysis by Market Taxonomy
19.2.2. Value & Analysis and Forecast by Market Taxonomy, 2015-2032
19.2.2.1. By Deployment Mode
19.2.2.2. By Component
19.2.2.3. By Organization Size
19.2.2.4. By Business Function
19.2.2.5. By Vertical
19.3. Canada Business Intelligence Market Analysis
19.3.1. Value Proportion Analysis by Market Taxonomy
19.3.2. Value & Analysis and Forecast by Market Taxonomy, 2015-2032
19.3.2.1. By Deployment Mode
19.3.2.2. By Component
19.3.2.3. By Organization Size
19.3.2.4. By Business Function
19.3.2.5. By Vertical
19.4. Mexico Business Intelligence Market Analysis
19.4.1. Value Proportion Analysis by Market Taxonomy
19.4.2. Value & Analysis and Forecast by Market Taxonomy, 2015-2032
19.4.2.1. By Deployment Mode
19.4.2.2. By Component
19.4.2.3. By Organization Size
19.4.2.4. By Business Function
19.4.2.5. By Vertical
19.5. Brazil Business Intelligence Market Analysis
19.5.1. Value Proportion Analysis by Market Taxonomy
19.5.2. Value & Analysis and Forecast by Market Taxonomy, 2015-2032
19.5.2.1. By Deployment Mode
19.5.2.2. By Component
19.5.2.3. By Organization Size
19.5.2.4. By Business Function
19.5.2.5. By Vertical
19.6. Germany Business Intelligence Market Analysis
19.6.1. Value Proportion Analysis by Market Taxonomy
19.6.2. Value & Analysis and Forecast by Market Taxonomy, 2015-2032
19.6.2.1. By Deployment Mode
19.6.2.2. By Component
19.6.2.3. By Organization Size
19.6.2.4. By Business Function
19.6.2.5. By Vertical
19.7. France Business Intelligence Market Analysis
19.7.1. Value Proportion Analysis by Market Taxonomy
19.7.2. Value & Analysis and Forecast by Market Taxonomy, 2015-2032
19.7.2.1. By Deployment Mode
19.7.2.2. By Component
19.7.2.3. By Organization Size
19.7.2.4. By Business Function
19.7.2.5. By Vertical
19.8. Italy Business Intelligence Market Analysis
19.8.1. Value Proportion Analysis by Market Taxonomy
19.8.2. Value & Analysis and Forecast by Market Taxonomy, 2015-2032
19.8.2.1. By Deployment Mode
19.8.2.2. By Component
19.8.2.3. By Organization Size
19.8.2.4. By Business Function
19.8.2.5. By Vertical
19.9. Russia Business Intelligence Market Analysis
19.9.1. Value Proportion Analysis by Market Taxonomy
19.9.2. Value & Analysis and Forecast by Market Taxonomy, 2015-2032
19.9.2.1. By Deployment Mode
19.9.2.2. By Component
19.9.2.3. By Organization Size
19.9.2.4. By Business Function
19.9.2.5. By Vertical
19.10. UK Business Intelligence Market Analysis
19.10.1. Value Proportion Analysis by Market Taxonomy
19.10.2. Value & Analysis and Forecast by Market Taxonomy, 2015-2032
19.10.2.1. By Deployment Mode
19.10.2.2. By Component
19.10.2.3. By Organization Size
19.10.2.4. By Business Function
19.10.2.5. By Vertical
19.11. China Business Intelligence Market Analysis
19.11.1. Value Proportion Analysis by Market Taxonomy
19.11.2. Value & Analysis and Forecast by Market Taxonomy, 2015-2032
19.11.2.1. By Deployment Mode
19.11.2.2. By Component
19.11.2.3. By Organization Size
19.11.2.4. By Business Function
19.11.2.5. By Vertical
19.12. Japan Business Intelligence Market Analysis
19.12.1. Value Proportion Analysis by Market Taxonomy
19.12.2. Value & Analysis and Forecast by Market Taxonomy, 2015-2032
19.12.2.1. By Deployment Mode
19.12.2.2. By Component
19.12.2.3. By Organization Size
19.12.2.4. By Business Function
19.12.2.5. By Vertical
19.13. South Korea Business Intelligence Market Analysis
19.13.1. Value Proportion Analysis by Market Taxonomy
19.13.2. Value & Analysis and Forecast by Market Taxonomy, 2015-2032
19.13.2.1. By Deployment Mode
19.13.2.2. By Component
19.13.2.3. By Organization Size
19.13.2.4. By Business Function
19.13.2.5. By Vertical
19.14. GCC Countries Business Intelligence Market Analysis
19.14.1. Value Proportion Analysis by Market Taxonomy
19.14.2. Value & Analysis and Forecast by Market Taxonomy, 2015-2032
19.14.2.1. By Deployment Mode
19.14.2.2. By Component
19.14.2.3. By Organization Size
19.14.2.4. By Business Function
19.14.2.5. By Vertical
19.15. South Africa Business Intelligence Market Analysis
19.15.1. Value Proportion Analysis by Market Taxonomy
19.15.2. Value & Analysis and Forecast by Market Taxonomy, 2015-2032
19.15.2.1. By Deployment Mode
19.15.2.2. By Component
19.15.2.3. By Organization Size
19.15.2.4. By Business Function
19.15.2.5. By Vertical
19.16. Turkey Business Intelligence Market Analysis
19.16.1. Value Proportion Analysis by Market Taxonomy
19.16.2. Value & Analysis and Forecast by Market Taxonomy, 2015-2032
19.16.2.1. By Deployment Mode
19.16.2.2. By Component
19.16.2.3. By Organization Size
19.16.2.4. By Business Function
19.16.2.5. By Vertical
19.16.3. Competition Landscape and Player Concentration in the Country
20. Market Structure Analysis
20.1. Market Analysis by Tier of Companies
20.2. Market Concentration
20.3. Market Share Analysis of Top Players
20.4. Market Presence Analysis
20.4.1. By Regional footprint of Players
20.4.2. Product footprint by Players
21. Competition Analysis
21.1. Competition Dashboard
21.2. Competition Benchmarking
21.3. Competition Deep Dive
21.3.1. IBM
21.3.1.1. Overview
21.3.1.2. Product Portfolio
21.3.1.3. Sales Footprint
21.3.1.4. Strategy Overview
21.3.2. ORACLE
21.3.3. MICROSOFT
21.3.4. SAP
21.3.5. SAS
21.3.6. GOOGLE
21.3.7. AMAZON WEB SERVICES
21.3.8. SALESFORCE
21.3.9. TERADATA
21.3.10. DOMO
22. Assumptions and Acronyms Used
23. Research Methodology
Let us know your requirement to get
100% FREE customization
Table 1: Global Business Intelligence Market Value (US$ Mn),By Deployment Mode, 2015 – 2021
Table 2: Global Business Intelligence Market Value (US$ Mn),By Deployment Mode, 2022 – 2032
Table 3: Global Business Intelligence Market Value (US$ Mn), By Component, 2015 – 2021
Table 4: Global Business Intelligence Market Value (US$ Mn), By Component, 2022 – 2032
Table 5: Global Business Intelligence Market Value (US$ Mn), By Organization Size, 2015 – 2021
Table 6: Global Business Intelligence Market Value (US$ Mn), By Organization Size, 2022 – 2032
Table 7: Global Business Intelligence Market Value (US$ Mn), By Vertical, 2015 – 2021
Table 8: Global Business Intelligence Market Value (US$ Mn), By Vertical, 2022 – 2032
Table 9: Global Business Intelligence Market Value (US$ Mn), By Business Function, 2015 – 2021
Table 10: Global Business Intelligence Market Value (US$ Mn), By Business Function, 2022 – 2032
Table 11: Global Business Intelligence Market, By Region, 2015 – 2021
Table 12: Global Business Intelligence Market, By Region, 2022 – 2032
Table 13: North America Business Intelligence Market Value (US$ Mn),By Deployment Mode, 2015 – 2021
Table 14: North America Business Intelligence Market Value (US$ Mn),By Deployment Mode, 2022 – 2032
Table 15: North America Business Intelligence Market Value (US$ Mn), By Component, 2015 – 2021
Table 16: North America Business Intelligence Market Value (US$ Mn), By Component, 2022 – 2032
Table 17: North America Business Intelligence Market Value (US$ Mn), By Organization Size, 2015 – 2021
Table 18: North America Business Intelligence Market Value (US$ Mn), By Organization Size, 2022 – 2032
Table 19: North America Business Intelligence Market Value (US$ Mn), By Vertical, 2015 – 2021
Table 20: North America Business Intelligence Market Value (US$ Mn), By Vertical, 2022 – 2032
Table 21: North America Business Intelligence Market Value (US$ Mn), By Business Function, 2015 – 2021
Table 22: North America Business Intelligence Market Value (US$ Mn), By Business Function, 2022 – 2032
Table 23: North America Business Intelligence Market, By Country, 2015 – 2021
Table 24: North America Business Intelligence Market, By Country, 2022 – 2032
Table 25: Latin America Business Intelligence Market Value (US$ Mn),By Deployment Mode, 2015 – 2021
Table 26: Latin America Business Intelligence Market Value (US$ Mn),By Deployment Mode, 2022 – 2032
Table 27: Latin America Business Intelligence Market Value (US$ Mn), By Component, 2015 – 2021
Table 28: Latin America Business Intelligence Market Value (US$ Mn), By Component, 2022 – 2032
Table 29: Latin America Business Intelligence Market Value (US$ Mn), By Organization Size, 2015 – 2021
Table 30: Latin America Business Intelligence Market Value (US$ Mn), By Organization Size, 2022 – 2032
Table 31: Latin America Business Intelligence Market Value (US$ Mn), By Vertical, 2015 – 2021
Table 32: Latin America Business Intelligence Market Value (US$ Mn), By Vertical, 2022 – 2032
Table 33: Latin America Business Intelligence Market Value (US$ Mn), By Business Function, 2015 – 2021
Table 34: Latin America Business Intelligence Market Value (US$ Mn), By Business Function, 2022 – 2032
Table 35: Latin America Business Intelligence Market, By Country, 2015 – 2021
Table 36: Latin America Business Intelligence Market, By Country, 2022 – 2032
Table 37: Europe Business Intelligence Market Value (US$ Mn),By Deployment Mode, 2015 – 2021
Table 38: Europe Business Intelligence Market Value (US$ Mn),By Deployment Mode, 2022 – 2032
Table 39: Europe Business Intelligence Market Value (US$ Mn), By Component, 2015 – 2021
Table 40: Europe Business Intelligence Market Value (US$ Mn), By Component, 2022 – 2032
Table 41: Europe Business Intelligence Market Value (US$ Mn), By Organization Size, 2015 – 2021
Table 42: Europe Business Intelligence Market Value (US$ Mn), By Organization Size, 2022 – 2032
Table 43: Europe Business Intelligence Market Value (US$ Mn), By Vertical, 2015 – 2021
Table 44: Europe Business Intelligence Market Value (US$ Mn), By Vertical, 2022 – 2032
Table 45: Europe Business Intelligence Market Value (US$ Mn), By Business Function, 2015 – 2021
Table 46: Europe Business Intelligence Market Value (US$ Mn), By Business Function, 2022 – 2032
Table 47: Europe Business Intelligence Market, By Country, 2015 – 2021
Table 48: Europe Business Intelligence Market, By Country, 2022 – 2032
Table 49: Asia Pacific Business Intelligence Market Value (US$ Mn),By Deployment Mode, 2015 – 2021
Table 50: Asia Pacific Business Intelligence Market Value (US$ Mn),By Deployment Mode, 2022 – 2032
Table 51: Asia Pacific Business Intelligence Market Value (US$ Mn), By Component, 2015 – 2021
Table 52: Asia Pacific Business Intelligence Market Value (US$ Mn), By Component, 2022 – 2032
Table 53: Asia Pacific Business Intelligence Market Value (US$ Mn), By Organization Size, 2015 – 2021
Table 54: Asia Pacific Business Intelligence Market Value (US$ Mn), By Organization Size, 2022 – 2032
Table 55: Asia Pacific Business Intelligence Market Value (US$ Mn), By Vertical, 2015 – 2021
Table 56: Asia Pacific Business Intelligence Market Value (US$ Mn), By Vertical, 2022 – 2032
Table 57: Asia Pacific Business Intelligence Market Value (US$ Mn), By Business Function, 2015 – 2021
Table 58: Asia Pacific Business Intelligence Market Value (US$ Mn), By Business Function, 2022 – 2032
Table 59: Asia Pacific Business Intelligence Market, By Country, 2015 – 2021
Table 60: Asia Pacific Business Intelligence Market, By Country, 2022 – 2032
Table 61: MEA Business Intelligence Market Value (US$ Mn),By Deployment Mode, 2015 – 2021
Table 62: MEA Business Intelligence Market Value (US$ Mn),By Deployment Mode, 2022 – 2032
Table 63: MEA Business Intelligence Market Value (US$ Mn), By Component, 2015 – 2021
Table 64: MEA Business Intelligence Market Value (US$ Mn), By Component, 2022 – 2032
Table 65: MEA Business Intelligence Market Value (US$ Mn), By Organization Size, 2015 – 2021
Table 66: MEA Business Intelligence Market Value (US$ Mn), By Organization Size, 2022 – 2032
Table 67: MEA Business Intelligence Market Value (US$ Mn), By Vertical, 2015 – 2021
Table 68: MEA Business Intelligence Market Value (US$ Mn), By Vertical, 2022 – 2032
Table 69: MEA Business Intelligence Market Value (US$ Mn), By Business Function, 2015 – 2021
Table 70: MEA Business Intelligence Market Value (US$ Mn), By Business Function, 2022 – 2032
Table 71: MEA Business Intelligence Market, By Country, 2015 – 2021
Table 72: MEA Business Intelligence Market, By Country, 2022 – 2032
Find your sweet spots for generating winning opportunities in this market.
Talk to AnalystFigure 1: Global Business Intelligence Market Value (US$ Mn) and Year-on-Year Growth, 2015-2032
Figure 2: Global Business Intelligence Market Absolute $ Historical Gain (2015 - 2021) and Opportunity (2022 – 2032), US$ Mn
Figure 3: Global Business Intelligence Market Share,By Deployment Mode, 2022 & 2032
Figure 4: Global Business Intelligence Market Y-o-Y Growth Projections,By Deployment Mode – 2022-2032
Figure 5: Global Business Intelligence Market Attractiveness Index,By Deployment Mode – 2022-2032
Figure 6: Global Business Intelligence Market Share, By Component, 2022 & 2032
Figure 7: Global Business Intelligence Market Y-o-Y Growth Projections, By Component – 2022-2032
Figure 8: Global Business Intelligence Market Attractiveness Index, By Component – 2022-2032
Figure 9: Global Business Intelligence Market Share, By Vertical, 2022 & 2032
Figure 10: Global Business Intelligence Market Y-o-Y Growth Projections, By Vertical – 2022-2032
Figure 11: Global Business Intelligence Market Attractiveness Index, By Vertical – 2022-2032
Figure 12: Global Business Intelligence Market Share, By Organization Size, 2022 & 2032
Figure 13: Global Business Intelligence Market Y-o-Y Growth Projections, By Organization Size – 2022-2032
Figure 14: Global Business Intelligence Market Attractiveness Index, By Organization Size – 2022-2032
Figure 15: Global Business Intelligence Market Share, By Business Function, 2022 & 2032
Figure 16: Global Business Intelligence Market Y-o-Y Growth Projections, By Business Function – 2022-2032
Figure 17: Global Business Intelligence Market Attractiveness Index, By Business Function – 2022-2032
Figure 18: Global Business Intelligence Market Share, By Region, 2022 & 2032
Figure 19: Global Business Intelligence Market Y-o-Y Growth Projections, By Region – 2022-2032
Figure 20: Global Business Intelligence Market Attractiveness Index, By Region – 2022-2032
Figure 21: North America Business Intelligence Market Value (US$ Mn) and Year-on-Year Growth, 2015-2032
Figure 22: North America Business Intelligence Market Absolute $ Historical Gain (2015 - 2021) and Opportunity (2022 – 2032), US$ Mn
Figure 23: North America Business Intelligence Market Share,By Deployment Mode, 2022 & 2032
Figure 24: North America Business Intelligence Market Y-o-Y Growth Projections,By Deployment Mode – 2022-2032
Figure 25: North America Business Intelligence Market Attractiveness Index,By Deployment Mode – 2022-2032
Figure 26: North America Business Intelligence Market Share, By Component, 2022 & 2032
Figure 27: North America Business Intelligence Market Y-o-Y Growth Projections, By Component – 2022-2032
Figure 28: North America Business Intelligence Market Attractiveness Index, By Component – 2022-2032
Figure 29: North America Business Intelligence Market Share, By Vertical, 2022 & 2032
Figure 30: North America Business Intelligence Market Y-o-Y Growth Projections, By Vertical – 2022-2032
Figure 31: North America Business Intelligence Market Attractiveness Index, By Vertical – 2022-2032
Figure 32: North America Business Intelligence Market Share, By Organization Size, 2022 & 2032
Figure 33: North America Business Intelligence Market Y-o-Y Growth Projections, By Organization Size – 2022-2032
Figure 34: North America Business Intelligence Market Attractiveness Index, By Organization Size – 2022-2032
Figure 35: North America Business Intelligence Market Share, By Business Function, 2022 & 2032
Figure 36: North America Business Intelligence Market Y-o-Y Growth Projections, By Business Function – 2022-2032
Figure 37: North America Business Intelligence Market Attractiveness Index, By Business Function – 2022-2032
Figure 38: North America Business Intelligence Market Share, By Country, 2022 & 2032
Figure 39: North America Business Intelligence Market Y-o-Y Growth Projections, By Country – 2022-2032
Figure 40: North America Business Intelligence Market Attractiveness Index, By Country – 2022-2032
Figure 41: Latin America Business Intelligence Market Value (US$ Mn) and Year-on-Year Growth, 2015-2032
Figure 42: Latin America Business Intelligence Market Absolute $ Historical Gain (2015 - 2021) and Opportunity (2022 – 2032), US$ Mn
Figure 43: Latin America Business Intelligence Market Share,By Deployment Mode, 2022 & 2032
Figure 44: Latin America Business Intelligence Market Y-o-Y Growth Projections,By Deployment Mode – 2022-2032
Figure 45: Latin America Business Intelligence Market Attractiveness Index,By Deployment Mode – 2022-2032
Figure 46: Latin America Business Intelligence Market Share, By Component, 2022 & 2032
Figure 47: Latin America Business Intelligence Market Y-o-Y Growth Projections, By Component – 2022-2032
Figure 48: Latin America Business Intelligence Market Attractiveness Index, By Component – 2022-2032
Figure 49: Latin America Business Intelligence Market Share, By Vertical, 2022 & 2032
Figure 50: Latin America Business Intelligence Market Y-o-Y Growth Projections, By Vertical – 2022-2032
Figure 51: Latin America Business Intelligence Market Attractiveness Index, By Vertical – 2022-2032
Figure 52: Latin America Business Intelligence Market Share, By Organization Size, 2022 & 2032
Figure 53: Latin America Business Intelligence Market Y-o-Y Growth Projections, By Organization Size – 2022-2032
Figure 54: Latin America Business Intelligence Market Attractiveness Index, By Organization Size – 2022-2032
Figure 55: Latin America Business Intelligence Market Share, By Business Function, 2022 & 2032
Figure 56: Latin America Business Intelligence Market Y-o-Y Growth Projections, By Business Function – 2022-2032
Figure 57: Latin America Business Intelligence Market Attractiveness Index, By Business Function – 2022-2032
Figure 58: Latin America Business Intelligence Market Share, By Country, 2022 & 2032
Figure 59: Latin America Business Intelligence Market Y-o-Y Growth Projections, By Country – 2022-2032
Figure 60: Latin America Business Intelligence Market Attractiveness Index, By Country – 2022-2032
Figure 61: Europe Business Intelligence Market Value (US$ Mn) and Year-on-Year Growth, 2015-2032
Figure 62: Europe Business Intelligence Market Absolute $ Historical Gain (2015 - 2021) and Opportunity (2022 – 2032), US$ Mn
Figure 63: Europe Business Intelligence Market Share,By Deployment Mode, 2022 & 2032
Figure 64: Europe Business Intelligence Market Y-o-Y Growth Projections,By Deployment Mode – 2022-2032
Figure 65: Europe Business Intelligence Market Attractiveness Index,By Deployment Mode – 2022-2032
Figure 66: Europe Business Intelligence Market Share, By Component, 2022 & 2032
Figure 67: Europe Business Intelligence Market Y-o-Y Growth Projections, By Component – 2022-2032
Figure 68: Europe Business Intelligence Market Attractiveness Index, By Component – 2022-2032
Figure 69: Europe Business Intelligence Market Share, By Vertical, 2022 & 2032
Figure 70: Europe Business Intelligence Market Y-o-Y Growth Projections, By Vertical – 2022-2032
Figure 71: Europe Business Intelligence Market Attractiveness Index, By Vertical – 2022-2032
Figure 72: Europe Business Intelligence Market Share, By Organization Size, 2022 & 2032
Figure 73: Europe Business Intelligence Market Y-o-Y Growth Projections, By Organization Size – 2022-2032
Figure 74: Europe Business Intelligence Market Attractiveness Index, By Organization Size – 2022-2032
Figure 75: Europe Business Intelligence Market Share, By Business Function, 2022 & 2032
Figure 76: Europe Business Intelligence Market Y-o-Y Growth Projections, By Business Function – 2022-2032
Figure 77: Europe Business Intelligence Market Attractiveness Index, By Business Function – 2022-2032
Figure 78: Europe Business Intelligence Market Share, By Country, 2022 & 2032
Figure 79: Europe Business Intelligence Market Y-o-Y Growth Projections, By Country – 2022-2032
Figure 80: Europe Business Intelligence Market Attractiveness Index, By Country – 2022-2032
Figure 81: Asia Pacific Business Intelligence Market Value (US$ Mn) and Year-on-Year Growth, 2015-2032
Figure 82: Asia Pacific Business Intelligence Market Absolute $ Historical Gain (2015 - 2021) and Opportunity (2022 – 2032), US$ Mn
Figure 83: Asia Pacific Business Intelligence Market Share,By Deployment Mode, 2022 & 2032
Figure 84: Asia Pacific Business Intelligence Market Y-o-Y Growth Projections,By Deployment Mode – 2022-2032
Figure 85: Asia Pacific Business Intelligence Market Attractiveness Index,By Deployment Mode – 2022-2032
Figure 86: Asia Pacific Business Intelligence Market Share, By Component, 2022 & 2032
Figure 87: Asia Pacific Business Intelligence Market Y-o-Y Growth Projections, By Component – 2022-2032
Figure 88: Asia Pacific Business Intelligence Market Attractiveness Index, By Component – 2022-2032
Figure 89: Asia Pacific Business Intelligence Market Share, By Vertical, 2022 & 2032
Figure 90: Asia Pacific Business Intelligence Market Y-o-Y Growth Projections, By Vertical – 2022-2032
Figure 91: Asia Pacific Business Intelligence Market Attractiveness Index, By Vertical – 2022-2032
Figure 92: Asia Pacific Business Intelligence Market Share, By Organization Size, 2022 & 2032
Figure 93: Asia Pacific Business Intelligence Market Y-o-Y Growth Projections, By Organization Size – 2022-2032
Figure 94: Asia Pacific Business Intelligence Market Attractiveness Index, By Organization Size – 2022-2032
Figure 95: Asia Pacific Business Intelligence Market Share, By Business Function, 2022 & 2032
Figure 96: Asia Pacific Business Intelligence Market Y-o-Y Growth Projections, By Business Function – 2022-2032
Figure 97: Asia Pacific Business Intelligence Market Attractiveness Index, By Business Function – 2022-2032
Figure 98: Asia Pacific Business Intelligence Market Share, By Country, 2022 & 2032
Figure 99: Asia Pacific Business Intelligence Market Y-o-Y Growth Projections, By Country – 2022-2032
Figure 100: Asia Pacific Business Intelligence Market Attractiveness Index, By Country – 2022-2032
Figure 101: MEA Business Intelligence Market Value (US$ Mn) and Year-on-Year Growth, 2015-2032
Figure 102: MEA Business Intelligence Market Absolute $ Historical Gain (2015 - 2021) and Opportunity (2022 – 2032), US$ Mn
Figure 103: MEA Business Intelligence Market Share,By Deployment Mode, 2022 & 2032
Figure 104: MEA Business Intelligence Market Y-o-Y Growth Projections,By Deployment Mode – 2022-2032
Figure 105: MEA Business Intelligence Market Attractiveness Index,By Deployment Mode – 2022-2032
Figure 106: MEA Business Intelligence Market Share, By Component, 2022 & 2032
Figure 107: MEA Business Intelligence Market Y-o-Y Growth Projections, By Component – 2022-2032
Figure 108: MEA Business Intelligence Market Attractiveness Index, By Component – 2022-2032
Figure 109: MEA Business Intelligence Market Share, By Vertical, 2022 & 2032
Figure 110: MEA Business Intelligence Market Y-o-Y Growth Projections, By Vertical – 2022-2032
Figure 111: MEA Business Intelligence Market Attractiveness Index, By Vertical – 2022-2032
Figure 112: MEA Business Intelligence Market Share, By Organization Size, 2022 & 2032
Figure 113: MEA Business Intelligence Market Y-o-Y Growth Projections, By Organization Size – 2022-2032
Figure 114: MEA Business Intelligence Market Attractiveness Index, By Organization Size – 2022-2032
Figure 115: MEA Business Intelligence Market Share, By Business Function, 2022 & 2032
Figure 116: MEA Business Intelligence Market Y-o-Y Growth Projections, By Business Function – 2022-2032
Figure 117: MEA Business Intelligence Market Attractiveness Index, By Business Function – 2022-2032
Figure 118: MEA Business Intelligence Market Share, By Country, 2022 & 2032
Figure 119: MEA Business Intelligence Market Y-o-Y Growth Projections, By Country – 2022-2032
Figure 120: MEA Business Intelligence Market Attractiveness Index, By Country – 2022-2032
Need specific information?
Request CustomizationExplore Technology Insights
View Reports