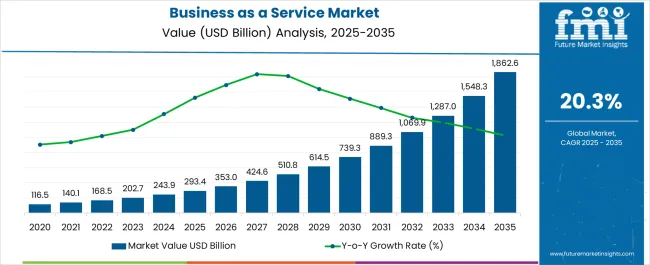
The Business as a Service Market is estimated to be valued at USD 293.4 billion in 2025 and is projected to reach USD 1862.6 billion by 2035, registering a compound annual growth rate (CAGR) of 20.3% over the forecast period.
| Metric | Value |
|---|---|
| Business as a Service Market Estimated Value in (2025 E) | USD 293.4 billion |
| Business as a Service Market Forecast Value in (2035 F) | USD 1862.6 billion |
| Forecast CAGR (2025 to 2035) | 20.3% |
The business as a service market is gaining strong momentum due to increasing digital transformation initiatives, adoption of cloud native platforms, and the need for cost efficient scalable solutions. Organizations across industries are shifting from capital intensive IT infrastructure models to service based frameworks that enhance operational agility and reduce overheads.
Advancements in cloud computing, artificial intelligence, and API integration have strengthened the reliability and performance of service platforms. The pandemic accelerated the move toward remote work models, further boosting reliance on cloud delivered services for collaboration, security, and data management.
Regulatory compliance requirements and a focus on data driven decision making are also driving enterprises toward subscription based solutions that can be easily customized. The long term outlook remains positive as enterprises increasingly prioritize flexible, resilient, and innovation driven service models that align with evolving business strategies.
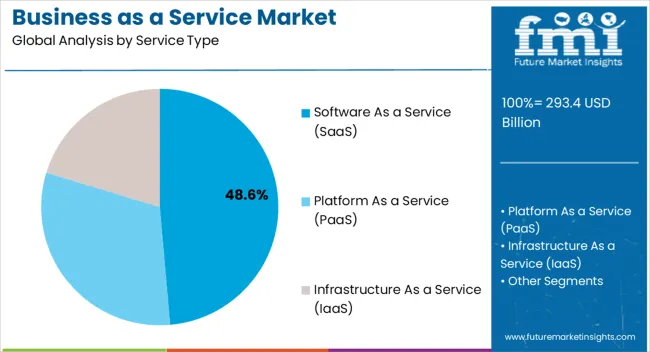
The software as a service segment is projected to contribute 48.60% of overall revenue by 2025, making it the leading service type. This dominance is supported by its ability to provide scalable, subscription based access to critical software applications without the need for heavy upfront investments.
SaaS has been favored for its ease of deployment, low maintenance requirements, and seamless integration with existing enterprise systems. Its adoption has been reinforced by growing demand for collaboration tools, customer relationship management solutions, and enterprise resource planning applications.
Continuous improvements in cybersecurity and compliance features have further strengthened confidence in SaaS platforms. As enterprises seek flexible and cost efficient digital solutions, SaaS continues to represent the cornerstone of the business as a service model.
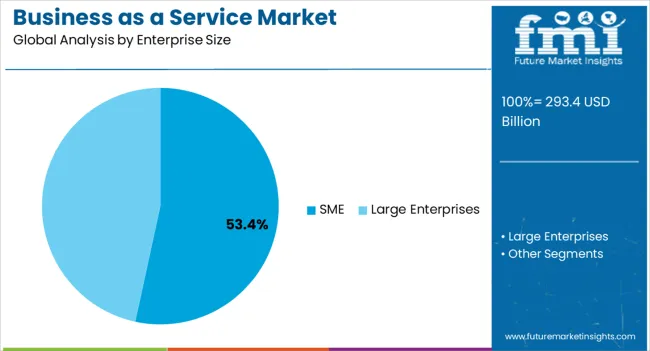
The SME segment is expected to account for 53.40% of total revenue by 2025 within the enterprise size category, positioning it as the leading segment. This growth is being driven by the affordability and scalability that business as a service offerings provide to smaller enterprises.
SMEs have increasingly adopted these services to overcome budget constraints and to access enterprise grade tools that support competitiveness and growth. The ability to deploy solutions quickly without large capital expenditure has made BaaS highly attractive for this segment.
Furthermore, the demand for digitalization among SMEs, particularly in emerging markets, has accelerated adoption rates. As service providers tailor offerings to the specific needs of SMEs, this segment is set to maintain its leading position in driving overall market expansion.
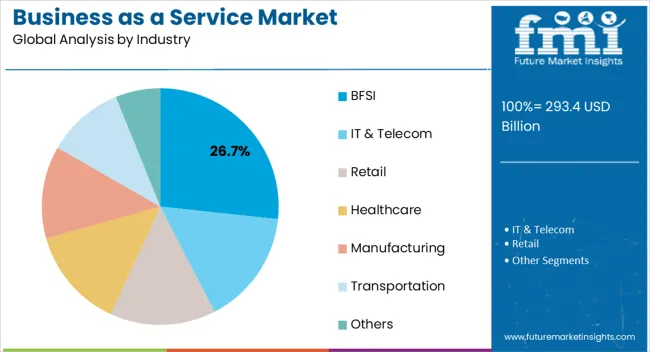
The BFSI segment is projected to hold 26.70% of the overall revenue by 2025, making it the largest contributor within the industry category. This leadership is attributed to the sector’s need for secure, scalable, and compliant digital infrastructure to manage sensitive financial data and transactions.
The BFSI industry has adopted business as a service models to enhance customer experience, optimize operational efficiency, and meet evolving regulatory requirements. Growing reliance on digital banking, fintech platforms, and automated risk management solutions has further supported this transition.
Investments in cloud based analytics, fraud detection, and secure transaction platforms have also played a key role. As financial institutions continue to prioritize digital resilience and customer centric service delivery, BFSI remains the dominant industry vertical within the business as a service market.
When we compare the historical CAGR (2020 to 2025) with the CAGR of the forecast period, it gives us a glimpse of the fact that the market might expand in the coming times. The historical CAGR was 18.2%, and the CAGR for the forecast period is anticipated to be 20.2%. There is not much difference but with businesses continuing to focus on the online mode and technological upgradations, the figures do present a gist of what the business as a service (BaaS) market is capable of achieving going ahead.
By comparing the valuation of the market in 2020, which was USD 293.4 million, with the valuation of 2025, USD 170800 million, and the anticipated valuation of USD 1074100 million, we can notice that the market is expected to grow by leaps and bounds.
Service Available on the Pot: We are living in a time of instant gratification. Verticals across the businesses want to immediately access the services which are delivered by someone else. The application of business as a service helps us achieve this using cloud technology.
Democratization of Functions: One of the biggest benefits of using this service is that the application of cloud technology is democratizing the functionalities. This promotes the concept of crowdsourcing within the organization, as a result of which only the best practices are applied across departments. This is anticipated to increase the demand for business as a Service.
Flexibility: It is essential to understand that companies that have been operating for quite a long time cannot change their conventional systems on an immediate basis. However, with the usage of business as a service (BaaS), the companies can either rope in or discard what they wish to spontaneously on a real-time basis.
Parting Ways with Expensive Ownership: The business as a service has even moved beyond the business cloud computing model. Now enterprises can convert any product to a service offering. This allows the companies to invest only in the required places, instead of dealing with expensive ownership and dealing only with variable costs.
Tracking Performance within Seconds: With so many crucial metrics available for tracking the performance of a business, the application of business as a service ensures that every possible metric associated with a business can be tracked almost every second. This as well might surge the demand for business as a service.
Applying the Apt Model: The business as a service model experiments with multiple ideas, tests them, and finally implements the one that offers the best result during the simulation stage.
Difficulty in Capturing Full Value: Capturing the full value while adopting a business as a service requires us to follow a multi-year journey which may include challenges like evolving supply chain management, financial models, etc. Progress towards the new business model should be made only after careful analysis, else the business might have to face something undesirable.
Complicated Process: The application of this service is different for different kinds of companies. The intensity of complications varies depending on the product/service. Therefore, it is critical to understand the applicability of business as a service model to a given process, before making any decision.
Valid only for Subscription-based Model: Undoubtedly, customer delight is something that companies in the current times aim for. However, if the offerings perform below customer expectations, the customers would certainly not renew the subscription. This might negatively affect the demand for Business as a Service.
Growth of the E-commerce Market: Based on market research, the E-commerce industry is expected to secure a CAGR of around 15% during the forecast period.
The usage of business as a service in E-commerce could allow companies to launch a multi-channel direct-to-consumer sales offering quickly. For this, the enterprises do not have to manufacture anything in-house. Everything is available, including the E-commerce platform, analytics, etc.
Growth of the Cloud Computing Market: Based on market research, the cloud computing market is projected to expand at a CAGR of 16.3% through 2035.
The business as a service market share might increase in the future, as the business as a service market to a large extent depends on cloud computing technology for data storage.
North America’s market, which had a market share of 30.1% in 2025, is expected to be one of the most significant markets during the forecast period also.
Technological advancements and increased investments in research and development are the key factors that are expected to increase the adoption of business as a service in the region. Additionally, the rapid growth of the IT and E-Commerce industry in the region is also expected to drive the business as a service market.
Asia Pacific market, which had a share of 30.5% in 2025, is anticipated to display massive growth during the forecast period. Moreover, the region is expected to be a notably growing market during the forecast period.
Some of the factors fueling the growth of the business as a service market are rapid urbanization, upgradation of infrastructure, and rapid penetration of the internet in the region. Additionally, the rapid growth of the IT, IoT, and E-Commerce industry in the region is expected to surge the growth of the business as a service market.
Europe’s market had a share of 23.3% in 2025 and is expected to grow during the forecast period also. Like North America’s market, technological advancements in this region are expected to drive the business as a service market in the region. Additionally, the prominence of data tracking in this region is expected to propel the market further.
The Middle East Asia market had a share of 6.6% and Latin America’s market had a share of 8% in 2025. Both regions are not going to exhibit high growth during the forecast period. It is due to not many activities about the development of IT-related infrastructure shaping up in this region. Moreover, the focus of authorities in this region is not much on such technological activities.
The United States market had a share of 17.6% in the North American region in 2025. The reason is fast advancements were made in the area of technology, along with a higher focus on research and development. This displays the business as a service market opportunity in the United States of America. Additionally, industries like IT and IoT industry are growing in the country, which has propelled the growth of the business as a service market in the country.
The United Kingdom market is anticipated to expand at a CAGR of 19.2% in the forecast period. A high focus on flexibility and looking at ways to apply the right model for a business problem is something that is driving the market in the region. Moreover, the ability to provide data on the spot is something that is further fueling the business as a service market in the region. This is expected to drive the business as a service market future trends in the United Kingdom.
During the forecast period, the market is anticipated to expand at a CAGR of 17.2%. There is a higher focus to upgrade the existing technological infrastructure. This is one of the reasons which is expected to drive the business as a service market in the country. Moreover, there is also an increasing demand for cloud technologies in the region, which is expected to propel the business as a service market.
The market is predicted to expand at a CAGR of 22.3% during the forecast period. Rapid technological advancements and increasing initiatives to upgrade the existing infrastructure are some of the factors which might contribute to the growth of the business as a service market. Apart from that, the growth of IT, IoT, and E-Commerce sectors is expected to change the business as a service market outlook in the forecast period.
Japan had a market share of 5.4% in the Asia Pacific region in 2024. During the forecast period, the market is expected to capture a CAGR of 13.4%.
Being a technologically advanced country, Japan currently has all that it takes to develop a world-class business as a service market. But, the continuous advancements in technology are something which is keeping this market rather occupied. Moreover, the growth of IT and Cloud computing sectors is expected to drive this market.
By Service Type, the Software as a Service (SaaS) Segment had a High Market Share of 43.2% in 2025.
The reason being the growth of this segment is this model offers high agility and cost-effectiveness for the companies. Moreover, the SaaS is simple to access, has seamless user accessibility, and provides the much-required security. This is expected to have a significant impact on the business as a service market key trends and opportunities.
The Platform as a Service (PaaS) has a Share of 20.9% in this Segment.
It is reasonably popular as it offers custom solutions, and flexibility, and can significantly add capacity in peak times as well. However, lock-in and security risks are some of the challenges faced by this application.
Infrastructure as a Service (IaaS) has a Share of 11.5% in this Segment.
The best thing about using IaaS is that these can also run when there are some issues with the server. However, lack of flexibility, security, and maintenance are some of the challenges associated with it.
Large Enterprises had a Significant Market Share
Large enterprises had a higher market share of 60.4% in 2025, as compared to SMEs, which had a share of 35.6%. The reason is, that large enterprises deal with huge data sets, which can be structured data as well as semi-structured data. Many times these data have to be readily accessible. This is something that has prompted many large enterprises to implement business as a service as part of their undertakings. This is expected to influence the business as a service market trends and forecasts. Moreover, this data should be maintained with utmost privacy. This is the reason why large enterprises avail this service.
The IT & Telecom Sector was Closely Followed by the BFSI sector, which had a Share of 21.8%.
The reason why the IT & Telecom, and the BFSI sector had significant market shares were both sectors were dealing with vast amount of data. By making use of cloud technology, the business as a service application can handle such huge data.
The data can be retrieved as and when required. Additionally, the ability to track the performance of the business in seconds, makes it a go-to application for many business owners. This was inferred from the business as a service market analysis.
The manufacturing sector had a share of 15.1%, and the retail sector had a share of 14.6%. Both these sectors made use of business as a service because of its ability to be flexible and democratize the data.
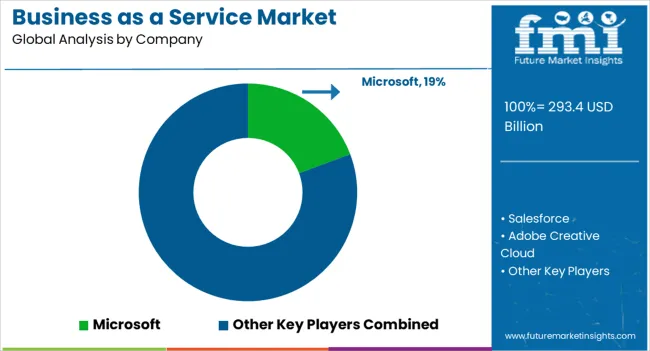
The key players are looking at ways to empower cloud service with trust and transparency as per compliance with GDPR requirements with increasing cases of data theft and cybersecurity issues. This could certainly reaffirm commitments to global data protection laws and standards.
Recent Developments
The global business as a service market is estimated to be valued at USD 293.4 billion in 2025.
The market size for the business as a service market is projected to reach USD 1,862.6 billion by 2035.
The business as a service market is expected to grow at a 20.3% CAGR between 2025 and 2035.
The key product types in business as a service market are software as a service (saas), platform as a service (paas) and infrastructure as a service (iaas).
In terms of enterprise size, sme segment to command 53.4% share in the business as a service market in 2025.


Full Research Suite comprises of:
Market outlook & trends analysis
Interviews & case studies
Strategic recommendations
Vendor profiles & capabilities analysis
5-year forecasts
8 regions and 60+ country-level data splits
Market segment data splits
12 months of continuous data updates
DELIVERED AS:
PDF EXCEL ONLINE
Business Process as a Service (BPaaS) Market Analysis by Process and Region Through 2035
Business Analytics BPO Services Market Analysis – Size, Share & Forecast 2025 to 2035
Competitive Overview of Business Analytics BPO Services Companies
Business Analytics BPO Services Market Growth – Trends & Forecast 2023-2033
Business Analytics BPO Services Market Growth – Trends & Forecast 2023-2033
Business Analytics BPO Services Market Growth – Trends & Forecast 2023-2033
Business Card Holder Market from 2024 to 2034
Business Email Market Analysis by Channel, Deployment, and Region Through 2035
Business Storage Units Market Size and Share Forecast Outlook 2025 to 2035
Business Jet Market Size and Share Forecast Outlook 2025 to 2035
Business Process Automation (BPA) Market Size and Share Forecast Outlook 2025 to 2035
Business Intelligence Market Size and Share Forecast Outlook 2025 to 2035
Business Cloud VoIP & UC Services Market Size and Share Forecast Outlook 2025 to 2035
Business Value Dashboard Market Size and Share Forecast Outlook 2025 to 2035
Data Business in Oil & Gas Market Size and Share Forecast Outlook 2025 to 2035
Cloud Business Email Market Report – Trends & Forecast 2017-2027
Fixed Business Voice Platforms And Services Market Size and Share Forecast Outlook 2025 to 2035
Social Business Intelligence Market Growth – Trends & Forecast 2024-2034
Embedded Business Intelligence Market Growth – Trends & Forecast 2023-2033
Automotive Business Process Management Market Analysis 2025 to 2035 By Enterprise Size, Deployment Type, Pricing, Functions, and Region

Thank you!
You will receive an email from our Business Development Manager. Please be sure to check your SPAM/JUNK folder too.
Chat With
MaRIA