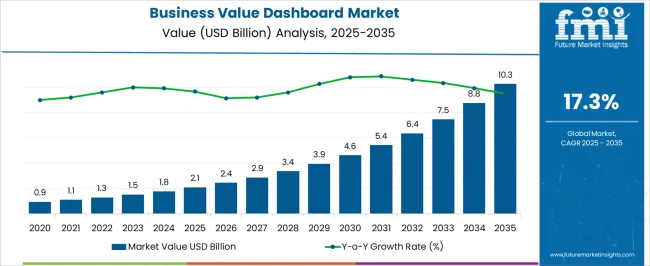
The Business Value Dashboard Market is estimated to be valued at USD 2.1 billion in 2025 and is projected to reach USD 10.3 billion by 2035, registering a compound annual growth rate (CAGR) of 17.3% over the forecast period.
| Metric | Value |
|---|---|
| Business Value Dashboard Market Estimated Value in (2025 E) | USD 2.1 billion |
| Business Value Dashboard Market Forecast Value in (2035 F) | USD 10.3 billion |
| Forecast CAGR (2025 to 2035) | 17.3% |
The business value dashboard market is experiencing notable growth as organizations increasingly seek data-driven visibility into key performance metrics and operational outcomes. The market is being propelled by the rise of real-time analytics, executive decision dashboards, and KPI tracking tools that provide strategic insights beyond traditional BI platforms.
Companies across sectors are prioritizing enterprise-wide transparency and are integrating business value dashboards with ERP, CRM, and cloud-native platforms to unify reporting and analytics. Advancements in AI and machine learning are further enriching dashboard capabilities with predictive insights and anomaly detection, enabling faster decision-making.
Additionally, remote and hybrid work environments have accelerated the adoption of dashboards that provide centralized access to multi-source performance data. As businesses continue aligning their digital transformation initiatives with measurable ROI and stakeholder value, the business value dashboard market is expected to benefit from long-term tailwinds supported by cross-industry applicability and evolving analytics ecosystems.
The market is segmented by Component, Segmentation, and Verticals and region. By Component, the market is divided into Software and Services. In terms of Segmentation, the market is classified into Software-as-a-Service and On-premises. Based on Verticals, the market is segmented into BFSI, IT and Telecommunications, Retail, Healthcare, Manufacturing, Utilities, Government & Defense, Transportation, and Others. Regionally, the market is classified into North America, Latin America, Western Europe, Eastern Europe, Balkan & Baltic Countries, Russia & Belarus, Central Asia, East Asia, South Asia & Pacific, and the Middle East & Africa.
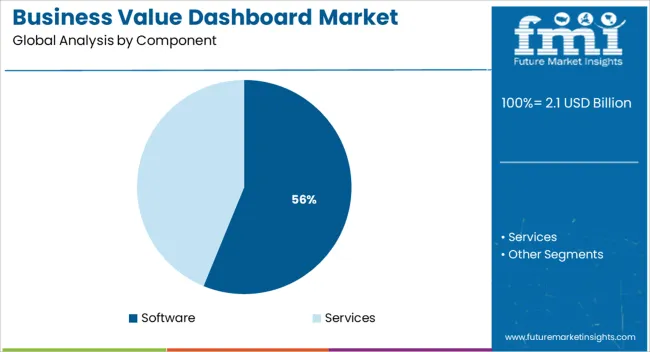
Within the component category, the software segment is expected to lead with a 56.2% revenue share in 2025. This dominance is driven by increasing demand for agile, scalable, and customizable software platforms that integrate seamlessly with existing enterprise systems.
Organizations are prioritizing software-based dashboards for their ability to deliver real-time visualization, automated insights, and cloud compatibility. The shift toward user-friendly interfaces with drag-and-drop functionality and low-code development environments has expanded user access beyond IT teams.
Enhanced interoperability with APIs and growing support for embedded analytics have positioned software as the foundational element in modern dashboard deployments. With enterprises emphasizing strategic intelligence and personalized reporting capabilities, software-based solutions have emerged as the preferred choice across mid-size and large-scale deployments, cementing their leadership in the component segment.
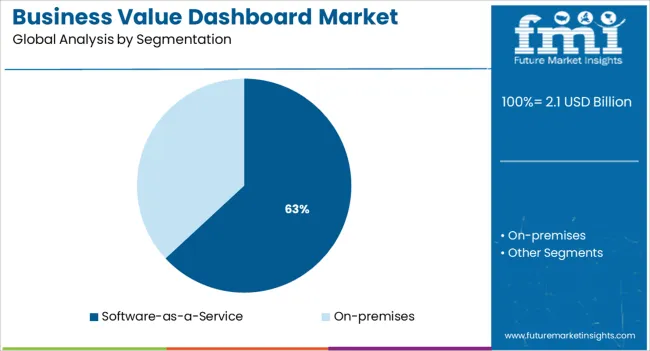
The software-as-a-service subsegment under deployment is forecast to hold a 63.1% revenue share in 2025, establishing it as the dominant model. This leadership is attributed to the scalability, cost-effectiveness, and reduced IT overhead offered by cloud-based delivery.
Businesses are increasingly opting for SaaS models to accelerate implementation timelines and access regular updates without the need for complex in-house infrastructure. The ability to support multi-device access, enable remote collaboration, and ensure continuous uptime has made SaaS dashboards integral to operational monitoring in distributed work environments.
Vendors are enhancing offerings with industry-specific templates and security frameworks, further aligning with enterprise compliance and customization needs. As digital-first strategies expand across verticals, SaaS-based dashboard deployments are expected to remain at the forefront of business intelligence transformation.
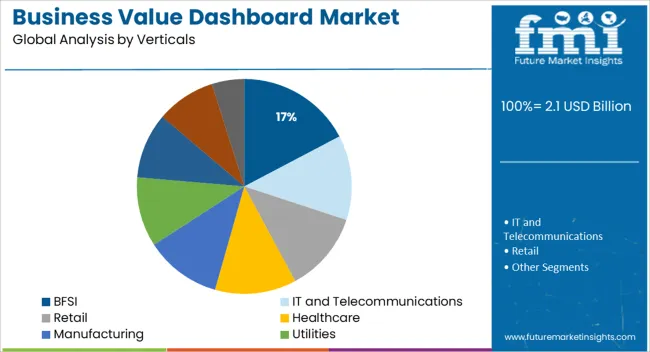
In terms of industry verticals, the BFSI segment is projected to account for 17.3% of total revenue in 2025, making it the leading sector in dashboard adoption. This growth is driven by the sector’s intensive need for real-time financial tracking, regulatory compliance, and risk management insights.
Financial institutions are deploying business value dashboards to monitor loan portfolios, liquidity positions, operational performance, and customer engagement metrics. The increasing complexity of regulatory frameworks has also fueled demand for dashboards that provide transparent, auditable, and actionable insights.
Integration with core banking, insurance, and investment platforms allows for consolidated views of enterprise health, which supports decision-making across branches and departments. Additionally, the growing emphasis on cybersecurity, fraud detection, and ESG metrics has further encouraged BFSI players to adopt advanced dashboard solutions that ensure transparency and accountability in a dynamic market environment.
| DRIVERS | The vast volume of data in it and other industries which needs to monitor and understand is a major driver for the business value dashboard market. |
|---|---|
| RESTRAINTS | Technophobia and reluctance the adoption of new technology |
| OPPORTUNITIES | Integration of automated analysis and results for the business value dashboard |
| THREATS | High costs involved in migration and system infrastructure deployment |
It is anticipated that the IT sector would majorly drive the demand for business value dashboard trends during the forecast period. To support the ongoing regulations and compliances, coupled with an augmentation of transparency and unified integration, the information technology sector is expected to fuel the market expansion for business value dashboards.
The manufacturers are also introducing AI-powered products to increase the AI capabilities of analytics. This would help in real-time analysis and effective decision-making, with the dynamic representation of data, further fueling the growth of the BVD market during the period 2025 to 2035. The business value dashboard is also expected to help the incumbents of various industries such as BFSI and manufacturing, proving to be beneficial by ensuring the accuracy of information and risk management.
However, certain challenges are also anticipated that are likely to inhibit the growth of the business value dashboard market in the coming years. It is witnessed that the changing data according to the location of the offices is posing challenges for data procurement. Furthermore, the high expenses incurred can also limit the growth of the BVD market in the upcoming years.
| Segment | Software Segment (By Services) |
|---|---|
| Recorded Share in Base Year | The software segment accounted for the largest revenue share of over 76.4% in 2024. |
| Description | The importance of business value dashboards boosting the adoption of BVDs by small and medium enterprises is anticipated to drive the growth of the software segment in the coming years. Several firms are adopting business value dashboards to fulfill regulatory compliances, including data privacy needs and financial reporting, discarding duplication of data, and improving organizational productivity. |
| Segment | On-Premise Segment (By Deployment) |
|---|---|
| Recorded Share in Base Year | The on-premise segment held a revenue share of over 45% in 2024. |
| Description | Several organizations are shifting from manual systems to automated systems to carry out various operations. This has triggered the demand for on-premise software. Several organizations are availing of on-premise deployment due to increased security features. |
| Segment | Large Enterprise Segment (By Enterprise Size) |
|---|---|
| Recorded Share in Base Year | The large enterprise segment held the highest market share of 67.3% in 2024. |
| Description | The rising adoption can be attributed to robust monitoring solutions and automation capabilities for resource allocation and strategic decision-making across large firms. Therefore, the BVD market is likely to propel further with wide adoption by the concerned enterprises. |
It is projected that the business value dashboard market is currently dominated by the North American regions, specifically by the USA and Canada with a considerable share of 29.5%, owing to numerous factors.
Increasing demand for risk management solutions and the rise in requirement of on-time authentic information. The presence of the biggies of the market is putting a strong emphasis on the digital transformation of this region and North America is being considered one of the early adopters of next-generation technologies.
According to Canadian Radio-Television and Telecommunications Commission (CRTC), the Canadian telecom industry achieved a growth rate of 3.2% in recent years, which in turn is likely to fuel the BVD market.
Europe is likely to hold the second largest share and the expanding market size of business value dashboards in Germany and Italy, the expansion can be attributed to fast adopting solutions in the various end-user industries such as utilities, manufacturing, and more.
How are The New Entrants Stirring Up the BVD market?
The performance of the start-ups is continually getting optimized with the utilization of new trends in the market and through indulgences in continuous integration and deployment of more advanced features in the business value dashboards.
Databricks - Databricks was established in 2013 by the developers of Apache SparkTM, Delta Lake, and MLflow, all of whom had their start in academia or the open-source community. Databricks is the first and only cloud-based lakehouse platform, merging the advantages of traditional data warehouses with those of newer, more flexible data lakes.
Databricks is used by over 7,000 companies throughout the globe today to provide massive-scale data engineering, collaborative data science, full-lifecycle machine learning, and business analytics.
Arcion - It is a Mumbai-based cloud-based start-up that provides data pipeline solutions. With its help, customers can set up real-time data pipelines, as the platform is a business intelligence platform with zero-code data mobility options. Data capture, validation, and transformation are just some of the several services it offers.
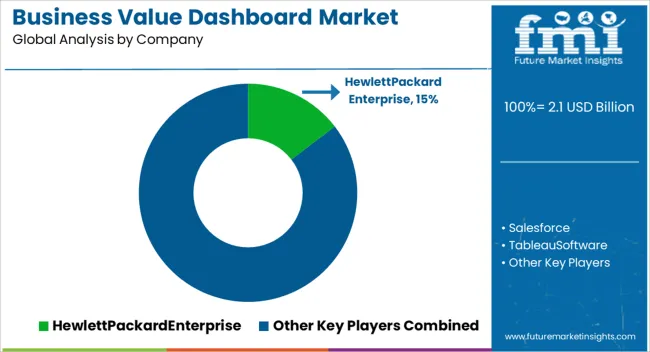
Market Leaders and Their Expansionary Development Strategies
The market players in the business value dashboard market are enabling open innovation. The manufacturers are paying keen attention to continually upgrading their solutions for expanding the market share of business value dashboards.
The companies can be seen engaging in mergers & acquisitions and partnerships to further upgrade their products and gain a competitive advantage in the market. They are effectively working on new product development, and enhancement of existing products to acquire new customers and capture more market shares.
Recent Developments
| Attributes | Details |
|---|---|
| Growth Rate | CAGR of 17.3% from 2025 to 2035 |
| The base year for Estimation | 2024 |
| Historical Data Available for | 2020 to 2024 |
| Forecast Period | 2025 to 2035 |
| Quantitative Units | Revenue in USD Million and CAGR from 2025 to 2035 |
| Report Coverage | Revenue Forecast, Volume Forecast, Company Ranking, Competitive Landscape, Growth Factors, Trends, and Pricing Analysis. |
| Segments Covered | By Component, By Segmentation, By Verticals, Region |
| Regions Covered | North America; Latin America; Asia Pacific; Japan; Western Europe; Eastern Europe; Middle East & Africa |
| Key Countries Profiled | The United States of America, Canada, Brazil, Argentina, Germany, The United Kingdom, France, Spain, Italy, Nordics, BENELUX, Australia & New Zealand, China, India, GCC Countries, South Africa |
| Key Companies Profiled | Hewlett Packard Enterprise; Interlink Software Services Ltd.; eMite; Salesforce.com; PureShare by TeamQuest; Proxima Software Solutions; Tableau Software; International Business Machines Corporation; ServiceClarity |
| Customization | Available upon Request |
The global business value dashboard market is estimated to be valued at USD 2.1 billion in 2025.
The market size for the business value dashboard market is projected to reach USD 10.3 billion by 2035.
The business value dashboard market is expected to grow at a 17.3% CAGR between 2025 and 2035.
The key product types in business value dashboard market are software and services.
In terms of segmentation, software-as-a-service segment to command 63.1% share in the business value dashboard market in 2025.


Our Research Products

The "Full Research Suite" delivers actionable market intel, deep dives on markets or technologies, so clients act faster, cut risk, and unlock growth.

The Leaderboard benchmarks and ranks top vendors, classifying them as Established Leaders, Leading Challengers, or Disruptors & Challengers.

Locates where complements amplify value and substitutes erode it, forecasting net impact by horizon

We deliver granular, decision-grade intel: market sizing, 5-year forecasts, pricing, adoption, usage, revenue, and operational KPIs—plus competitor tracking, regulation, and value chains—across 60 countries broadly.

Spot the shifts before they hit your P&L. We track inflection points, adoption curves, pricing moves, and ecosystem plays to show where demand is heading, why it is changing, and what to do next across high-growth markets and disruptive tech

Real-time reads of user behavior. We track shifting priorities, perceptions of today’s and next-gen services, and provider experience, then pace how fast tech moves from trial to adoption, blending buyer, consumer, and channel inputs with social signals (#WhySwitch, #UX).

Partner with our analyst team to build a custom report designed around your business priorities. From analysing market trends to assessing competitors or crafting bespoke datasets, we tailor insights to your needs.
Supplier Intelligence
Discovery & Profiling
Capacity & Footprint
Performance & Risk
Compliance & Governance
Commercial Readiness
Who Supplies Whom
Scorecards & Shortlists
Playbooks & Docs
Category Intelligence
Definition & Scope
Demand & Use Cases
Cost Drivers
Market Structure
Supply Chain Map
Trade & Policy
Operating Norms
Deliverables
Buyer Intelligence
Account Basics
Spend & Scope
Procurement Model
Vendor Requirements
Terms & Policies
Entry Strategy
Pain Points & Triggers
Outputs
Pricing Analysis
Benchmarks
Trends
Should-Cost
Indexation
Landed Cost
Commercial Terms
Deliverables
Brand Analysis
Positioning & Value Prop
Share & Presence
Customer Evidence
Go-to-Market
Digital & Reputation
Compliance & Trust
KPIs & Gaps
Outputs
Full Research Suite comprises of:
Market outlook & trends analysis
Interviews & case studies
Strategic recommendations
Vendor profiles & capabilities analysis
5-year forecasts
8 regions and 60+ country-level data splits
Market segment data splits
12 months of continuous data updates
DELIVERED AS:
PDF EXCEL ONLINE
Business Jet Market Size and Share Forecast Outlook 2025 to 2035
Business Storage Units Market Size and Share Forecast Outlook 2025 to 2035
Business as a Service Market Size and Share Forecast Outlook 2025 to 2035
Business Cloud VoIP & UC Services Market Size and Share Forecast Outlook 2025 to 2035
Business Intelligence Market Size and Share Forecast Outlook 2025 to 2035
Business Process Automation (BPA) Market Size and Share Forecast Outlook 2025 to 2035
Business Analytics BPO Services Market Analysis – Size, Share & Forecast 2025 to 2035
Business Email Market Analysis by Channel, Deployment, and Region Through 2035
Business Process as a Service (BPaaS) Market Analysis by Process and Region Through 2035
Competitive Overview of Business Analytics BPO Services Companies
Business Card Holder Market from 2024 to 2034
Business Analytics BPO Services Market Growth – Trends & Forecast 2023-2033
Business Analytics BPO Services Market Growth – Trends & Forecast 2023-2033
Business Analytics BPO Services Market Growth – Trends & Forecast 2023-2033
Data Business in Oil & Gas Market Size and Share Forecast Outlook 2025 to 2035
Fixed Business Voice Platforms And Services Market Size and Share Forecast Outlook 2025 to 2035
Cloud Business Email Market Report – Trends & Forecast 2017-2027
Social Business Intelligence Market Growth – Trends & Forecast 2024-2034
Embedded Business Intelligence Market Growth – Trends & Forecast 2023-2033
IBC Rental Business Market Size and Share Forecast Outlook 2025 to 2035

Thank you!
You will receive an email from our Business Development Manager. Please be sure to check your SPAM/JUNK folder too.
Chat With
MaRIA