The IoT in Utilities Market is estimated to be valued at USD 43.5 billion in 2025 and is projected to reach USD 151.6 billion by 2035, registering a compound annual growth rate (CAGR) of 13.3% over the forecast period.
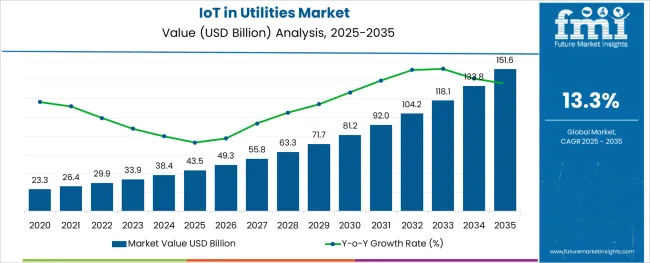
The IoT in utilities market is experiencing accelerated growth as utility providers increasingly adopt connected technologies to enhance operational efficiency, infrastructure reliability, and customer service delivery. The rising complexity of energy grids, water networks, and gas distribution systems has necessitated the integration of IoT-enabled solutions for real-time monitoring, predictive maintenance, and automated control.
Market momentum is being fueled by regulatory mandates for energy efficiency, heightened demand for renewable energy integration, and the requirement for enhanced grid resilience against environmental and cybersecurity threats. In addition, utility operators are prioritizing digital transformation initiatives to address the growing pressure of aging infrastructure and fluctuating demand patterns.
The market is projected to witness sustained growth over the coming years, driven by the expanding deployment of advanced metering infrastructure, intelligent asset management systems, and cloud-based analytics platforms. The proliferation of 5G networks and edge computing capabilities is also expected to improve IoT system responsiveness and scalability, further cementing the role of connected technologies in modern utility operations. As governments and utilities prioritize sustainability goals and customer-centric services, IoT applications will continue to be pivotal in reshaping the operational landscape of the sector.
The market is segmented by Component, Solution, Service, and Application and region. By Component, the market is divided into Platform, Solutions, and Services. In terms of Solution, the market is classified into Asset Monitoring and Management, Safety and Security, Supervisory Control and Data Acquisition, Workforce Management, Network Management, and Customer Information System and Billing System. Based on Service, the market is segmented into Consulting, Integration and Deployment, and Support and Maintenance. By Application, the market is divided into Water and Wastewater Management, Utility Gas Management, and Electricity Grid Management. Regionally, the market is classified into North America, Latin America, Western Europe, Eastern Europe, Balkan & Baltic Countries, Russia & Belarus, Central Asia, East Asia, South Asia & Pacific, and the Middle East & Africa.
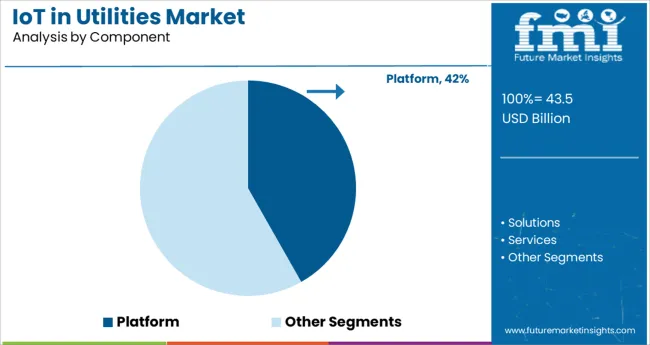
Within the component category, the platform segment held a commanding 41.8% share of the IoT in utilities market, establishing itself as the most significant contributor. This dominance is attributed to the indispensable role IoT platforms play in integrating diverse devices, data sources, and applications within a unified framework.
Utilities increasingly rely on these platforms to facilitate seamless communication between assets, optimize operational workflows, and support data-driven decision-making. The demand for scalable, secure, and cloud-compatible platforms has surged as utilities prioritize remote asset monitoring, predictive maintenance, and grid optimization initiatives.
Furthermore, platforms capable of handling large volumes of real-time data, analytics integration, and interoperability with legacy systems have gained substantial traction. Market growth within this segment is expected to remain robust as utilities expand digital infrastructure projects, incorporating AI-enabled analytics and edge computing functionalities into core operations. The platform segment’s ability to centralize disparate data streams and enhance operational visibility positions it as a critical enabler in the ongoing digital transformation strategies pursued by utility providers worldwide.
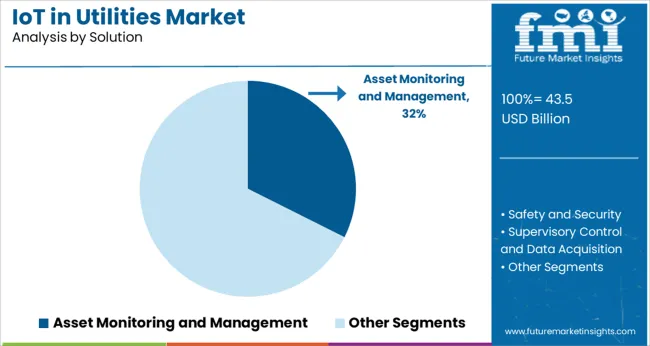
In the solution category, the asset monitoring and management segment led the IoT in utilities market with a substantial 32.4% share, driven by utilities’ growing emphasis on optimizing asset performance, reducing operational downtime, and extending infrastructure lifespan.
The segment’s growth has been bolstered by the increasing deployment of sensors, smart meters, and intelligent control systems that enable real-time visibility into asset health and performance metrics. Utilities are progressively investing in IoT-based asset management systems to support condition-based and predictive maintenance programs, which minimize unplanned outages and maintenance costs while enhancing service reliability.
Additionally, the shift toward decentralized energy resources, electric vehicle integration, and renewable energy assets has amplified the need for advanced asset monitoring solutions capable of managing distributed infrastructure. The segment is poised for continued expansion as regulatory bodies encourage utilities to adopt smart infrastructure solutions and grid modernization programs. The capacity of asset monitoring and management solutions to deliver operational efficiencies, compliance support, and improved asset lifecycle management ensures its sustained relevance in the evolving utility landscape.
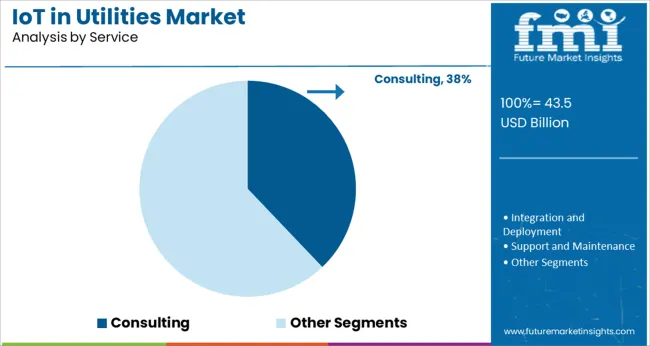
The consulting segment dominated the service category within the IoT in utilities market, capturing a notable 37.9% share owing to the complex nature of IoT project implementation and the strategic importance of customized advisory services.
Utility providers frequently engage consulting firms to navigate digital transformation roadmaps, design scalable IoT architectures, and assess cybersecurity vulnerabilities associated with connected infrastructure. The growing intricacy of integrating legacy systems with IoT platforms and solutions has further driven demand for expert consulting services that offer strategic planning, risk assessment, and regulatory compliance support.
Moreover, consultants play a crucial role in guiding utilities through data governance strategies, vendor selection processes, and system integration challenges, ensuring alignment with both operational objectives and regulatory mandates. The market for consulting services is expected to remain resilient, underpinned by the steady progression of smart grid projects, digital twin deployments, and advanced analytics initiatives. The consulting segment’s ability to deliver value through operational risk mitigation, technology strategy formulation, and end-to-end IoT deployment oversight continues to secure its pivotal position within the utilities sector.
The below table presents the expected CAGR for the global IoT in utilities market over several semi-annual periods spanning from 2025 to 2035. In the first half (H1) of the year from 2025 to 2035, the business is predicted to surge at a CAGR of 12.7%, followed by a slightly higher growth rate of 13.5% in the second half (H2) of the same year.
| Particular | Value CAGR |
|---|---|
| H1 | 12.7% (2025 to 2035) |
| H2 | 13.5% (2025 to 2035) |
| H1 | 12.5% (2025 to 2035) |
| H2 | 13.6% (2025 to 2035) |
Moving into the subsequent period, from H1 2025 to H2 2035, the CAGR is projected to increase slightly to 12.5% in the first half and remain relatively moderate at 13.6% in the second half. In the first half (H1) the market witnessed a decrease of 20 BPS while in the second half (H2), the market witnessed an increase of 10 BPS.
Rising Adoption IoT Enables Real-Time Monitoring and Automation, leading to Optimized Utility Operations and Reduced Operational Costs.
IoT enables real-time monitoring and action in the utilities by connecting sensors and devices that continuously collect data from utility assets and infrastructure and then transmits this data to central systems where it can be analyzed and processed the immediate process. This automation ensures that departmental users are able to maintain high levels of operational efficiency, reducing downtime and service waste.
The consumption of real-time analytics and automation not only improves efficiency but also ominously reduces operating costs. By identifying and addressing problems early, utilities can prevent costly repairs and extensive damage.
The predictive maintenance offered by IoT can operate in time before failure, extending asset lifetime and avoiding expensive emergency measures in addition to the need to manually monitor system if operations and labor-intensive processes, further reducing operating costs. The overall result is a more efficient, reliable and cost-effective operation that benefits both suppliers and end-users.
Smart Meters Revolutionize Utilities with Time Tracking and Energy Efficiency
The adoption of smart meters represents a massive trend within the IoT utilities, pushed by means of the want for actual-time tracking and green strength usage. Smart meters permit software companies to acquire precise intake facts in actual-time, presenting a complete view of electricity usage patterns. This granular information lets in for better call for forecasting, extra correct billing, and stronger customer service.
By leveraging IoT generation, smart meters can speak intake statistics at once to the software issuer, exploit away with the need for manual meter readings and decreasing operational costs. Additionally, purchasers benefit from more visibility into their power utilization, empowering them to make informed choices to reduce their intake and store on energy expenses.
Moreover, the integration of smart meters enables the implementation of advanced electricity management strategies. Utility agencies can use the real-time statistics to optimize grid operations, balance masses, and integrate renewable energy resources extra efficaciously. For instance, for the duration of peak call for extents, utilities can put into effect call for response applications, incentivizing clients to reduce or shift their energy usage.
This not accessible helps in preserving grid stability but also in lowering the reliance on fossil gas-based power plant life. The great adoption of smart meters is likewise important for the improvement of smart grids, which can be critical for the transition to a extra sustainable and efficient energy device. As a result, smart meters play a pivotal function in modernizing the utilities region and advancing in the direction of a better, more resilient, and green strength infrastructure.
Integration of IoT Devices Permits Precise Tracking and Leak Detection of Sustainable Conservation
IoT devices have revolutionized water control by using allowing precise monitoring of water usage in actual time. These devices can monitor water drift costs, come across leaks, and perceive areas of excessive intake with outstanding accuracy.
By presenting utilities and clients with actual-time statistics on water usage styles, IoT gadgets empower stakeholders to make knowledgeable selections approximately conservation measures. For instance, they are able to pinpoint leaks or inefficient water usage conduct and take immediately corrective movements, as a consequence selling water conservation and decreasing waste drastically.
Moreover, IoT-enabled water tracking structures play a crucial position in sustainability efforts. By detecting leaks early on, these gadgets prevent the loss of treasured water resources and mitigate capacity damage to infrastructure. This proactive method not best saves water but also reduces the associated fees of restore and preservation. Additionally, with the aid of selling a culture of conservation and responsible water use, IoT gadgets make a contribution to lengthy-term environmental stewardship, ensuring that water remains a sustainable resource for generations to come back.
Costly Infrastructure and Expertise May Restrict IoT Adoption in Utility
High initial implementation costs and ongoing maintenance costs associated with IoT in the utilities industry can be a significant barrier to adoption IoT infrastructure deployments often require significant investments in hardware, software, and communication solutions. For venture capital firms, which are already operating with tight budgets, this initial capital expenditure can be an important deterrent. Furthermore, ongoing maintenance costs, including upgrades, security measures, and troubleshooting, can significantly strain financial resources over time.
This cost is compounded by the need for specialized expertise to design, deploy, and manage IoT systems in practical areas. Experienced personnel to understand the IoT technology sector and the specific needs of the utility industry are essential but can be expensive to hire or train Furthermore, the rapid pace of technological advances in IoT means that utilities must continue to invest in order to keep abreast of the latest innovations They ensure their presence
The global IoT in utilities market recorded a CAGR of 12.6% during the historical period between 2020 and 2025. The growth of IoT in utilities industry was positive as it reached a value of USD 38,391.6 million in 2025 from USD 30,498.2 million in 2020.
From 2020 to 2025, the global IoT in utilities market witnessed abundant increase pushed by using factors inclusive of growing adoption of clever grid technology, growing demand for green power management solutions, and the want for real-time tracking and control of application infrastructure. Various IoT programs, inclusive of smart meters, distribution automation, and call for reaction systems, received traction during this era.
Vendors and providers invested closely in IoT solutions to optimize operations, reduce expenses, and enhance customer experience within the utilities section. As a result, the sales outlook for IoT in utilities in the course of these years confirmed a consistent growing, with a developing range of utilities integrating IoT technologies into their infrastructure.
Looking ahead from 2025 to 2035, the demand forecast for IoT in utilities is predicted to experience substantial boom pushed by way of numerous key factors. These encompass the continued emphasis on power performance and sustainability, regulatory mandates promoting smart grid projects, and the combination of renewable energy assets into application grids.
The adoption of advanced analytics, synthetic intelligence, and device learning algorithms within IoT structures is projected to enhance operational efficiencies and predictive renovation talents for utilities. Additionally, the emergence of recent IoT packages, including asset performance management and grid optimization, is anticipated to fuel demand for IoT solutions in the utilities sector which led to the expansion of the industry globally.
Tier 1 companies comprise leaders with a revenue of above USD 100 million capturing significant share of 45% to 50% in global landscape. These players are characterized by high production capacity and a wide product portfolio. These companies tend to have more resources, more advanced technology, and more established customers. Tier 1 companies in the IoT utilities industry include General Electric (GE), Siemens, and IBM.
These companies have a strong presence in various infrastructure segments, offering a wide range of IoT solutions such as smart grid management, asset management, energy efficiency, etc. to Their industry to reflect their leadership position and investment in IoT technologies.
Tier 2 companies include mid-size players with revenue of USD 50 to 100 million having presence in specific regions and highly influencing the local market by focusing on niches or offering specialized IoT solutions. Tier 2 companies in this industry are ABB, Schneider Electric and Cisco Systems. They play a key role in driving innovation and competitiveness, contributing to the overall growth and dynamism of the IoT utilities.
Tier 3 companies in the IoT utilities market are usually smaller players or startups that focus on specific niches or emerging technologies in the utilities sector. While their share value may be relatively small compared to Tier 1 and Tier 2 firms, they contribute to diversity and innovation and have limited geographical reach. These firms often bring disruptive technologies and ideas, and it drives innovation and pushes the boundaries in IoT applications for consumer products denoting a sector characterized by a lack of extensive structure and formalization when compared to organized competitors.
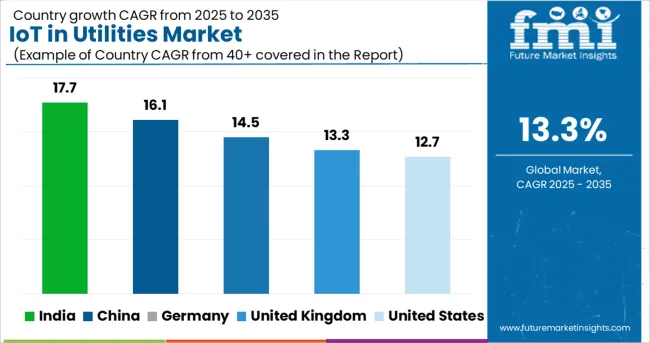
The section below covers the industry analysis for the IoT in utilities market for different countries. Demand analysis on key countries in several countries of the globe, including the United States, India, China, the United Kingdom, and Germany is provided. The United States is anticipated to remain at the forefront in North America, with a value share of 72.4% through 2035. In South Asia and Pacific, India is projected to witness a CAGR of 17.7% by 2035.
| Countries | Value CAGR (2025 to 2035) |
|---|---|
| India | 17.7% |
| China | 16.1% |
| Germany | 14.5% |
| United Kingdom | 13.3% |
| United States | 12.7% |
The United Kingdom is estimated to report a CAGR of 13.3% through 2035. The valuation is set to reach over USD 1,330.4 million by 2035. It holds the highest share in the European space.
Modernize infrastructure and boost resource management have positioned the United Kingdom in commanding position. Countrywide rollout of smart meters are key driver burgeoning the growth of the sector. These meters permit real-time monitoring of energy consumption, empowering consumers to make informed decisions about their custom.
The integration of renewable energy sources into the UK's energy mix is a focal point pouring IoT solutions in utilities. The country's assurance to reducing carbon secretions and transitioning to sustainable energy practices has incited innovation in IoT-enabled technologies for renewable energy integration and management. This includes systems for monitoring solar and wind power generation, optimizing energy storage, and enabling efficient grid operations.
The United States is anticipated to grow at a CAGR of 12.7 % from 2025 to 2035.
The United States emphasis on technology innovation make huge contribution in its success. The impulse for renewable energy sources, ambitious by both government initiatives and public demand for sustainable practices, has boosted the integration of IoT into utility structures. This integration allows for more effective monitoring, management, and optimization of energy resources, contributing to overall sustainability goals.
The presence of major tech companies converging on IoT solutions further energies growth. These companies bring expertise, investment, and advanced solutions to the board, driving the development and adoption of IoT in the utilities sector. Overall, the United States leadership in technology, coupled with its renewable energy push and upgrading initiatives, positions it as a key player in the rapidly evolving IoT in utilities market.
China’s IoT in utilities market is anticipated to register a CAGR of 16.1% from 2025 to 2035. The country is expected to grow at a substantial pace and continue its dominance in East Asia through 2035.
China's significant presence in the Internet of Things (IoT) within the utilities industry is driven by a combination of the country's booming economy that provides abundant opportunities for investment in infrastructure development, with a particular focus on smart grid systems and IoT solutions for utilities. This widespread investment sets the groundwork for advanced technologies to be cohesive into utility networks, foremost to improved efficiency, reduced waste, and heightened service delivery.
Furthermore, China's continuous technological advancements and innovations and the focus on leveraging cutting-edge technologies, such as artificial intelligence (AI) and big data analytics, promote boosts the capabilities of IoT solutions in optimizing utility operations. Overall, China's economic growth, government support for smart initiatives, and technological prowess position it as a key player driving the expansion of IoT in the utilities market.
The section contains information about the leading segments in the industry. By component, the solution segment is estimated to grow at a CAGR of 14.8% throughout 2035. Additionally, the electricity grid management application is projected to expand at 12.7% till 2035.
| Component | Solutions |
|---|---|
| Value Share (2035) | 45.8% |
Solutions likely has a higher share in the IoT utilities market due to their ground-breaking and vigorous IoT solutions may offer inclusive features that provide precisely to the utilities sector. This could include advanced analytics for enhancing energy consumption, real-time monitoring of substructure for preemptive maintenance, and integration capabilities with existing utility systems for continuous operation. Such features are highly valued by utility companies looking to boost efficiency and reduce operational costs.
Solutions may have recognized strong partnerships and collaborations within the utilities industry. These partnerships could involve working closely with utility providers to understand their unique challenges and develop tailored IoT solutions that address these pain points effectively. This cooperative approach not only builds trust but also ensures that Solutions' are well-suited to the industry's needs, further subsidizing to their dominance.
The reputation for reliability, security, and scalability could play a significant role in their leadership. In the utilities sector, where data accuracy and system reliability are dominant, companies are more likely to indicate a confidential provider like Solutions that has a proven track record of delivering high-quality IoT solutions. This trust factor, combined with their high-tech expertise and industry knowledge, positions Solutions as a top choice for utility companies seeking IoT solutions.
| Application | Electricity Grid Management |
|---|---|
| Value Share (2035) | 51.6% |
The electricity grid management segment holds a higher share of 51.6% in the IoT utilities market as the increasing adoption of smart grids and advanced metering infrastructure (AMI) has suggestively heightened the efficiency and consistency of electricity distribution networks.
IoT technologies play a vital role in this by permitting real-time monitoring, data analytics, and predictive maintenance of grid substructure. This level of automation and intelligence helps efficacy companies enhance energy distribution, reduce stoppage, and improve overall service excellence, driving the demand for IoT solutions in grid management.
The impulsion towards renewable energy combination and the rise of dispersed energy resources (DERs) have drove the need for IoT-enabled grid management. With a growing number of solar panels, wind turbines, and other renewable sources connected to the grid, utilities require refined monitoring and control systems to manage the inconsistent supply and demand dynamics efficiently. IoT solutions offer proficiencies such as demand response, energy storage optimization, and micro grid management, permitting utilities to balance renewable energy generation with grid stability and bounciness.
Additionally, supervisory directives and government initiatives marked at modernizing aging substructure and promoting energy efficiency have enhanced the embracing of IoT in electricity grid management. Utilities are under compression to meet severe routine standards, reduce radiations, and improve customer service.
IoT technologies deliver them with the tools to achieve these goals by empowering real-time prominence into grid operations, proactive maintenance, and rapid response to outages or interruptions. As a result, the electricity grid management segment continues to overlook the IoT utilities market, driven by the compelling benefits it offers in terms of cost savings, operational efficiency, and sustainability.
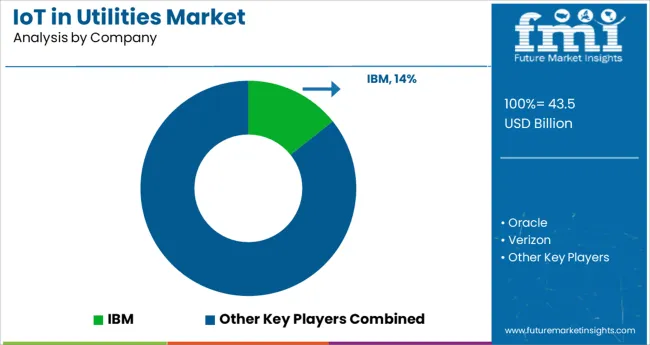
The IoT utilities industry is extremely competitive and driving invention through advanced IoT solutions, converging on smart grid technologies, predictive maintenance, and energy efficiency. Innovative entrants and focused firms are also gaining traction by offering niche solutions and leveraging emerging technologies like AI and machine learning. The viable scenery is characterized by strategic partnerships, mergers, and acquisitions aimed at expanding capabilities and reach.
Recent Industry Developments in IoT in Utilities Market
The industry is divided into solution, platform and services.
The segment is segregated into water and wastewater management, utility gas management and electricity grid management
The industry is classified into small and mid-sized enterprises, and large enterprises.
A regional analysis has been carried out in key countries of North America, Latin America, Asia Pacific, Middle East and Africa (MEA), and Europe.
The global iot in utilities market is estimated to be valued at USD 43.5 billion in 2025.
It is projected to reach USD 151.6 billion by 2035.
The market is expected to grow at a 13.3% CAGR between 2025 and 2035.
The key product types are platform, solutions and services.
asset monitoring and management segment is expected to dominate with a 32.4% industry share in 2025.


Full Research Suite comprises of:
Market outlook & trends analysis
Interviews & case studies
Strategic recommendations
Vendor profiles & capabilities analysis
5-year forecasts
8 regions and 60+ country-level data splits
Market segment data splits
12 months of continuous data updates
DELIVERED AS:
PDF EXCEL ONLINE
IoT Spend by Logistics Market Size and Share Forecast Outlook 2025 to 2035
IoT Chip Market Size and Share Forecast Outlook 2025 to 2035
IoT Device Management Market Size and Share Forecast Outlook 2025 to 2035
IoT Application Enablement Market Size and Share Forecast Outlook 2025 to 2035
IoT Processor Market Size and Share Forecast Outlook 2025 to 2035
IoT Application Development Services Market Size and Share Forecast Outlook 2025 to 2035
IoT Connectivity Management Platform Market Size and Share Forecast Outlook 2025 to 2035
IoT Device Management Platform Market Size and Share Forecast Outlook 2025 to 2035
IoT Development Kit Market Size and Share Forecast Outlook 2025 to 2035
IoT Communication Protocol Market - Insights & Industry Trends 2025 to 2035
IoT Network Management Market – Growth & Forecast through 2034
IoT for Public Safety Market
IoT Data Governance Market
IoT In Aviation Market Size and Share Forecast Outlook 2025 to 2035
IoT in Manufacturing Market Size and Share Forecast Outlook 2025 to 2035
IoT In Construction Market Size and Share Forecast Outlook 2025 to 2035
IoT in Product Development Market Analysis - Growth & Forecast 2025 to 2035
IoT in Healthcare Market Insights - Trends & Forecast 2025 to 2035
IoT Testing Equipment Market Size and Share Forecast Outlook 2025 to 2035
IoT For Cold Chain Monitoring Market Size and Share Forecast Outlook 2025 to 2035

Thank you!
You will receive an email from our Business Development Manager. Please be sure to check your SPAM/JUNK folder too.
Chat With
MaRIA