Biotic-Enhanced Flavors Size and Share Forecast Outlook 2025 to 2035

The global Biotic-Enhanced Flavors Market has been projected to be valued at USD 335.6 million in 2025 and is anticipated to reach approximately USD 600.5 million by 2035. A cumulative gain of USD 264.9 million is expected over the forecast decade, signaling a 6.0% CAGR, and marking an ~80% increase in market size.
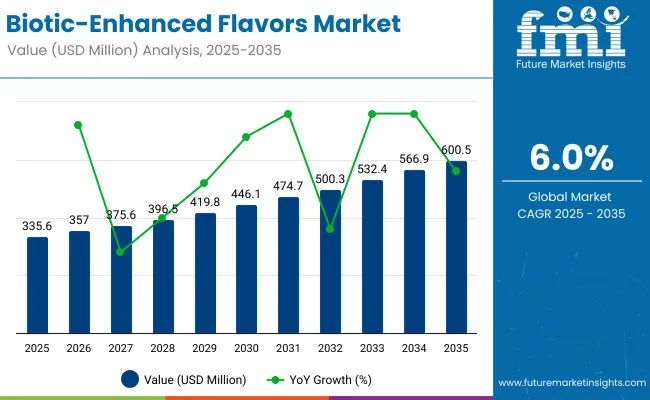
Quick Stats for Biotic-Enhanced Flavors

  • Biotic-Enhanced Flavors Value (2025): USD 335.6 million
  • Biotic-Enhanced Flavors Forecast Value (2035): USD 600.5 million
  • Biotic-Enhanced Flavors Forecast CAGR: 6.0%
  • Leading Segment in Biotic-Enhanced Flavors in 2025, by Biotic Type: Fermentation‑Derived Flavors (30%)
  • Key Growth Regions in the Biotic-Enhanced Flavors: North America, Asia-Pacific, Europe
  • Top Key Players in Biotic-Enhanced Flavors: Givaudan, Firmenich, Symrise AG, International Flavors & Fragrances (IFF), Takasago, Sensient Technologies, Döhler, Kerry Group, Mane SA, The Coco-Cola Company, andKaneka Probiotics

Biotic Enhanced Flavors Market

Biotic-Enhanced Flavors Key Takeaways

Metric Value
Estimated Value in (2025E) USD 335.6 million
Forecast Value in (2035F) USD 600.5 million
Forecast CAGR (2025 to 2035) 6.0%

This outlook underscores a steady expansion trajectory fueled by growing demand for functional and health-boosting ingredients in flavor systems. From 2025 to 2030, an incremental addition of USD 119.2 million is forecasted, accounting for roughly 45% of total decade growth. During this early phase, demand is likely to be driven by heightened innovation in gut-health-promoting formulations, particularly across dairy and plant-based food categories. Application-specific enhancements in taste modulation are expected to be prioritized by manufacturers as consumer sensitivity to synthetic additives intensifies.

The second half of the forecast period (2030-2035) is expected to deliver more robust momentum, adding USD 145.7 million, equivalent to 55% of total growth. This phase is likely to be characterized by deeper penetration across beverages, snacks, and dietary supplements, supported by advanced encapsulation technologies and AI-optimized flavor personalization.

Regional growth will likely be led by North America and Europe initially, while Asia Pacific is projected to emerge as a high-opportunity frontier due to increased probiotic awareness and functional ingredient adoption. By 2035, strategic partnerships between biotechnology firms and flavor houses are expected to drive recurring revenue streams through digital-enabled flavor solutions.

From 2020 to 2024, the Biotic-Enhanced Flavors Market expanded from an estimated ~USD 310.4 million to USD 335.6 million, supported by growing demand for gut-health-forward and clean-label products. During this period, global flavor houses with integrated fermentation and probiotic capabilities dominated, collectively accounting for nearly 70% of functional flavor innovations. Competitive strategies prioritized microbiome modulation, flavor masking technologies, and regulatory-backed health claims.

By 2025, demand is projected to reach USD 335.6 million, with increasing revenue share expected from hybrid flavor systems that blend biotics with botanicals, adaptogens, and nootropics. The value mix is forecasted to shift, as digital formulation platforms, encapsulation services, and AI-assisted taste personalization contribute to over 25% of market value by 2030.

Traditional flavor leaders are anticipated to evolve toward solution-based ecosystems, integrating R&D-as-a-service, microbiome data partnerships, and D2C flavor innovation. Competitive advantage is expected to pivot from legacy extraction methods to platforms that offer personalization scalability, scientific substantiation, and recurring revenue across digital and physical formats.

Why the Biotic-Enhanced Flavors is growing?

Growth in the Biotic-Enhanced Flavors Market is being propelled by evolving consumer preferences toward health-forward and functional ingredients. Greater attention has been placed on digestive health, immunity, and microbiome balance factors that are increasingly influencing flavor formulation strategies.

Regulatory support for clean label and natural claims has been reinforced, enabling rapid innovation across probiotic- and prebiotic-enhanced flavor systems. Adoption is being accelerated by food and beverage manufacturers seeking to differentiate portfolios in saturated product categories.

Scientific validation of gut-brain axis benefits and bioactive functionality has strengthened the credibility of biotic-based ingredients in flavor delivery formats. Moreover, encapsulation and controlled-release technologies have been integrated to preserve microbial viability without compromising flavor intensity.

Rising R&D investments from major players particularly in fermentation-derived and enzyme-enhanced flavor solutions have expanded application scopes into nutraceuticals and dietary supplements. Strong penetration in B2B segments and a maturing D2C ecosystem are expected to sustain this momentum throughout the forecast period.

Segmental Analysis

The Biotic-Enhanced Flavors Market has been segmented comprehensively based on biotic type, flavor type, product form, end user, sales channel and application, offering a detailed view of growth dynamics across functional flavor innovation. Biotic types include probiotic-enhanced, prebiotic-enhanced, fermentation-derived, enzyme-enhanced, and microbial culture-based formats, each engineered to serve specific functional or health-related outcomes.

In terms of flavor type, distinctions have been drawn between natural, organic, artificial, and botanical variants, underlining regulatory, sensory, and origin-specific trends. The application spectrum spans food & beverages, nutraceuticals, dietary supplements, pharmaceuticals, and functional foods—indicating how these enhanced flavors are being absorbed into health-forward value chains. This multifaceted segmentation ensures that market players can fine-tune product strategies and anticipate shifts in consumer functionality demand across diverse industries.
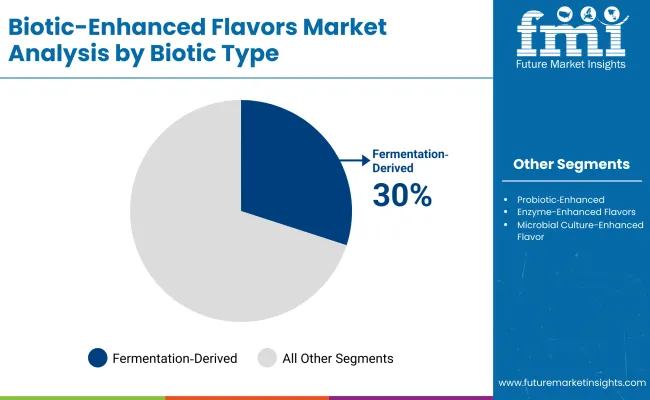
Insights into the Biotic Type Segment with Fermentation Derived Flavors Leading in Market Share

Biotic Enhanced Flavors Market By Biotic

Biotic Type Segment Market Value Share, 2025
Fermentation Derived Flavors 30.0%
Probiotic Enhanced Flavors 25.0%

Fermentation-derived flavors have been projected to dominate the biotic type segment, capturing 30.0% of the market in 2025 and growing at a CAGR of 9.50% through 2035. This leadership has been driven by robust demand for natural, bioactive taste modulators that align with clean-label positioning.

Ongoing fermentation technology advancements have enabled precision development of flavor profiles with added functional value, while ensuring scalability for large-volume food applications. Additionally, their compatibility with plant-based and vegan formulations has expanded their usage across alternative protein and dairy-free segments. The segment’s growth is expected to be reinforced by biotechnology-driven cost efficiencies and improved stability profiles, placing fermentation-derived solutions at the forefront of next-generation flavor innovation.
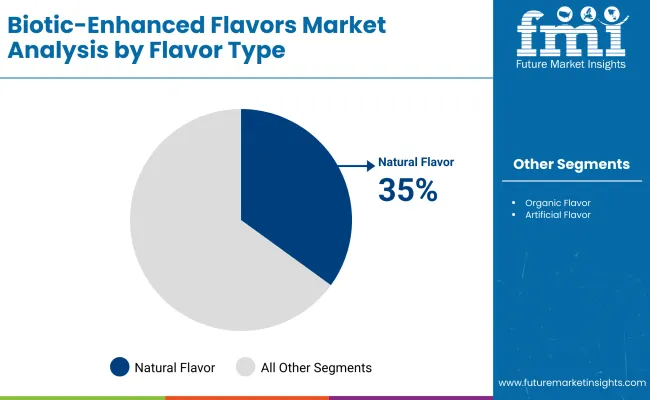
Insights into the FlavorType Segment with Animal Based Protein Dominating the Demand

Biotic Enhanced Flavors Market By Flavor

Flavor Type 2025 Share%
Natural Flavors 35.0%
Organic Flavors 15.0%
Artificial Flavors 10.0%

Natural flavors are expected to lead the flavor type segment with a 35.0% market share in 2025, underpinned by rising consumer resistance to artificial additives and demand for recognizable ingredients. Enhanced traceability and sustainability credentials have made natural biotic-enhanced flavors a preferred choice across functional foods and clean-label beverages.

Regulatory shifts encouraging the use of natural and organic claims in North America and Europe have further amplified this trend. Advances in natural extraction methods and encapsulation have improved shelf stability, making these flavors suitable for wider applications. With consumers increasingly associating naturalness with health and efficacy, the segment is poised to experience sustained momentum through the forecast period.

Insights into the Application Segment with Focus on Food & Beverages

Application 2025 Share%
Food & Beverages 40.0%
Nutraceuticals 20.0%
Functional Foods 15.0%

Food and beverage applications are anticipated to retain their leading position, capturing 40.0% of the market in 2025. Their dominance is attributed to widespread integration of biotic-enhanced flavors in yogurts, beverages, snacks, and ready-to-eat meals. Brand strategies increasingly revolve around health-positioned flavors, enabling cleaner labels without sacrificing taste.

Major manufacturers have accelerated reformulation pipelines to include gut-health claims, immunity boosters, and functional botanicals many of which depend on biotic flavor technologies. The segment’s expansion is further supported by growing urban demand for fortified convenience foods. As innovation deepens and consumer literacy around digestive health increases, food and beverages are expected to remain the anchor category for biotic flavor adoption.

What are the Drivers, Restraints, and Key Trends of the Biotic-Enhanced Flavors?

Growing regulatory focus on health claims and consumer demand for functional ingredients have propelled innovation in the Biotic-Enhanced Flavors Market. Yet challenges remain in formulation consistency and sensory masking, even as adoption accelerates across food, beverage, and nutraceutical channels.

Policy-Regulatory Push for Functional Labeling and Clean Claims

Global regulatory frameworks have been increasingly aligned toward enabling functional claims, especially those pertaining to digestive health, immunity, and natural origin. This shift has been leveraged by manufacturers to position biotic-enhanced flavors as dual-purpose ingredients offering both sensory and health benefits. In markets such as the EU and USA, front-of-pack labeling schemes and dietary guidelines have created favorable conditions for brands to integrate biotic formulations without facing aggressive regulatory hurdles.

The ability to include terms like "probiotic-enhanced," "fermented-based," or "microbiome-supportive" has been instrumental in consumer acceptance. As transparency becomes a commercial differentiator, formulation pipelines are expected to be aligned more tightly with clean label standards, driving further uptake.

Expansion of Hybrid Flavor Platforms in Functional Foods

A notable trend has emerged through the integration of hybrid flavor platforms wherein biotic-enhanced ingredients are combined with plant-based, botanical, or nootropic components. This evolution has been supported by R&D teams seeking to optimize flavor, mouthfeel, and functionality simultaneously. Hybridization not only improves taste but also enables multi-benefit positioning.

Particularly in protein-fortified snacks, immunity beverages, and cognitive-support gummies, this trend has been gaining traction. As consumer expectations evolve beyond single-function products, hybrid flavors featuring biotic enhancement are expected to lead the next wave of value-added innovation across both mass-market and premium categories.
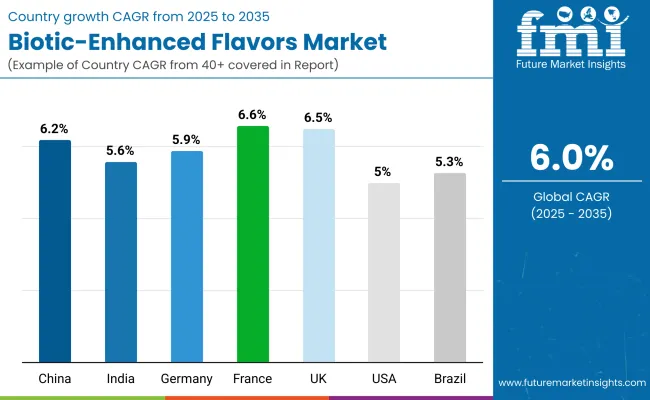
Analysis of Biotic-Enhanced Flavorsby Key Countries

Biotic Enhanced Flavors Market By Country

Countries CAGR (2025 to 2035)
China 6.2%
India 5.6%
Germany 5.9%
France 6.6%
UK 6.5%
USA 5.0%
Brazil 5.3%

The global Biotic-Enhanced Flavors Market has been characterized by differentiated adoption patterns across major economies, influenced by regulatory support, consumer health literacy, and functional food infrastructure maturity.

Europe is expected to lead in adoption velocity, with France (6.6%) and the UK (6.5%) projected to outpace regional peers due to proactive regulatory stances on clean-label nutrition and high uptake of functional foods. Germany, registering a 5.9% CAGR, has been supported by sustained innovation in fermented and botanical flavor systems tailored for the nutraceutical sector.

China is forecasted to expand at 6.2% CAGR, backed by a booming demand for digestive health solutions and local innovation in prebiotic-rich formulations. In India (5.6% CAGR), growth is being fostered by increased investments from global flavor houses and rising consumer awareness around gut health and immunity especially within the fortified beverage segment.

The U.S. market, with a 5.0% CAGR, is anticipated to see stable yet moderate gains, constrained by regulatory fragmentation and competitive saturation in the dietary supplement segment. Meanwhile, Brazil (5.3%) is emerging as a fast-rising Latin American player, driven by domestic nutraceutical innovation and bioactive ingredient integration in fruit-flavored applications. As the demand for health-aligned flavor systems strengthens, strategic investments are expected to be increasingly channeled into region-specific product development.

Sales Outlook for Biotic-Enhanced Flavors in the United States

Year USA Biotic-Enhanced Flavors Market (USD Million)
2025 80.5
2026 85.0
2027 90.2
2028 94.8
2029 99.7
2030 104.9
2031 111.3
2032 118.5
2033 126.2
2034 133.2
2035 140.6

The USA Biotic-Enhanced Flavors Market is projected to expand from USD 80.5 million in 2025 to USD 140.6 million by 2035, registering a CAGR of approximately 5.6% over the forecast period. Growth is expected to be fueled by an uptick in functional product launches targeting digestive health, mental wellness, and immunity. Increasing adoption of biotic flavors by mainstream F&B brands has been encouraged by regulatory clarity and consumer acceptance of natural and prebiotic claims.

Food processors and supplement formulators have increasingly integrated biotic flavor systems into beverages, gummies, and snack bars, capitalizing on their dual functionality. Demand from the sports nutrition and women’s health segments has further supported category diversification.

  • Functional snacking and clean-label beverages are emerging as key growth areas.
  • Supplement manufacturers are bundling biotic flavors with cognitive and gut-health actives.

As sensory innovation becomes more tightly coupled with wellness delivery, the USA market is expected to maintain consistent mid-single-digit growth, driven by application diversification and cross-category flavor personalization.

Growth and Expansion Outlook for Biotic-Enhanced Flavors in the United Kingdom

The UK market is projected to grow steadily through 2035, supported by heightened consumer prioritization of gut health, immunity, and cognitive wellness. A CAGR of 6.5% is expected, reflecting increased functional ingredient inclusion across plant-based dairy, meal replacements, and snack formats. Local innovation has been encouraged by the UK’s proactive stance on food labeling, allowing biotic-enhanced flavors to gain traction in clean-label product formulations.

  • Functional drinks and on-the-go health snacks have integrated prebiotic flavor systems.
  • Biotic-enhanced botanicals are being explored in adaptogenic tea and beverage ranges.
  • Reformulation in post-Brexit UK F&B portfolios has favored domestic flavor technologies.
  • Consumer literacy on the microbiome has enhanced the credibility of biotic claims.

Regulatory flexibility and a strong retail health & wellness culture are expected to drive flavor innovation across mid-premium and mass-market segments.

Growth and Expansion Outlook for Biotic-Enhanced Flavors in India

India’s food-waste derived protein market is forecasted to register strong growth through 2035, supported by government initiatives under the Food Processing and Swachh Bharat missions. Decentralized bioprocessing units have been promoted to convert agri-waste, pulse husks, and fruit pulp into protein-rich inputs for domestic food, feed, and supplement sectors. The market has been shaped by demand for affordable, high-volume functional ingredients aligned with nutrition security goals.

  • Policy incentives have been provided for waste valorization in food parks.
  • Startups have scaled enzymatic and fermentation-based extraction for regional agri-waste.
  • Plant-based wellness brands are integrating upcycled protein into Ayurveda-inspired formulations.
  • Municipalities have piloted wet waste protein recovery under smart city programs.

Sales Outlook for Biotic-Enhanced Flavorsin China

China is projected to grow at a 6.2% CAGR between 2025 and 2035, led by robust demand for gut health supplements, functional beverages, and smart nutrition. Innovation in fermentation-based flavor systems has been accelerated by deep integration of traditional Chinese medicine (TCM) with modern flavor science. Regulatory modernization has supported expanded probiotic labeling, encouraging both domestic and international players.

  • Fermentation-derived flavoring agents are widely used in digestive tonics and health teas.
  • Urban consumers are demanding biotic-enriched snacks and immunity-boosting beverages.
  • Leading beverage brands are launching SKUs with dual claims: flavor + function.
  • Strategic alliances with biotech firms have boosted R&D in functional taste profiles.

China’s dual emphasis on food safety and health positioning is expected to support widespread biotic flavor adoption across F&B, pharma, and nutraceutical sectors.

In-depth Analysis of Biotic-Enhanced Flavorsin Germany

Countries 2025
UK 19.7%
Germany 21.8%
Italy 9.1%
France 13.7%
Spain 9.9%
BENELUX 6.8%
Nordic 5.7%
Rest of Europe 13.3%
Countries 2035
UK 18.6%
Germany 20.1%
Italy 11.9%
France 14.8%
Spain 11.9%
BENELUX 5.4%
Nordic 5.2%
Rest of Europe 12.2%

Germany’s market is expected to expand at a 5.9% CAGR, anchored by strong institutional research, clean-label compliance, and high demand for natural health-enhancing ingredients. Biotic-enhanced flavors are being rapidly adopted in protein-enriched foods, dairy alternatives, and specialized medical nutrition.

Innovation is being reinforced by collaborations between ingredient suppliers and pharmaceutical flavor houses. Germany is expected to continue leading Europe's biotic flavor innovation, driven by strong R&D capacity, B2B demand maturity, and health-aware consumer preferences.

  • Clean-label yogurt and protein snacks are being reformulated with prebiotic taste enhancers.
  • Regulatory alignment with EU probiotic policies supports front-of-pack functional claims.
  • Functional confectionery and soft chews are introducing biotic-enriched flavors.
  • Institutional hospitals and elderly care centers are adopting biotic formulations for wellness diets.

Growth Outlook for Biotic-Enhanced Flavors in Japan

Biotic Type Market Value Share, 2025
Probiotic Enhanced Flavors 26.0%
Prebiotic Enhanced Flavors 21.0%
Fermentation Derived Flavors 29.0%
Enzyme Enhanced Flavors 14.0%
Microbial Culture Enhanced Flavors 10.0%

The Biotic-Enhanced Flavors Market in Japan is projected to reach USD 14.1 million by 2025. Fermentation-derived flavors are anticipated to lead with a 29.0% share, closely followed by probiotic-enhanced variants at 26.0%, reflecting Japan’s longstanding cultural alignment with fermented and gut-friendly foods. This consumer familiarity has been leveraged by manufacturers to enhance sensory depth while offering scientifically-backed health benefits.

The segmental tilt toward fermentation-based and microbial culture-driven systems has been reinforced by R&D investment in umami modulation and flavor stabilization for functional foods. Furthermore, traditional Japanese dietary preferences centered on soy, rice, and miso-based formats have provided a natural base for biotic flavor innovation.

As Japan’s aging population prioritizes digestive and cognitive wellness, flavor systems designed to support microbiome health are expected to gain deeper market penetration. AI-assisted flavor profiling and microbiome-personalized formulations are likely to redefine premium offerings in coming years.

  • Fermentation-derived flavors lead at 29.0%, followed by probiotics at 26.0%
  • Growth driven by aging demographics and cultural familiarity with fermented foods
  • Advanced R&D in umami enhancement and AI-based personalization fuels innovation

Opportunity Analysis of South Korea Biotic-Enhanced Flavors

Application Market Value Share, 2025
Food & Beverages 42.0%
Nutraceuticals 19.0%
Functional Foods 16.0%
Dietary Supplements 14.0%
Pharmaceuticals 9.0%

The Biotic-Enhanced Flavors Market in South Korea is projected to expand steadily, with Food & Beverages expected to dominate at 42.0% share in 2025. This leadership is attributed to the nation’s deeply ingrained fermented food culture, which has provided an optimal launchpad for biotic flavor innovation. Rising consumer preference for probiotic-enriched beverages and traditional foods like kimchi and yakult has enhanced mainstream acceptance.

Functional foods and dietary supplements are also gaining traction, supported by South Korea’s tech-forward healthcare system and digitally connected wellness ecosystem. Biotic-enhanced flavor systems have been integrated into convenience foods, healthy snacks, and immunity-supporting drinkable yogurts. As consumer education rises and medical-nutrition overlaps deepen, South Korea is expected to become a regional benchmark for innovation in flavor-based functional delivery systems.
  • Functional beverages and ready-to-drink formats lead flavor-system adoption.
  • Government-certified health functional food (HFF) programs support label credibility.
  • AI-driven personalization in health apps is pushing biotic demand in D2C formats.
  • Clinical research and hospital nutrition departments are exploring pharma-grade applications.

Competitive Landscape of Biotic-Enhanced Flavors

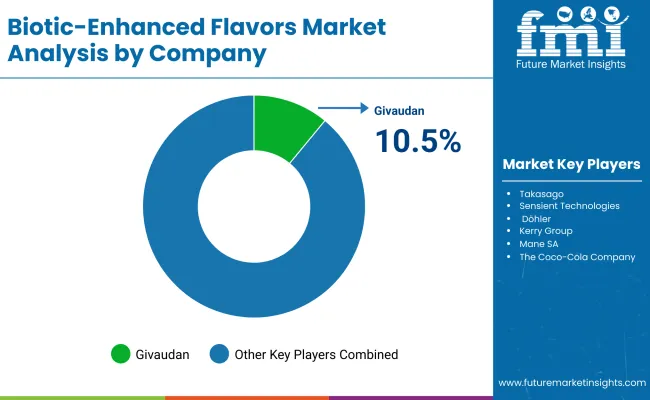
Biotic Enhanced Flavors Market By Company

The Biotic-Enhanced Flavors Market is moderately fragmented, with a competitive mix of multinational giants, agile mid-sized innovators, and regional flavor specialists addressing evolving demand across food, beverage, nutraceutical, and pharmaceutical segments.

Global flavor leaders such as Givaudan, Firmenich, and Kaneka Probiotics have been positioned at the forefront, driven by diversified portfolios in fermentation-based and probiotic flavor systems. Their strategies have increasingly emphasized microbiome-focused R&D, AI-assisted flavor design, and vertically integrated fermentation capabilities to meet demand for clean-label and functional formulations.

Mid-sized companies such as Symrise AG, Sensient Technologies, and Takasago have focused on fast prototyping, botanical-biotic hybrid development, and region-specific sensory tailoring. These firms have accelerated product innovation by coupling traditional flavor science with encapsulation technologies and clinical substantiation—making them well-positioned in performance nutrition and functional snacks.

Companies like Kerry Group, Döhler, and Mane SA have leveraged fermentation and enzymatic platforms to serve dairy alternatives, RTD beverages, and nutraceutical applications. Their strength has been observed in localized application labs and co-creation with D2C and private-label brands.

Differentiation is shifting from conventional flavor attributes to integrated health benefits, regulatory validation, and multifunctional delivery systems. Subscription-based digital R&D partnerships and sensory-personalized solutions are expected to define the next wave of competition.

Key Developments in Biotic-Enhanced Flavors

  • In February 2025, Coca‑Cola unveiled Simply Pop, its first-ever prebiotic soda, marketed under the Simply Beverages brand. The drink features 6 grams of prebiotic fiber, Vitamin C, Zinc, 25–30% real fruit juice, and absolutely no added sugar, aimed squarely at wellness-focused Millennials and Gen Z consumers. This launch represents a strategic shift toward flavor systems that marry gut-health functionality with clean-label sensory experiences.
  • In February 26, 2025, Kaneka Probiotics released an industry-focused report spotlighting microbiome modulation and personalized nutrition as key innovation drivers in the biotics sector. The report asserted that AI‑driven strain selection and targeted probiotic flavor blends are accelerating toward commercialization. This development underscores a broader trend of precision biotic flavor delivery, where health efficacy, personalization, and formulation science converge.

Scope of the Report

Item Value
Quantitative Units USD 335.6 million
Biotic Type Probiotic-Enhanced Flavors, Prebiotic-Enhanced Flavors, Fermentation-Derived Flavors, Enzyme-Enhanced Flavors, Microbial Culture-Enhanced Flavors
Flavor Type Natural Flavors, Organic Flavors, Botanical & Herbal Flavors, Fruit & Vegetable Flavors, Artificial Flavors, Dairy-Derived Flavors
Application Food & Beverages, Nutraceuticals, Functional Foods, Dietary Supplements, Pharmaceuticals
Product Form Liquid Flavors, Powder Flavors, Encapsulated Flavors, Concentrates & Extracts
End User Food & Beverage Industry, Nutraceutical Industry, Pharmaceutical Industry
Sales Channel Food & Beverage Manufacturers (B2B), Nutraceutical & Supplement Companies, Direct-to-Consumer (D2C), Online Retail
Regions Covered North America, Europe, Asia-Pacific, Latin America, Middle East & Africa
Country Covered United States, Canada, Germany, France, United Kingdom, China, Japan, India, Brazil, South Africa
Key Companies Profiled Givaudan, Firmenich, Symrise AG, International Flavors & Fragrances (IFF), Takasago, Sensient Technologies, Döhler, Kerry Group, Mane SA, The Coco-Cola Company, and Kaneka Probiotics
Additional Attributes Flavor system integration with microbiome health trends; probiotic-prebiotic blends; personalized nutrition applications; clean-label demand acceleration; region-specific regulatory insights; co-creation with functional food & supplement startups; innovation in taste masking and delivery systems; encapsulation an d fermentation process advances

Key Segments

By Biotic Type:

  • Probiotic-Enhanced Flavors
  • Prebiotic-Enhanced Flavors
  • Fermentation-Derived Flavors
  • Enzyme-Enhanced Flavors
  • Microbial Culture-Enhanced Flavors

By Flavor Type:

  • Natural Flavors
  • Artificial Flavors
  • Organic Flavors
  • Botanical & Herbal Flavors
  • Dairy-Derived Flavors
  • Fruit & Vegetable Flavors

By Application:

  • Food & Beverages
  • Nutraceuticals
  • Functional Foods
  • Dietary Supplements
  • Pharmaceuticals

By Product Form:

  • Liquid Flavors
  • Powder Flavors
  • Encapsulated Flavors
  • Concentrates & Extracts

By Sales Channel:

  • Food & Beverage Manufacturers (B2B)
  • Nutraceutical & Supplement Companies
  • Direct-to-Consumer (D2C)
  • Online Retail

By End User:

  • Food & Beverage Industry
  • Nutraceutical Industry
  • Pharmaceutical Industry

By Region:

  • North America
  • Latin America
  • Europe
  • East Asia
  • South Asia & Pacific
  • Middle East and Africa

Table of Content

  1. Executive Summary
    • Global Market Outlook
    • Demand-side Trends
    • Supply-side Trends
    • Technology Roadmap Analysis
    • Analysis and Recommendations
  2. Market Overview
    • Market Coverage / Taxonomy
    • Market Definition / Scope / Limitations
  3. Market Background
    • Market Dynamics
      • Drivers
      • Restraints
      • Opportunity
      • Trends
    • Scenario Forecast
      • Demand in Optimistic Scenario
      • Demand in Likely Scenario
      • Demand in Conservative Scenario
    • Opportunity Map Analysis
    • Product Life Cycle Analysis
    • Supply Chain Analysis
    • Investment Feasibility Matrix
    • Value Chain Analysis
    • PESTLE and Porter’s Analysis
    • Regulatory Landscape
    • Regional Parent Market Outlook
    • Production and Consumption Statistics
    • Import and Export Statistics
  4. Global Market Analysis 2020 to 2024 and Forecast, 2025 to 2035
    • Historical Market Size Value (USD Million) & Volume (MT) Analysis, 2020 to 2024
    • Current and Future Market Size Value (USD Million) & Volume (MT) Projections, 2025 to 2035
      • Y-o-Y Growth Trend Analysis
      • Absolute $ Opportunity Analysis
  5. Global Market Pricing Analysis 2020 to 2024 and Forecast 2025 to 2035
  6. Global Market Analysis 2020 to 2024 and Forecast 2025 to 2035, By Biotic Type
    • Introduction / Key Findings
    • Historical Market Size Value (USD Million) & Volume (MT) Analysis By Biotic Type, 2020 to 2024
    • Current and Future Market Size Value (USD Million) & Volume (MT) Analysis and Forecast By Biotic Type, 2025 to 2035
      • Probiotic-Enhanced Flavors
      • Prebiotic-Enhanced Flavors
      • Fermentation-Derived Flavors
      • Enzyme-Enhanced Flavors
      • Microbial Culture-Enhanced Flavors
    • Y-o-Y Growth Trend Analysis By Biotic Type, 2020 to 2024
    • Absolute $ Opportunity Analysis By Biotic Type, 2025 to 2035
  7. Global Market Analysis 2020 to 2024 and Forecast 2025 to 2035, By Flavor Type
    • Introduction / Key Findings
    • Historical Market Size Value (USD Million) & Volume (MT) Analysis By Flavor Type, 2020 to 2024
    • Current and Future Market Size Value (USD Million) & Volume (MT) Analysis and Forecast By Flavor Type, 2025 to 2035
      • Natural Flavors
      • Artificial Flavors
      • Organic Flavors
      • Botanical & Herbal Flavors
      • Dairy-Derived Flavors
      • Fruit & Vegetable Flavors
    • Y-o-Y Growth Trend Analysis By Flavor Type, 2020 to 2024
    • Absolute $ Opportunity Analysis By Flavor Type, 2025 to 2035
  8. Global Market Analysis 2020 to 2024 and Forecast 2025 to 2035, By Application
    • Introduction / Key Findings
    • Historical Market Size Value (USD Million) & Volume (MT) Analysis By Application, 2020 to 2024
    • Current and Future Market Size Value (USD Million) & Volume (MT) Analysis and Forecast By Application, 2025 to 2035
      • Food & Beverages
      • Nutraceuticals
      • Functional Foods
      • Dietary Supplements
      • Pharmaceuticals
    • Y-o-Y Growth Trend Analysis By Application, 2020 to 2024
    • Absolute $ Opportunity Analysis By Application, 2025 to 2035
  9. Global Market Analysis 2020 to 2024 and Forecast 2025 to 2035, By Product Form
    • Introduction / Key Findings
    • Historical Market Size Value (USD Million) & Volume (MT) Analysis By Product Form, 2020 to 2024
    • Current and Future Market Size Value (USD Million) & Volume (MT) Analysis and Forecast By Product Form, 2025 to 2035
      • Liquid Flavors
      • Powder Flavors
      • Encapsulated Flavors
      • Concentrates & Extracts
    • Y-o-Y Growth Trend Analysis By Product Form, 2020 to 2024
    • Absolute $ Opportunity Analysis By Product Form, 2025 to 2035
  10. Global Market Analysis 2020 to 2024 and Forecast 2025 to 2035, By Sales Channel
    • Introduction / Key Findings
    • Historical Market Size Value (USD Million) & Volume (MT) Analysis By Sales Channel, 2020 to 2024
    • Current and Future Market Size Value (USD Million) & Volume (MT) Analysis and Forecast By Sales Channel, 2025 to 2035
      • Food & Beverage Manufacturers (B2B)
      • Nutraceutical & Supplement Companies
      • Direct-to-Consumer (D2C)
      • Online Retail
    • Y-o-Y Growth Trend Analysis By Sales Channel, 2020 to 2024
    • Absolute $ Opportunity Analysis By Sales Channel, 2025 to 2035
  11. Global Market Analysis 2020 to 2024 and Forecast 2025 to 2035, By End User
    • Introduction / Key Findings
    • Historical Market Size Value (USD Million) & Volume (MT) Analysis By End User, 2020 to 2024
    • Current and Future Market Size Value (USD Million) & Volume (MT) Analysis and Forecast By End User, 2025 to 2035
      • Food & Beverage Industry
      • Nutraceutical Industry
      • Pharmaceutical Industry
    • Y-o-Y Growth Trend Analysis By End User, 2020 to 2024
    • Absolute $ Opportunity Analysis By End User, 2025 to 2035
  12. Global Market Analysis 2020 to 2024 and Forecast 2025 to 2035, By Region
    • Introduction
    • Historical Market Size Value (USD Million) & Volume (MT) Analysis By Region, 2020 to 2024
    • Current Market Size Value (USD Million) & Volume (MT) Analysis and Forecast By Region, 2025 to 2035
      • North America
      • Latin America
      • Europe
      • East Asia
      • South Asia & Pacific
      • Middle East and Africa
    • Market Attractiveness Analysis By Region
  13. North America Market Analysis 2020 to 2024 and Forecast 2025 to 2035, By Country
    • Historical Market Size Value (USD Million) & Volume (MT) Trend Analysis By Market Taxonomy, 2020 to 2024
    • Market Size Value (USD Million) & Volume (MT) Forecast By Market Taxonomy, 2025 to 2035
      • By Country
        • USA
        • Canada
      • By Biotic Type
      • By Flavor Type
      • By Application
      • By Product Form
      • By Sales Channel
      • By End User
    • Market Attractiveness Analysis
      • By Country
      • By Biotic Type
      • By Flavor Type
      • By Application
      • By Product Form
      • By Sales Channel
      • By End User
    • Key Takeaways
  14. Latin America Market Analysis 2020 to 2024 and Forecast 2025 to 2035, By Country
    • Historical Market Size Value (USD Million) & Volume (MT) Trend Analysis By Market Taxonomy, 2020 to 2024
    • Market Size Value (USD Million) & Volume (MT) Forecast By Market Taxonomy, 2025 to 2035
      • By Country
        • Brazil
        • Mexico
        • Colombia
        • Rest of Latin America
      • By Biotic Type
      • By Flavor Type
      • By Application
      • By Product Form
      • By Sales Channel
      • By End User
    • Market Attractiveness Analysis
      • By Country
      • By Biotic Type
      • By Flavor Type
      • By Application
      • By Product Form
      • By Sales Channel
      • By End User
    • Key Takeaways
  15. Europe Market Analysis 2020 to 2024 and Forecast 2025 to 2035, By Country
    • Historical Market Size Value (USD Million) & Volume (MT) Trend Analysis By Market Taxonomy, 2020 to 2024
    • Market Size Value (USD Million) & Volume (MT) Forecast By Market Taxonomy, 2025 to 2035
      • By Country
        • Germany
        • UK
        • France
        • Italy
        • Spain
        • Belgium
        • Netherlands
        • Nordic
        • Switzerland
        • Russia
        • Poland
        • Rest of Europe
      • By Biotic Type
      • By Flavor Type
      • By Application
      • By Product Form
      • By Sales Channel
      • By End User
    • Market Attractiveness Analysis
      • By Country
      • By Biotic Type
      • By Flavor Type
      • By Application
      • By Product Form
      • By Sales Channel
      • By End User
    • Key Takeaways
  16. East Asia Market Analysis 2020 to 2024 and Forecast 2025 to 2035, By Country
    • Historical Market Size Value (USD Million) & Volume (MT) Trend Analysis By Market Taxonomy, 2020 to 2024
    • Market Size Value (USD Million) & Volume (MT) Forecast By Market Taxonomy, 2025 to 2035
      • By Country
        • China
        • Japan
        • South Korea
      • By Biotic Type
      • By Flavor Type
      • By Application
      • By Product Form
      • By Sales Channel
      • By End User
    • Market Attractiveness Analysis
      • By Country
      • By Biotic Type
      • By Flavor Type
      • By Application
      • By Product Form
      • By Sales Channel
      • By End User
    • Key Takeaways
  17. South Asia & Pacific Market Analysis 2020 to 2024 and Forecast 2025 to 2035, By Country
    • Historical Market Size Value (USD Million) & Volume (MT) Trend Analysis By Market Taxonomy, 2020 to 2024
    • Market Size Value (USD Million) & Volume (MT) Forecast By Market Taxonomy, 2025 to 2035
      • By Country
        • India
        • Thailand
        • Malaysia
        • Indonesia
        • Singapore
        • Vietnam
        • Australia
        • New Zealand
        • Rest of South Asia & Pacific
      • By Biotic Type
      • By Flavor Type
      • By Application
      • By Product Form
      • By Sales Channel
      • By End User
    • Market Attractiveness Analysis
      • By Country
      • By Biotic Type
      • By Flavor Type
      • By Application
      • By Product Form
      • By Sales Channel
      • By End User
    • Key Takeaways
  18. Middle East and Africa Market Analysis 2020 to 2024 and Forecast 2025 to 2035, By Country
    • Historical Market Size Value (USD Million) & Volume (MT) Trend Analysis By Market Taxonomy, 2020 to 2024
    • Market Size Value (USD Million) & Volume (MT) Forecast By Market Taxonomy, 2025 to 2035
      • By Country
        • Turkey
        • UAE
        • Saudi Arabia
        • Israel
        • Other GCC Countries
        • North Africa
        • South Africa
      • By Biotic Type
      • By Flavor Type
      • By Application
      • By Product Form
      • By Sales Channel
      • By End User
    • Market Attractiveness Analysis
      • By Country
      • By Biotic Type
      • By Flavor Type
      • By Application
      • By Product Form
      • By Sales Channel
      • By End User
    • Key Takeaways
  19. Key Countries Market Analysis
    • U.S
      • Pricing Analysis
      • Market Share Analysis, 2024
        • By Biotic Type
        • By Flavor Type
        • By Application
        • By Product Form
        • By Sales Channel
        • By End User
    • Canada
      • Pricing Analysis
      • Market Share Analysis, 2024
        • By Biotic Type
        • By Flavor Type
        • By Application
        • By Product Form
        • By Sales Channel
        • By End User
    • Brazil
      • Pricing Analysis
      • Market Share Analysis, 2024
        • By Biotic Type
        • By Flavor Type
        • By Application
        • By Product Form
        • By Sales Channel
        • By End User
    • Mexico
      • Pricing Analysis
      • Market Share Analysis, 2024
        • By Biotic Type
        • By Flavor Type
        • By Application
        • By Product Form
        • By Sales Channel
        • By End User
    • Germany
      • Pricing Analysis
      • Market Share Analysis, 2024
        • By Biotic Type
        • By Flavor Type
        • By Application
        • By Product Form
        • By Sales Channel
        • By End User
    • UK
      • Pricing Analysis
      • Market Share Analysis, 2024
        • By Biotic Type
        • By Flavor Type
        • By Application
        • By Product Form
        • By Sales Channel
        • By End User
    • France
      • Pricing Analysis
      • Market Share Analysis, 2024
        • By Biotic Type
        • By Flavor Type
        • By Application
        • By Product Form
        • By Sales Channel
        • By End User
    • Italy
      • Pricing Analysis
      • Market Share Analysis, 2024
        • By Biotic Type
        • By Flavor Type
        • By Application
        • By Product Form
        • By Sales Channel
        • By End User
    • Spain
      • Pricing Analysis
      • Market Share Analysis, 2024
        • By Biotic Type
        • By Flavor Type
        • By Application
        • By Product Form
        • By Sales Channel
        • By End User
    • Belgium
      • Pricing Analysis
      • Market Share Analysis, 2024
        • By Biotic Type
        • By Flavor Type
        • By Application
        • By Product Form
        • By Sales Channel
        • By End User
    • Netherlands
      • Pricing Analysis
      • Market Share Analysis, 2024
        • By Biotic Type
        • By Flavor Type
        • By Application
        • By Product Form
        • By Sales Channel
        • By End User
    • Nordic
      • Pricing Analysis
      • Market Share Analysis, 2024
        • By Biotic Type
        • By Flavor Type
        • By Application
        • By Product Form
        • By Sales Channel
        • By End User
    • Switzerland
      • Pricing Analysis
      • Market Share Analysis, 2024
        • By Biotic Type
        • By Flavor Type
        • By Application
        • By Product Form
        • By Sales Channel
        • By End User
    • Russia
      • Pricing Analysis
      • Market Share Analysis, 2024
        • By Biotic Type
        • By Flavor Type
        • By Application
        • By Product Form
        • By Sales Channel
        • By End User
    • Poland
      • Pricing Analysis
      • Market Share Analysis, 2024
        • By Biotic Type
        • By Flavor Type
        • By Application
        • By Product Form
        • By Sales Channel
        • By End User
    • China
      • Pricing Analysis
      • Market Share Analysis, 2024
        • By Biotic Type
        • By Flavor Type
        • By Application
        • By Product Form
        • By Sales Channel
        • By End User
    • Japan
      • Pricing Analysis
      • Market Share Analysis, 2024
        • By Biotic Type
        • By Flavor Type
        • By Application
        • By Product Form
        • By Sales Channel
        • By End User
    • South Korea
      • Pricing Analysis
      • Market Share Analysis, 2024
        • By Biotic Type
        • By Flavor Type
        • By Application
        • By Product Form
        • By Sales Channel
        • By End User
    • India
      • Pricing Analysis
      • Market Share Analysis, 2024
        • By Biotic Type
        • By Flavor Type
        • By Application
        • By Product Form
        • By Sales Channel
        • By End User
    • Thailand
      • Pricing Analysis
      • Market Share Analysis, 2024
        • By Biotic Type
        • By Flavor Type
        • By Application
        • By Product Form
        • By Sales Channel
        • By End User
    • Malaysia
      • Pricing Analysis
      • Market Share Analysis, 2024
        • By Biotic Type
        • By Flavor Type
        • By Application
        • By Product Form
        • By Sales Channel
        • By End User
    • Indonesia
      • Pricing Analysis
      • Market Share Analysis, 2024
        • By Biotic Type
        • By Flavor Type
        • By Application
        • By Product Form
        • By Sales Channel
        • By End User
    • Singapore
      • Pricing Analysis
      • Market Share Analysis, 2024
        • By Biotic Type
        • By Flavor Type
        • By Application
        • By Product Form
        • By Sales Channel
        • By End User
    • Vietnam
      • Pricing Analysis
      • Market Share Analysis, 2024
        • By Biotic Type
        • By Flavor Type
        • By Application
        • By Product Form
        • By Sales Channel
        • By End User
    • Australia
      • Pricing Analysis
      • Market Share Analysis, 2024
        • By Biotic Type
        • By Flavor Type
        • By Application
        • By Product Form
        • By Sales Channel
        • By End User
    • New Zealand
      • Pricing Analysis
      • Market Share Analysis, 2024
        • By Biotic Type
        • By Flavor Type
        • By Application
        • By Product Form
        • By Sales Channel
        • By End User
    • Turkey
      • Pricing Analysis
      • Market Share Analysis, 2024
        • By Biotic Type
        • By Flavor Type
        • By Application
        • By Product Form
        • By Sales Channel
        • By End User
    • UAE
      • Pricing Analysis
      • Market Share Analysis, 2024
        • By Biotic Type
        • By Flavor Type
        • By Application
        • By Product Form
        • By Sales Channel
        • By End User
    • Saudi Arabia
      • Pricing Analysis
      • Market Share Analysis, 2024
        • By Biotic Type
        • By Flavor Type
        • By Application
        • By Product Form
        • By Sales Channel
        • By End User
    • Israel
      • Pricing Analysis
      • Market Share Analysis, 2024
        • By Biotic Type
        • By Flavor Type
        • By Application
        • By Product Form
        • By Sales Channel
        • By End User
  20. Market Structure Analysis
    • Competition Dashboard
    • Competition Benchmarking
    • Market Share Analysis of Top Players
      • By Regional
      • By Biotic Type
      • By Flavor Type
      • By Application
      • By Product Form
      • By Sales Channel
      • By End User
  21. Competition Analysis
    • Competition Deep Dive
      • Givaudan
        • Overview
        • Product Portfolio
        • Profitability by Market Segments (Product/Age /Sales Channel/Region)
        • Sales Footprint
        • Strategy Overview
        • Firmenich
        • Symrise AG
        • International Flavors & Fragrances (IFF)
        • Takasago International Corporation
        • Sensient Technologies Corporation
        • Döhler Group
        • Kerry Group
        • Mane SA
        • Kaneka Probiotics
    • Assumptions & Acronyms Used
    • Research Methodology

List of Tables

  • Table 1: Global Market Value (USD Million) Forecast by Region, 2020-2035
  • Table 2: Global Market Volume (MT) Forecast by Region, 2020-2035
  • Table 3: Global Market Value (USD Million) Forecast by Biotic Type, 2020-2035
  • Table 4: Global Market Volume (MT) Forecast by Biotic Type, 2020-2035
  • Table 5: Global Market Value (USD Million) Forecast by Flavor Type, 2020-2035
  • Table 6: Global Market Volume (MT) Forecast by Flavor Type, 2020-2035
  • Table 7: Global Market Value (USD Million) Forecast by Application, 2020-2035
  • Table 8: Global Market Volume (MT) Forecast by Application, 2020-2035
  • Table 9: Global Market Value (USD Million) Forecast by Product Form, 2020-2035
  • Table 10: Global Market Volume (MT) Forecast by Product Form, 2020-2035
  • Table 11: Global Market Value (USD Million) Forecast by Sales Channel, 2020-2035
  • Table 12: Global Market Volume (MT) Forecast by Sales Channel, 2020-2035
  • Table 13: Global Market Value (USD Million) Forecast by End User, 2020-2035
  • Table 14: Global Market Volume (MT) Forecast by End User, 2020-2035
  • Table 15: North America Market Value (USD Million) Forecast by Country, 2020-2035
  • Table 16: North America Market Volume (MT) Forecast by Country, 2020-2035
  • Table 17: North America Market Value (USD Million) Forecast by Biotic Type, 2020-2035
  • Table 18: North America Market Volume (MT) Forecast by Biotic Type, 2020-2035
  • Table 19: North America Market Value (USD Million) Forecast by Flavor Type, 2020-2035
  • Table 20: North America Market Volume (MT) Forecast by Flavor Type, 2020-2035
  • Table 21: North America Market Value (USD Million) Forecast by Application, 2020-2035
  • Table 22: North America Market Volume (MT) Forecast by Application, 2020-2035
  • Table 23: North America Market Value (USD Million) Forecast by Product Form, 2020-2035
  • Table 24: North America Market Volume (MT) Forecast by Product Form, 2020-2035
  • Table 25: North America Market Value (USD Million) Forecast by Sales Channel, 2020-2035
  • Table 26: North America Market Volume (MT) Forecast by Sales Channel, 2020-2035
  • Table 27: North America Market Value (USD Million) Forecast by End User, 2020-2035
  • Table 28: North America Market Volume (MT) Forecast by End User, 2020-2035
  • Table 29: Latin America Market Value (USD Million) Forecast by Country, 2020-2035
  • Table 30: Latin America Market Volume (MT) Forecast by Country, 2020-2035
  • Table 31: Latin America Market Value (USD Million) Forecast by Biotic Type, 2020-2035
  • Table 32: Latin America Market Volume (MT) Forecast by Biotic Type, 2020-2035
  • Table 33: Latin America Market Value (USD Million) Forecast by Flavor Type, 2020-2035
  • Table 34: Latin America Market Volume (MT) Forecast by Flavor Type, 2020-2035
  • Table 35: Latin America Market Value (USD Million) Forecast by Application, 2020-2035
  • Table 36: Latin America Market Volume (MT) Forecast by Application, 2020-2035
  • Table 37: Latin America Market Value (USD Million) Forecast by Product Form, 2020-2035
  • Table 38: Latin America Market Volume (MT) Forecast by Product Form, 2020-2035
  • Table 39: Latin America Market Value (USD Million) Forecast by Sales Channel, 2020-2035
  • Table 40: Latin America Market Volume (MT) Forecast by Sales Channel, 2020-2035
  • Table 41: Latin America Market Value (USD Million) Forecast by End User, 2020-2035
  • Table 42: Latin America Market Volume (MT) Forecast by End User, 2020-2035
  • Table 43: Europe Market Value (USD Million) Forecast by Country, 2020-2035
  • Table 44: Europe Market Volume (MT) Forecast by Country, 2020-2035
  • Table 45: Europe Market Value (USD Million) Forecast by Biotic Type, 2020-2035
  • Table 46: Europe Market Volume (MT) Forecast by Biotic Type, 2020-2035
  • Table 47: Europe Market Value (USD Million) Forecast by Flavor Type, 2020-2035
  • Table 48: Europe Market Volume (MT) Forecast by Flavor Type, 2020-2035
  • Table 49: Europe Market Value (USD Million) Forecast by Application, 2020-2035
  • Table 50: Europe Market Volume (MT) Forecast by Application, 2020-2035
  • Table 51: Europe Market Value (USD Million) Forecast by Product Form, 2020-2035
  • Table 52: Europe Market Volume (MT) Forecast by Product Form, 2020-2035
  • Table 53: Europe Market Value (USD Million) Forecast by Sales Channel, 2020-2035
  • Table 54: Europe Market Volume (MT) Forecast by Sales Channel, 2020-2035
  • Table 55: Europe Market Value (USD Million) Forecast by End User, 2020-2035
  • Table 56: Europe Market Volume (MT) Forecast by End User, 2020-2035
  • Table 57: East Asia Market Value (USD Million) Forecast by Country, 2020-2035
  • Table 58: East Asia Market Volume (MT) Forecast by Country, 2020-2035
  • Table 59: East Asia Market Value (USD Million) Forecast by Biotic Type, 2020-2035
  • Table 60: East Asia Market Volume (MT) Forecast by Biotic Type, 2020-2035
  • Table 61: East Asia Market Value (USD Million) Forecast by Flavor Type, 2020-2035
  • Table 62: East Asia Market Volume (MT) Forecast by Flavor Type, 2020-2035
  • Table 63: East Asia Market Value (USD Million) Forecast by Application, 2020-2035
  • Table 64: East Asia Market Volume (MT) Forecast by Application, 2020-2035
  • Table 65: East Asia Market Value (USD Million) Forecast by Product Form, 2020-2035
  • Table 66: East Asia Market Volume (MT) Forecast by Product Form, 2020-2035
  • Table 67: East Asia Market Value (USD Million) Forecast by Sales Channel, 2020-2035
  • Table 68: East Asia Market Volume (MT) Forecast by Sales Channel, 2020-2035
  • Table 69: East Asia Market Value (USD Million) Forecast by End User, 2020-2035
  • Table 70: East Asia Market Volume (MT) Forecast by End User, 2020-2035
  • Table 71: South Asia & Pacific Market Value (USD Million) Forecast by Country, 2020-2035
  • Table 72: South Asia & Pacific Market Volume (MT) Forecast by Country, 2020-2035
  • Table 73: South Asia & Pacific Market Value (USD Million) Forecast by Biotic Type, 2020-2035
  • Table 74: South Asia & Pacific Market Volume (MT) Forecast by Biotic Type, 2020-2035
  • Table 75: South Asia & Pacific Market Value (USD Million) Forecast by Flavor Type, 2020-2035
  • Table 76: South Asia & Pacific Market Volume (MT) Forecast by Flavor Type, 2020-2035
  • Table 77: South Asia & Pacific Market Value (USD Million) Forecast by Application, 2020-2035
  • Table 78: South Asia & Pacific Market Volume (MT) Forecast by Application, 2020-2035
  • Table 79: South Asia & Pacific Market Value (USD Million) Forecast by Product Form, 2020-2035
  • Table 80: South Asia & Pacific Market Volume (MT) Forecast by Product Form, 2020-2035
  • Table 81: South Asia & Pacific Market Value (USD Million) Forecast by Sales Channel, 2020-2035
  • Table 82: South Asia & Pacific Market Volume (MT) Forecast by Sales Channel, 2020-2035
  • Table 83: South Asia & Pacific Market Value (USD Million) Forecast by End User, 2020-2035
  • Table 84: South Asia & Pacific Market Volume (MT) Forecast by End User, 2020-2035
  • Table 85: Middle East and Africa Market Value (USD Million) Forecast by Country, 2020-2035
  • Table 86: Middle East and Africa Market Volume (MT) Forecast by Country, 2020-2035
  • Table 87: Middle East and Africa Market Value (USD Million) Forecast by Biotic Type, 2020-2035
  • Table 88: Middle East and Africa Market Volume (MT) Forecast by Biotic Type, 2020-2035
  • Table 89: Middle East and Africa Market Value (USD Million) Forecast by Flavor Type, 2020-2035
  • Table 90: Middle East and Africa Market Volume (MT) Forecast by Flavor Type, 2020-2035
  • Table 91: Middle East and Africa Market Value (USD Million) Forecast by Application, 2020-2035
  • Table 92: Middle East and Africa Market Volume (MT) Forecast by Application, 2020-2035
  • Table 93: Middle East and Africa Market Value (USD Million) Forecast by Product Form, 2020-2035
  • Table 94: Middle East and Africa Market Volume (MT) Forecast by Product Form, 2020-2035
  • Table 95: Middle East and Africa Market Value (USD Million) Forecast by Sales Channel, 2020-2035
  • Table 96: Middle East and Africa Market Volume (MT) Forecast by Sales Channel, 2020-2035
  • Table 97: Middle East and Africa Market Value (USD Million) Forecast by End User, 2020-2035
  • Table 98: Middle East and Africa Market Volume (MT) Forecast by End User, 2020-2035

List of Figures

  • Figure 1: Global Market Volume (MT) Forecast 2020-2035
  • Figure 2: Global Market Pricing Analysis
  • Figure 3: Global Market Value (USD Million) Forecast 2020-2035
  • Figure 4: Global Market Value Share and BPS Analysis by Biotic Type, 2025 and 2035
  • Figure 5: Global Market Y-o-Y Growth Comparison by Biotic Type, 2025-2035
  • Figure 6: Global Market Attractiveness Analysis by Biotic Type
  • Figure 7: Global Market Value Share and BPS Analysis by Flavor Type, 2025 and 2035
  • Figure 8: Global Market Y-o-Y Growth Comparison by Flavor Type, 2025-2035
  • Figure 9: Global Market Attractiveness Analysis by Flavor Type
  • Figure 10: Global Market Value Share and BPS Analysis by Application, 2025 and 2035
  • Figure 11: Global Market Y-o-Y Growth Comparison by Application, 2025-2035
  • Figure 12: Global Market Attractiveness Analysis by Application
  • Figure 13: Global Market Value Share and BPS Analysis by Product Form, 2025 and 2035
  • Figure 14: Global Market Y-o-Y Growth Comparison by Product Form, 2025-2035
  • Figure 15: Global Market Attractiveness Analysis by Product Form
  • Figure 16: Global Market Value Share and BPS Analysis by Sales Channel, 2025 and 2035
  • Figure 17: Global Market Y-o-Y Growth Comparison by Sales Channel, 2025-2035
  • Figure 18: Global Market Attractiveness Analysis by Sales Channel
  • Figure 19: Global Market Value Share and BPS Analysis by End User, 2025 and 2035
  • Figure 20: Global Market Y-o-Y Growth Comparison by End User, 2025-2035
  • Figure 21: Global Market Attractiveness Analysis by End User
  • Figure 22: Global Market Value (USD Million) Share and BPS Analysis by Region, 2025 and 2035
  • Figure 23: Global Market Y-o-Y Growth Comparison by Region, 2025-2035
  • Figure 24: Global Market Attractiveness Analysis by Region
  • Figure 25: North America Market Incremental $ Opportunity, 2025-2035
  • Figure 26: Latin America Market Incremental $ Opportunity, 2025-2035
  • Figure 27: Europe Market Incremental $ Opportunity, 2025-2035
  • Figure 28: East Asia Market Incremental $ Opportunity, 2025-2035
  • Figure 29: South Asia & Pacific Market Incremental $ Opportunity, 2025-2035
  • Figure 30: Middle East and Africa Market Incremental $ Opportunity, 2025-2035
  • Figure 31: North America Market Value Share and BPS Analysis by Country, 2025 and 2035
  • Figure 32: North America Market Value Share and BPS Analysis by Biotic Type, 2025 and 2035
  • Figure 33: North America Market Y-o-Y Growth Comparison by Biotic Type, 2025-2035
  • Figure 34: North America Market Attractiveness Analysis by Biotic Type
  • Figure 35: North America Market Value Share and BPS Analysis by Flavor Type, 2025 and 2035
  • Figure 36: North America Market Y-o-Y Growth Comparison by Flavor Type, 2025-2035
  • Figure 37: North America Market Attractiveness Analysis by Flavor Type
  • Figure 38: North America Market Value Share and BPS Analysis by Application, 2025 and 2035
  • Figure 39: North America Market Y-o-Y Growth Comparison by Application, 2025-2035
  • Figure 40: North America Market Attractiveness Analysis by Application
  • Figure 41: North America Market Value Share and BPS Analysis by Product Form, 2025 and 2035
  • Figure 42: North America Market Y-o-Y Growth Comparison by Product Form, 2025-2035
  • Figure 43: North America Market Attractiveness Analysis by Product Form
  • Figure 44: North America Market Value Share and BPS Analysis by Sales Channel, 2025 and 2035
  • Figure 45: North America Market Y-o-Y Growth Comparison by Sales Channel, 2025-2035
  • Figure 46: North America Market Attractiveness Analysis by Sales Channel
  • Figure 47: North America Market Value Share and BPS Analysis by End User, 2025 and 2035
  • Figure 48: North America Market Y-o-Y Growth Comparison by End User, 2025-2035
  • Figure 49: North America Market Attractiveness Analysis by End User
  • Figure 50: Latin America Market Value Share and BPS Analysis by Country, 2025 and 2035
  • Figure 51: Latin America Market Value Share and BPS Analysis by Biotic Type, 2025 and 2035
  • Figure 52: Latin America Market Y-o-Y Growth Comparison by Biotic Type, 2025-2035
  • Figure 53: Latin America Market Attractiveness Analysis by Biotic Type
  • Figure 54: Latin America Market Value Share and BPS Analysis by Flavor Type, 2025 and 2035
  • Figure 55: Latin America Market Y-o-Y Growth Comparison by Flavor Type, 2025-2035
  • Figure 56: Latin America Market Attractiveness Analysis by Flavor Type
  • Figure 57: Latin America Market Value Share and BPS Analysis by Application, 2025 and 2035
  • Figure 58: Latin America Market Y-o-Y Growth Comparison by Application, 2025-2035
  • Figure 59: Latin America Market Attractiveness Analysis by Application
  • Figure 60: Latin America Market Value Share and BPS Analysis by Product Form, 2025 and 2035
  • Figure 61: Latin America Market Y-o-Y Growth Comparison by Product Form, 2025-2035
  • Figure 62: Latin America Market Attractiveness Analysis by Product Form
  • Figure 63: Latin America Market Value Share and BPS Analysis by Sales Channel, 2025 and 2035
  • Figure 64: Latin America Market Y-o-Y Growth Comparison by Sales Channel, 2025-2035
  • Figure 65: Latin America Market Attractiveness Analysis by Sales Channel
  • Figure 66: Latin America Market Value Share and BPS Analysis by End User, 2025 and 2035
  • Figure 67: Latin America Market Y-o-Y Growth Comparison by End User, 2025-2035
  • Figure 68: Latin America Market Attractiveness Analysis by End User
  • Figure 69: Europe Market Value Share and BPS Analysis by Country, 2025 and 2035
  • Figure 70: Europe Market Value Share and BPS Analysis by Biotic Type, 2025 and 2035
  • Figure 71: Europe Market Y-o-Y Growth Comparison by Biotic Type, 2025-2035
  • Figure 72: Europe Market Attractiveness Analysis by Biotic Type
  • Figure 73: Europe Market Value Share and BPS Analysis by Flavor Type, 2025 and 2035
  • Figure 74: Europe Market Y-o-Y Growth Comparison by Flavor Type, 2025-2035
  • Figure 75: Europe Market Attractiveness Analysis by Flavor Type
  • Figure 76: Europe Market Value Share and BPS Analysis by Application, 2025 and 2035
  • Figure 77: Europe Market Y-o-Y Growth Comparison by Application, 2025-2035
  • Figure 78: Europe Market Attractiveness Analysis by Application
  • Figure 79: Europe Market Value Share and BPS Analysis by Product Form, 2025 and 2035
  • Figure 80: Europe Market Y-o-Y Growth Comparison by Product Form, 2025-2035
  • Figure 81: Europe Market Attractiveness Analysis by Product Form
  • Figure 82: Europe Market Value Share and BPS Analysis by Sales Channel, 2025 and 2035
  • Figure 83: Europe Market Y-o-Y Growth Comparison by Sales Channel, 2025-2035
  • Figure 84: Europe Market Attractiveness Analysis by Sales Channel
  • Figure 85: Europe Market Value Share and BPS Analysis by End User, 2025 and 2035
  • Figure 86: Europe Market Y-o-Y Growth Comparison by End User, 2025-2035
  • Figure 87: Europe Market Attractiveness Analysis by End User
  • Figure 88: East Asia Market Value Share and BPS Analysis by Country, 2025 and 2035
  • Figure 89: East Asia Market Value Share and BPS Analysis by Biotic Type, 2025 and 2035
  • Figure 90: East Asia Market Y-o-Y Growth Comparison by Biotic Type, 2025-2035
  • Figure 91: East Asia Market Attractiveness Analysis by Biotic Type
  • Figure 92: East Asia Market Value Share and BPS Analysis by Flavor Type, 2025 and 2035
  • Figure 93: East Asia Market Y-o-Y Growth Comparison by Flavor Type, 2025-2035
  • Figure 94: East Asia Market Attractiveness Analysis by Flavor Type
  • Figure 95: East Asia Market Value Share and BPS Analysis by Application, 2025 and 2035
  • Figure 96: East Asia Market Y-o-Y Growth Comparison by Application, 2025-2035
  • Figure 97: East Asia Market Attractiveness Analysis by Application
  • Figure 98: East Asia Market Value Share and BPS Analysis by Product Form, 2025 and 2035
  • Figure 99: East Asia Market Y-o-Y Growth Comparison by Product Form, 2025-2035
  • Figure 100: East Asia Market Attractiveness Analysis by Product Form
  • Figure 101: East Asia Market Value Share and BPS Analysis by Sales Channel, 2025 and 2035
  • Figure 102: East Asia Market Y-o-Y Growth Comparison by Sales Channel, 2025-2035
  • Figure 103: East Asia Market Attractiveness Analysis by Sales Channel
  • Figure 104: East Asia Market Value Share and BPS Analysis by End User, 2025 and 2035
  • Figure 105: East Asia Market Y-o-Y Growth Comparison by End User, 2025-2035
  • Figure 106: East Asia Market Attractiveness Analysis by End User
  • Figure 107: South Asia & Pacific Market Value Share and BPS Analysis by Country, 2025 and 2035
  • Figure 108: South Asia & Pacific Market Value Share and BPS Analysis by Biotic Type, 2025 and 2035
  • Figure 109: South Asia & Pacific Market Y-o-Y Growth Comparison by Biotic Type, 2025-2035
  • Figure 110: South Asia & Pacific Market Attractiveness Analysis by Biotic Type
  • Figure 111: South Asia & Pacific Market Value Share and BPS Analysis by Flavor Type, 2025 and 2035
  • Figure 112: South Asia & Pacific Market Y-o-Y Growth Comparison by Flavor Type, 2025-2035
  • Figure 113: South Asia & Pacific Market Attractiveness Analysis by Flavor Type
  • Figure 114: South Asia & Pacific Market Value Share and BPS Analysis by Application, 2025 and 2035
  • Figure 115: South Asia & Pacific Market Y-o-Y Growth Comparison by Application, 2025-2035
  • Figure 116: South Asia & Pacific Market Attractiveness Analysis by Application
  • Figure 117: South Asia & Pacific Market Value Share and BPS Analysis by Product Form, 2025 and 2035
  • Figure 118: South Asia & Pacific Market Y-o-Y Growth Comparison by Product Form, 2025-2035
  • Figure 119: South Asia & Pacific Market Attractiveness Analysis by Product Form
  • Figure 120: South Asia & Pacific Market Value Share and BPS Analysis by Sales Channel, 2025 and 2035
  • Figure 121: South Asia & Pacific Market Y-o-Y Growth Comparison by Sales Channel, 2025-2035
  • Figure 122: South Asia & Pacific Market Attractiveness Analysis by Sales Channel
  • Figure 123: South Asia & Pacific Market Value Share and BPS Analysis by End User, 2025 and 2035
  • Figure 124: South Asia & Pacific Market Y-o-Y Growth Comparison by End User, 2025-2035
  • Figure 125: South Asia & Pacific Market Attractiveness Analysis by End User
  • Figure 126: Middle East and Africa Market Value Share and BPS Analysis by Country, 2025 and 2035
  • Figure 127: Middle East and Africa Market Value Share and BPS Analysis by Biotic Type, 2025 and 2035
  • Figure 128: Middle East and Africa Market Y-o-Y Growth Comparison by Biotic Type, 2025-2035
  • Figure 129: Middle East and Africa Market Attractiveness Analysis by Biotic Type
  • Figure 130: Middle East and Africa Market Value Share and BPS Analysis by Flavor Type, 2025 and 2035
  • Figure 131: Middle East and Africa Market Y-o-Y Growth Comparison by Flavor Type, 2025-2035
  • Figure 132: Middle East and Africa Market Attractiveness Analysis by Flavor Type
  • Figure 133: Middle East and Africa Market Value Share and BPS Analysis by Application, 2025 and 2035
  • Figure 134: Middle East and Africa Market Y-o-Y Growth Comparison by Application, 2025-2035
  • Figure 135: Middle East and Africa Market Attractiveness Analysis by Application
  • Figure 136: Middle East and Africa Market Value Share and BPS Analysis by Product Form, 2025 and 2035
  • Figure 137: Middle East and Africa Market Y-o-Y Growth Comparison by Product Form, 2025-2035
  • Figure 138: Middle East and Africa Market Attractiveness Analysis by Product Form
  • Figure 139: Middle East and Africa Market Value Share and BPS Analysis by Sales Channel, 2025 and 2035
  • Figure 140: Middle East and Africa Market Y-o-Y Growth Comparison by Sales Channel, 2025-2035
  • Figure 141: Middle East and Africa Market Attractiveness Analysis by Sales Channel
  • Figure 142: Middle East and Africa Market Value Share and BPS Analysis by End User, 2025 and 2035
  • Figure 143: Middle East and Africa Market Y-o-Y Growth Comparison by End User, 2025-2035
  • Figure 144: Middle East and Africa Market Attractiveness Analysis by End User
  • Figure 145: Global Market - Tier Structure Analysis
  • Figure 146: Global Market - Company Share Analysis

Frequently Asked Questions

How big is the Biotic-Enhanced Flavors in 2025?

The global Biotic-Enhanced Flavors is estimated to be valued at USD 335.6 million in 2025.

What will be the size of Biotic-Enhanced Flavors in 2035?

The market size for the Biotic-Enhanced Flavors is projected to reach USD 600.5 million by 2035.

How much will be the Biotic-Enhanced Flavors growth between 2025 and 2035?

The Biotic-Enhanced Flavors is expected to grow at a 6.0% CAGR between 2025 and 2035.

What are the key flavor type in the Biotic-Enhanced Flavors?

The key flavor types in the Biotic-Enhanced Flavors Market are natural flavors, organic flavors, botanical & herbal flavors, fruit & vegetable flavors, artificial flavors, dairy-derived flavors.

Which biotic type segment to contribute significant share in the Biotic-Enhanced Flavors in 2025?

In terms of biotic type, the fermentation-derived flavors segment is projected to command the largest share at 30.0% of the Biotic-Enhanced Flavors Market in 2025.

Explore Similar Insights

Future Market Insights

Biotic Enhanced Flavors Market