AI enhanced Mammography Screening Market Size and Share Forecast Outlook 2025 to 2035

The Global AI enhanced Mammography Screening Market has been forecasted to attain a valuation of USD 159.6 million in 2025, rising to USD 364.1 million by 2035, resulting in an incremental gain of USD 204.6 million, which reflects a 43.8% increase over the forecast decade. A compound annual growth rate (CAGR) of 8.6% is expected to be recorded, indicating a rapid expansion trajectory for the global AI enhanced mammography screening market.
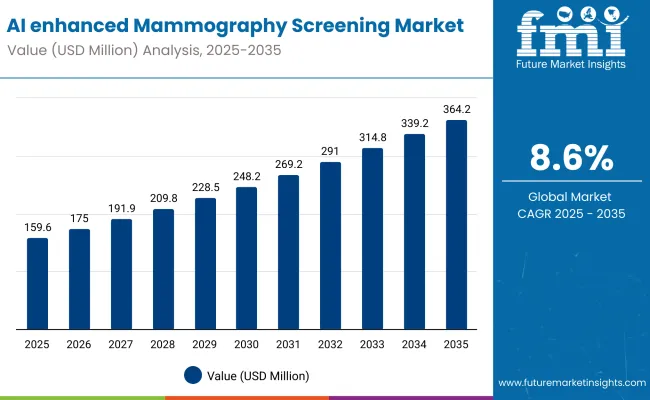
Ai Enhanced Mammography Screening Market

Global AI enhanced Mammography Screening Market Key Takeaways

Metric Value
Global AI enhanced Mammography Screening Market Estimated Value in (2025E) USD 159.6 million
Global AI enhanced Mammography Screening Market Forecast Value in (2035F) USD 364.1 million
Forecast CAGR (2025 to 2035) 8.6 %

Between 2025 and 2030, the AI-enhanced mammography screening market is expected to gain broader adoption across hospitals, diagnostic imaging centers, and community health programs, as radiologists and oncologists increasingly rely on AI-powered image analysis to improve breast cancer detection and reduce false positives. It will grow upto USD 81.5 million in that period from USD 159.6 million in 2025 to USD 241.1 million in 2030.

The convergence of deep learning algorithms, cloud-based diagnostic platforms, and user-friendly radiology software is making AI screening tools more accessible, prompting adoption even in mid-tier healthcare networks and regional diagnostic labs.

Between 2030 and 2035, the market is projected to expand further by USD 123.1million, driven by advances in multi-modal AI systems that integrate mammography with ultrasound, MRI, and tomosynthesis. Healthcare providers are expected to drive growth by adopting solutions that enhance early disease detection and efficiently handle the growing volume of screenings associated with aging populations.

Continuous development in explainable AI (XAI), federated learning for secure data sharing, and real-time clinical decision support will shape the next generation of AI-enhanced mammography solutions.

From 2020 to 2024, the global AI enhanced mammography screening market, expanded from USD 100.0million to USD 147.6 million, maturing through the broader availability of cloud-integrated AI tools and regulatory approvals in the USA and Europe. During this phase, global medtech companies partnered with healthcare institutions to validate AI algorithms on large, diverse datasets reducing bias, improving sensitivity and specificity, and building physician trust. These efforts laid the foundation for the widespread use of AI screening solutions in routine breast cancer diagnostics.

Going forward, the AI-enhanced mammography ecosystem will likely evolve to incorporate predictive analytics, patient risk stratification, and seamless integration with electronic health records (EHRs). These innovations aim to improve diagnostic accuracy, reduce healthcare costs, and expand access to underserved populations making AI-enhanced mammography a cornerstone technology in global breast cancer screening and early detection strategies.

Why the Global AI enhanced Mammography Screening Market is growing?

The growth of the global AI-enhanced mammography screening market is reinforced by the unique ability of artificial intelligence to significantly improve the accuracy, efficiency, and consistency of breast cancer detection. Unlike conventional mammography interpretation, which relies solely on radiologist expertise and is prone to variability, AI systems provide advanced pattern recognition, automated anomaly detection, and real-time decision support making them indispensable for next-generation diagnostic workflows.

Over the last decade, the scope of AI in mammography has expanded beyond simple image recognition. It is now a critical component of comprehensive breast imaging programs, enabling earlier detection of microcalcifications, tumor margins, and dense tissue abnormalities that are often missed by traditional methods. As healthcare systems increasingly prioritize early diagnosis and personalized treatment, AI-enhanced mammography is becoming a mandatory tool across leading hospitals, imaging networks, and cancer research centers.

Another factor driving adoption is the shift from isolated imaging systems to cloud-integrated, scalable AI platforms. Solution providers now offer turnkey solutions that integrate AI algorithms with picture archiving and communication systems (PACS), cloud-based storage platforms, and automated reporting modules. Key solution providers include iCAD, ScreenPoint Medical, Hologic, RadNet’sDeepHealth, GE HealthCare, and Sectra. These solutions enable hospitals, diagnostic imaging centers, and mobile screening units to deploy advanced breast screening programs while reducing workflow bottlenecks and minimizing radiologist workload.

Moreover, rising demand from interdisciplinary healthcare applications including population-wide screening programs, tele-radiology networks, and AI-assisted risk stratification is accelerating the development of hybrid diagnostic platforms that combine mammography with MRI, ultrasound, and tomosynthesis. These systems address the increasing need to improve sensitivity in dense breast tissues and high-risk patient populations.

Collectively, these clinical and technological drivers are positioning the AI-enhanced mammography screening market for sustained expansion, fueled by its essential role in improving early detection rates, reducing diagnostic errors, and supporting global efforts to lower breast cancer mortality.

Segmental Analysis

The market is segmented by type, imaging technology, application, end user, and region.Type includes computer-aided detection (CADe), computer-aided diagnosis (CADx), deep learning-based tools, hybrid AI solutions, risk assessment and breast density tools, and others.Imaging technology classification covers 2D digital mammography (FFDM), 3D mammography / digital breast tomosynthesis (DBT), synthetic mammography, contrast-enhanced mammography, and others.

Based on application, the segmentation includes screening, diagnostic follow-up, risk prediction / stratification, triage and workflow optimization, and others. Based on end user, the segmentation includes hospitals and general clinics, cancer centers, diagnostic imaging centers, and mobile screening units.Regionally, the scope spans North America, Latin America, Western and Eastern Europe, East Asia, South Asia and Pacific, and the Middle East and Africa.
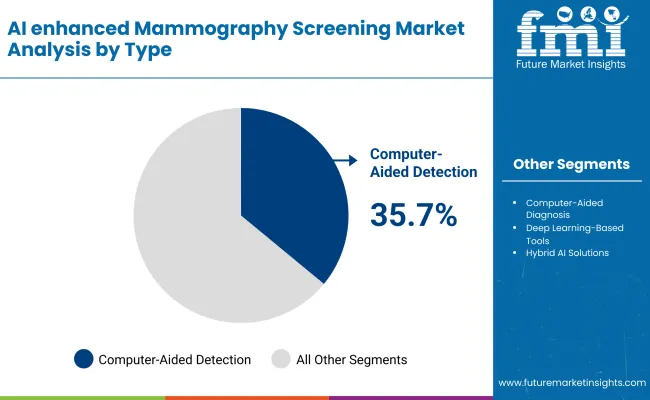
Insights into the Type Segment with Computer-Aided Detection (CADe) Leading the Demand

Ai Enhanced Mammography Screening Market By Type

Type Market Value Share, 2025
Computer-Aided Detection (CADe) 35.7%
Computer-Aided Diagnosis (CADx) 20.3%
Deep Learning-Based Tools 17.0%
Hybrid AI Solutions 12.0%
Risk Assessment & Breast Density Tools 8.6%
Others 6.4%

Computer-Aided Detection (CADe) is projected to lead the product category with a 35.7% market share in 2025, and is expected to maintain this position due to its ability to automatically identify suspicious regions in mammograms with high sensitivity and accuracy enabling radiologists to detect early-stage breast cancers while reducing diagnostic oversight.

Unlike manual review processes, CADe systems integrate AI algorithms with PACS, cloud-based storage, and automated reporting, allowing seamless workflow integration across hospitals, cancer centers, and mobile screening units.

Recent advances in deep learning, image preprocessing, and multi-modality integration have enhanced the precision of CADe systems, enabling detection of microcalcifications, subtle lesions, and architectural distortions across 2D digital mammography, 3D tomosynthesis, and contrast-enhanced imaging. Moreover, AI-powered analytics now support real-time case prioritization, reducing radiologist workload and improving screening throughput.

Computer-Aided Diagnosis (CADx), with a 20.3% share, complements CADe by providing malignancy scoring, lesion characterization, and risk stratification to guide clinical decision-making. A key factor behind the growing adoption of AI-based mammography solutions is their increasing deployment across hospitals, diagnostic imaging centers, and mobile units.

With leading solution providers offering turnkey, PACS-integrated platforms that require minimal user calibration, CADe and CADx systems are becoming accessible even to smaller facilities. Their combination of operational efficiency, diagnostic accuracy, and workflow optimization ensures that AI-enhanced mammography remains central to modern breast cancer screening programs worldwide.
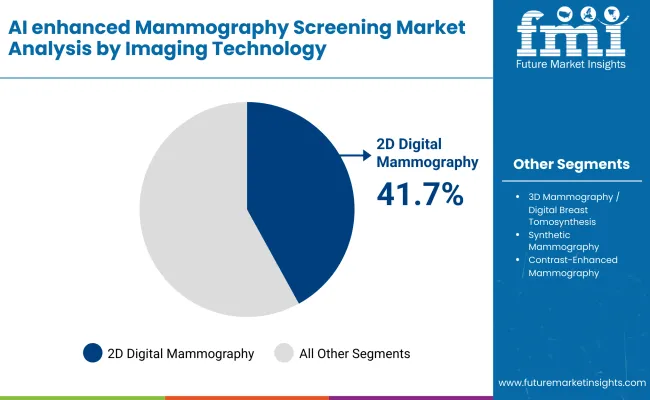
Insights into the Imaging Technology Segment with 2D Digital Mammography (FFDM) Dominating the Market

Ai Enhanced Mammography Screening Market By Imaging Technology

Imaging Technology Market Value Share, 2025
2D Digital Mammography (FFDM) 41.7%
3D Mammography / Digital Breast Tomosynthesis (DBT) 35.0%
Synthetic Mammography 10.0%
Contrast-Enhanced Mammography 6.0%
Others 7.3%

2D Digital Mammography (FFDM) continues to dominate the breast imaging landscape, accounting for 41.7% of total demand in 2025. This modality remains the foundation of breast cancer screening and diagnosis due to its proven ability to detect microcalcifications, masses, and architectural distortions with high spatial resolution. As a standard clinical tool, 2D FFDM provides reproducible results, broad compatibility with imaging workflows, and well-established interpretation protocols that support large-scale screening programs.

What makes 2D FFDM indispensable is its mature ecosystem and extensive clinical experience. Radiologists and imaging centers have long-standing expertise with 2D mammography systems, and decades of accumulated patient data create a rich reference framework for comparative studies and longitudinal assessments. The technique is particularly effective for routine population screening and initial diagnostic evaluations, where reliable baseline imaging is critical.

Recent advancements in detector technology, image processing software, and radiation dose optimization have further enhanced the clarity, safety, and usability of 2D mammography systems. Moreover, ongoing integration into medical education and national screening initiatives ensures a sustained pipeline of skilled operators and stable clinical adoption.

While advanced modalities such as 3D Mammography / Digital Breast Tomosynthesis (DBT), Synthetic Mammography, and Contrast-Enhanced Mammography are gaining traction in specialized applications 2D FFDM remains the mainstay of the global mammography market. Its versatility, accessibility, and proven clinical utility continue to make it the preferred choice for a wide range of screening and diagnostic scenarios, while emerging technologies complement rather than replace its role.

What are the Drivers, Restraints, and Key Trends of the Global AI enhanced Mammography Screening Market?

The adoption of AI-enhanced mammography screening is accelerating across healthcare systems as advancements in artificial intelligence, imaging technologies, and cloud-based analytics converge to improve early breast cancer detection. While momentum is strong, the market also faces structural challenges related to infrastructure, regulatory compliance, and integration complexity.

Rising demand for early breast cancer detectionBreast cancer remains one of the most prevalent cancers among women worldwide, and early detection is critical for improving treatment outcomes and survival rates. Increasing awareness of regular screening programs, coupled with rising healthcare expenditures, has motivated healthcare providers to adopt advanced diagnostic tools capable of enhancing detection rates.

AI-enabled mammography systems leverage machine learning and deep learning algorithms to identify subtle anomalies in breast tissue, often undetectable in traditional manual screenings. These systems support radiologists by providing consistent, rapid, and accurate preliminary analyses, thereby reducing diagnostic errors and improving workflow efficiency.

Aging populations and the corresponding increase in the number of women eligible for regular screening have further amplified demand, driving hospitals, imaging centers, and diagnostic networks to invest in AI-assisted mammography. This growing need for timely, accurate detection is expected to sustain market growth over the coming years, positioning AI-enhanced mammography as an essential component in modern breast cancer screening strategies.

Growing adoption of predictive analytics is enabling personalized breast cancer screening and optimized patient care

Predictive models analyze patient data including age, family history, genetic markers, and previous imaging results to estimate individual risk profiles and recommend tailored screening schedules. This approach allows healthcare providers to focus resources on high-risk populations while reducing unnecessary screenings for low-risk patients, optimizing both cost efficiency and clinical outcomes.

AI algorithms enhance predictive capabilities by continuously learning from large datasets, identifying patterns that may be missed by conventional analysis. Integration with electronic health records (EHRs) and multi-modality imaging platforms further strengthens these predictive insights, allowing radiologists to make informed decisions based on comprehensive patient histories.

Predictive analytics not only improves early detection rates but also contributes to more proactive and personalized care, aligning with broader trends in precision medicine. As healthcare systems worldwide move toward data-driven decision-making, the adoption of predictive AI tools in mammography is expected to accelerate, shaping the next generation of breast cancer screening programs.

Regulatory and data privacy challenges remain key barriers to widespread adoption of AI-enhanced mammography solutionsHealthcare providers must comply with strict standards such as HIPAA in the United States and GDPR in Europe, which govern patient data collection, storage, and sharing. Ensuring that AI systems meet these compliance requirements often entails additional investments in secure infrastructure, encrypted storage, and audit mechanisms.

Moreover, the validation and approval of AI algorithms for clinical use require rigorous testing, clinical trials, and regulatory clearance, which can be time-consuming and costly. Variations in regulations across regions further complicate market expansion, particularly for vendors seeking global adoption.

Concerns over patient privacy and the security of sensitive health data may also limit willingness among institutions to fully deploy AI solutions, especially in cloud-based platforms. Addressing these regulatory and privacy challenges is critical for maintaining trust in AI-assisted diagnostics.
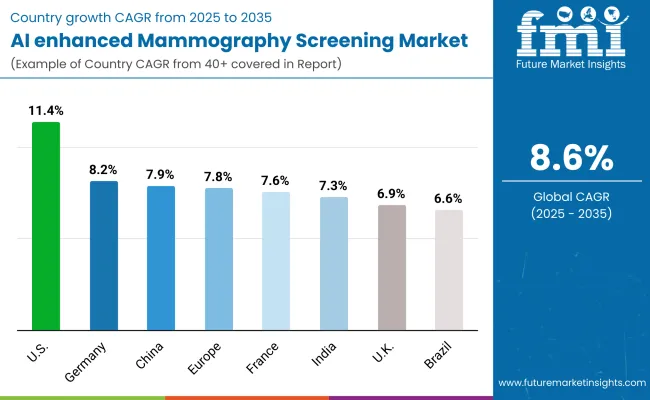
Analysis of Global AI enhanced Mammography Screening Market, By Key Countries

Ai Enhanced Mammography Screening Market Country Wise Analaysis

Country CAGR
USA 11.4%
Brazil 6.6%
China 7.9%
India 7.3%
Europe 7.8%
Germany 8.2%
France 7.6%
UK 6.9%

The adoption and growth patterns of AI-enhanced mammography screening systems exhibit distinct variations across different regions, influenced by the maturity of healthcare infrastructure, government and private investment in medical technologies, and the demand for advanced diagnostic solutions.

In the United States, the AI-enhanced mammography market is characterized by strong growth driven by a robust ecosystem of hospitals, diagnostic imaging centers, cancer centers, and technology providers developing AI algorithms for early breast cancer detection.

The widespread availability of advanced imaging modalities including 2D digital mammography, 3D tomosynthesis, and contrast-enhanced systems combined with integrated AI platforms, supports high diagnostic accuracy and operational efficiency. Continuous investment in AI validation studies, PACS integration, and cloud-based analytics further propels adoption, particularly in large hospital networks and specialized breast care centers. The market here is projected to account for 11.4% of the global AI-enhanced mammography screening market.

In Europe, countries such as Germany, France, and the UK are leading the AI-enhanced mammography screening market, with growing emphasis on integrating advanced imaging technologies and AI-driven diagnostic tools within national healthcare strategies and cancer prevention programs.

Government-backed digital health initiatives, hospital networks, and large-scale screening programs facilitate collaboration between clinical centers, technology providers, and research institutions, enabling adoption of solutions such as computer-aided detection (CADe), computer-aided diagnosis (CADx), deep learning-based platforms, and hybrid AI tools.

Regulatory support, reimbursement frameworks, and strategic funding foster sustained market growth, though adoption remains cautiously progressive as healthcare providers validate AI algorithms and optimize clinical workflows.

Multi-modality support including 2D digital mammography, 3D tomosynthesis, synthetic mammography, and contrast-enhanced imaging further strengthens the market by improving early detection and diagnostic accuracy. The market in Germany is projected to grow at a CAGR of 8.2%, France at 7.6%, and the UK at 6.9%.

Overall, the European AI-enhanced mammography market reflects a strategic blend of technological advancement, healthcare policy alignment, and institutional investment, which collectively govern the pace and scale of adoption across different countries. This interplay underscores the central role that regional infrastructure, regulatory guidance, and clinical expertise play in shaping the trajectory of AI-driven breast cancer screening programs.
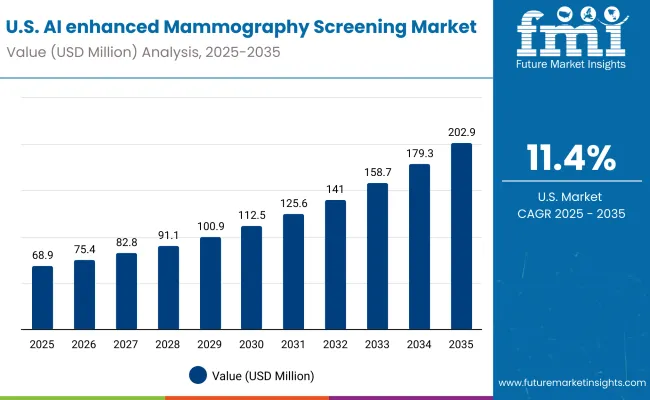
Sales Outlook for Global AI enhanced Mammography Screening in the United States

Usa Ai Enhanced Mammography Screening Market

The United States represents the most mature and research-intensive market for AI-enhanced mammography screening, forecasted to expand at a CAGR of 11.4% between 2025 and 2035. Hospitals, cancer centers, and academic institutions including MD Anderson, Mayo Clinic, and Harvard-affiliated hospitals have been pivotal in setting global benchmarks for AI adoption in breast imaging. The USA benefits from extensive digital imaging infrastructure, advanced PACS systems, and robust regulatory frameworks that support the integration of AI algorithms into clinical practice.

  • Commercial adoption is driven by private hospital networks and imaging centers seeking improved cancer detection rates, reduced recall rates, and workflow efficiency.
  • Vendors are developing AI-enabled platforms for automated lesion detection, triage prioritization, and decision support, reducing radiologist workload and interpretation time.
  • Cross-disciplinary collaborations between radiology, oncology, and data science teams are fostering innovative programs that combine AI analysis with DBT, contrast-enhanced mammography, and risk-based screening models.

Growth and Expansion Outlook for Global AI enhanced Mammography Screening Market in India

India’s AI-enhanced mammography screening market is expected to grow at a CAGR of 7.3% between 2025 and 2035, supported by increasing awareness, rising breast cancer incidence, and expanding urban healthcare infrastructure. Although AI-assisted mammography adoption is currently focused in Tier 1 cities and major hospital networks, smaller clinics and regional healthcare centers across India are increasingly beginning to implement these systems.

  • Many deployments are grant-supported or part of government health initiatives, with funding from programs under the Ministry of Health and Family Welfare or state-level public health schemes.
  • Collaborations with international technology providers are common, enabling access to advanced AI algorithms and cloud-based imaging platforms.
  • Some Indian hospitals are experimenting with lower-cost, AI-enabled screening solutions to improve accessibility and reduce diagnostic delays, particularly in semi-urban and rural areas.

Sales Outlook for Global AI enhanced Mammography Screening in China

China’s AI-enhanced mammography screening market is projected to expand at a CAGR of 7.9% from 2025 to 2035, driven by strong government investment in digital healthcare, AI research, and breast cancer screening programs. Companies such as Yitu Technology, Lunit, and iCAD are at the forefront of deploying AI-assisted mammography solutions across clinical and research settings in China.
  • Domestic vendors such asYitu Technology, Lunit, iCADandHologic are emerging with integrated AI screening platforms that combine 2D FFDM, DBT, and synthetic mammography, offering cost-effective and scalable solutions for hospitals.
  • State-funded healthcare initiatives and regional government co-funding programs are accelerating adoption in Tier 1 and Tier 2 cities, expanding access beyond major metropolitan centers.
  • Multi-hospital networks are increasingly leveraging AI analytics for centralized reading, quality control, and population-based breast cancer screening campaigns, creating a robust ecosystem for long-term growth.

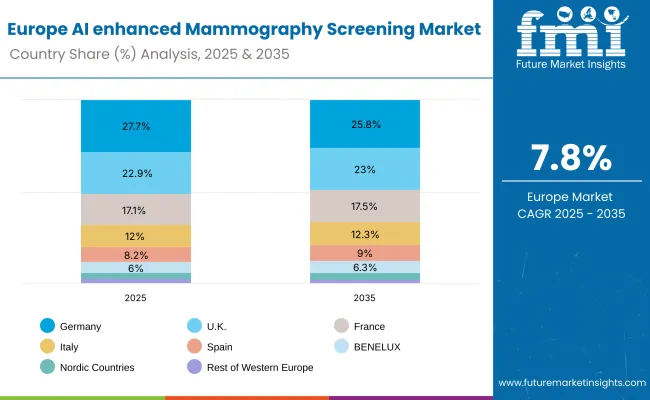
Sales Outlook for Global AI enhanced Mammography Screening in Europe

Europe Ai Enhanced Mammography Screening Market

Europe Country 2025
Germany 27.7%
UK 22.9%
France 17.1%
Italy 12.0%
Spain 8.2%
BENELUX 6.0%
Nordic Countries 3.4%
Rest of Western Europe 2.7%
Europe Country 2035
Germany 25.8%
UK 23.0%
France 17.5%
Italy 12.3%
Spain 9.0%
BENELUX 6.3%
Nordic Countries 4.1%
Rest of Western Europe 2.0%

Growth and Expansion Outlook for Global AI enhanced Mammography Screening Market in the United Kingdom

The AI-enhanced mammography screening market in the United Kingdom is projected to grow at a CAGR of 6.9% between 2025 and 2035. Adoption is supported by strong public investment in digital healthcare, AI research, and national breast cancer screening programs.

Innovation pilot projects in the UK are deploying AI-assisted mammography in hospitals and research centers, utilizing cloud-based imaging networks and AI algorithms to enhance diagnostic accuracy and operational efficiency. The country benefits from centralized imaging networks and cloud-based platforms that enable multi-site collaboration and AI-driven analytics.

Recent initiatives have accelerated lab- and hospital-based deployment of AI systems, with capital grants from UKRI and NHS innovation funds supporting pilot projects and large-scale trials. AI-assisted imaging is increasingly being used in conjunction with digital breast tomosynthesis (DBT) and synthetic mammography, enabling more accurate and comprehensive breast cancer detection.

  • Cross-institutional training programs for radiologists and imaging technicians are enhancing operator readiness and reducing downtime for AI system usage.
  • Government funding streams, including NHS innovation accelerators and cancer research initiatives, are prioritizing AI-driven diagnostic tools.
  • AI-enhanced mammography is also being explored in private clinics and industry-sponsored research centers to improve workflow efficiency and diagnostic accuracy, expanding use beyond traditional hospital networks.

In-depth Analysis of Global AI enhanced Mammography Screening in Germany

The AI-enhanced mammography screening market in Germany is anticipated to grow at a CAGR of 8.2% between 2025 and 2035. Germany is establishing itself as a hub for high-precision breast imaging, particularly through AI-assisted 3D mammography, synthetic mammography, and contrast-enhanced modalities.

While clinical adoption remains strong in academic hospitals, much of the current growth is fueled by partnerships between federal health agencies, leading university hospitals, and medical technology manufacturers. German companies are playing a strategic role in developing AI algorithms, imaging workstations, and integrated cloud solutions for breast cancer screening, which are increasingly being deployed internationally.
  • Instrumentation and AI technology firms in Germany are key suppliers of software and imaging platforms, exporting extensively to hospitals and screening programs worldwide.
  • Applied R&D centers use AI-assisted mammography to optimize detection rates in dense breast tissue, monitor treatment response, and study population-level screening outcomes.
  • Federal initiatives, such as funding from the German Research Foundation (DFG) and regional healthcare innovation programs, support multi-center trials that integrate AI into national breast cancer screening networks.

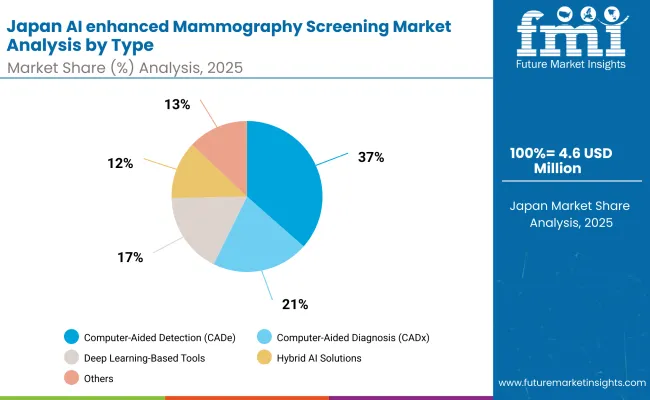
Growth Outlook for Global AI enhanced Mammography Screening Market in Japan

Japan Ai Enhanced Mammography Screening Market By Type

Type Market Value Share, 2025
Computer-Aided Detection (CADe) 36.5%
Computer-Aided Diagnosis (CADx) 20.8%
Deep Learning-Based Tools 17.4%
Hybrid AI Solutions 12.3%
Risk Assessment & Breast Density Tools 8.8%
Others 13.0%

The AI-enhanced mammography market in Japan is projected to reach USD 4.63 million by 2025. Computer-Aided Detection (CADe) dominates the product landscape with a 36.5% share, followed by Computer-Aided Diagnosis (CADx) at 20.8%.

Japan’s AI mammography market is shaped by a strong culture of technological innovation, robust public healthcare infrastructure, and a focus on early cancer detection. The integration of AI into breast cancer screening has improved diagnostic accuracy, reduced recall rates, and enhanced workflow efficiency in healthcare facilities across the country. As Japan continues to invest in AI technology and research, the adoption of AI-assisted mammography is expected to expand, further strengthening the country’s capabilities in early breast cancer detection and treatment.
  • National healthcare initiatives and research grants are making high-performance AI mammography systems more widely available in academic hospitals and regional medical centers, enabling earlier and more accurate breast cancer detection for patients.
  • Healthcare providers are noticing that hybrid AI solutions, which combine detection, diagnosis, and risk stratification, help prioritize high-risk patients, streamline workflows, and reduce the time from screening to clinical decision-making.
  • Radiologists appreciate that Japanese-developed AI tools are designed for seamless integration with both 2D and 3D mammography systems, offering customizable features while maintaining rigorous clinical validation, ensuring confidence in AI-assisted diagnoses.

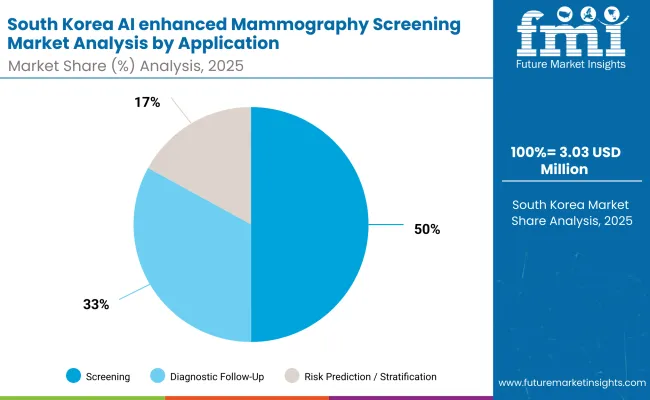
Opportunity Analysis of South Korea Global AI enhanced Mammography Screening Market

South Korea Ai Enhanced Mammography Screening Market By Application

By Application Market Value Share, 2025
Screening 49.9%
Diagnostic Follow-Up 32.2%
Risk Prediction / Stratification 16.7%
Triage & Workflow Optimization 7.8%
Others 17.9%

The AI-enhanced mammography market in South Korea is projected to reach USD 1.1 million in 2025. Screening dominates the product landscape with a 49.9% share, followed by Diagnostic Follow-Up at 32.2%.South Korea’s AI mammography market is evolving rapidly, moving from early pilot programs toward nationwide clinical deployment. Hospitals often deploy multiple AI modalities ranging from automated screening to risk stratification tools enabling comprehensive patient management.
  • AI-assisted diagnostic follow-up systems are increasingly co-located with imaging centers and electronic health record platforms, allowing near real-time feedback and case review.
  • Domestic technology firms and hospital-industry consortia are investing in deep learning algorithms that enhance lesion detection, triage efficiency, and predictive risk modeling.
  • Strong digital infrastructure enables centralized data analysis, multi-institution collaboration, and integration with national screening programs, facilitating large-scale population studies.

Competitive Landscape of Global AI enhanced Mammography Screening Market

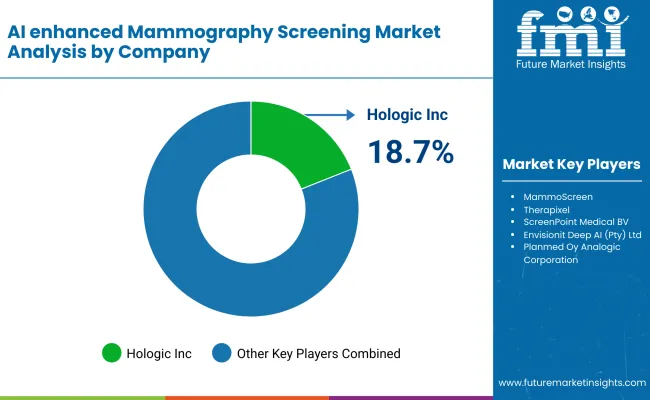
Ai Enhanced Mammography Screening Market By Company

Company Global Value Share 2024
Hologic , Inc. 18.7%
Others 81.3%

The AI-enhanced mammography screening market is moderately concentrated, with Hologic, Inc. holding a leading position globally at 18.7% share in 2024. Hologic’s dominance stems from its comprehensive portfolio of 2D and 3D mammography systems integrated with advanced AI tools for lesion detection, diagnostic follow-up, and risk stratification. Its platforms are widely adopted across hospitals, imaging centers, and screening programs, supported by robust software updates, clinical validation, and strong customer support.

Other key players collectively account for 81.3% of the market, addressing diverse segments and specialized use cases. iCAD, Inc. (DeepHealth) focuses on AI-assisted cancer detection and workflow optimization, while MammoScreen and Therapixel provide deep-learning-based image analysis solutions. ScreenPoint Medical BV. andEnvisionit Deep AI (Pty) Ltd. target screening programs and hybrid AI workflows, enhancing sensitivity and efficiency.

Key Developments in Global AI enhanced Mammography Screening Market

  • On September 2025,ScreenPoint Medical has announced that itsTranspara® AI solution for breast imaging has been chosen as the technology partner for the PRISM (Pragmatic Randomized Trial of Artificial Intelligence for Screening Mammography) Trial. Supported by a $16 million grant from the Patient-Centered Outcomes Research Institute (PCORI), the trial represents the first large-scale randomized controlled study in the United States designed to rigorously assess the impact of artificial intelligence on breast cancer screening.
  • On May 2025, Hologic’s Genius AI Detection PRO was recognized by MedTech Breakthrough as the ‘Best New Imaging Technology Solution,’ reflecting its demonstrated improvements in diagnostic accuracy and workflow efficiency in mammography.
  • On May 2025, Hologic’s Genius AI Detection PRO was recognized by MedTech Breakthrough as the ‘Best New Imaging Technology Solution.’ This accolade underscores the platform’s proven ability to enhance diagnostic precision, streamline radiologists workflow, and support more efficient and accurate mammography interpretation.

Scope of the Report

Item Value
Quantitative Units USD 159.6 million
By Type Computer-Aided Detection (CADe), Computer-Aided Diagnosis (CADx), Deep Learning-Based Tools, Hybrid AI Solutions, Risk Assessment & Breast Density Tools and others
By Imaging Technology 2D Digital Mammography (FFDM), 3D Mammography / Digital Breast Tomosynthesis (DBT), Synthetic Mammography, Contrast-Enhanced Mammography and others
By Application Screening, Diagnostic Follow-Up, Risk Prediction / Stratification, Triage & Workflow Optimization and others
Regions Covered North America, Latin America, Western Europe, Eastern Europe, East Asia, South Asia & Pacific, Middle East & Africa
Countries Covered USA, Brazil, China, India, Europe, Germany, France and UK
Key Companies Profiled Hologic , Inc., iCAD , Inc. (DeepHealth), MammoScreen , Therapixel , ScreenPoint Medical BV., Envisionit Deep AI (Pty) Ltd., Human Bytes, Planmed Oy, Analogic Corporation, GE HealthCare, Koninklijke Philips N.V., Esaote SPA

Key Segments

By Type:

  • Computer-Aided Detection (CADe)
  • Computer-Aided Diagnosis (CADx)
  • Deep Learning-Based Tools
  • Hybrid AI Solutions
  • Risk Assessment & Breast Density Tools
  • Others

By Imaging Technology:

  • 2D Digital Mammography (FFDM)
  • 3D Mammography / Digital Breast Tomosynthesis (DBT)
  • Synthetic Mammography
  • Contrast-Enhanced Mammography
  • Others

By Application:

  • Screening
  • Diagnostic Follow-Up
  • Risk Prediction / Stratification
  • Triage & Workflow Optimization
  • Others

By End User:

  • Hospitals & General Clinics
  • Cancer Centers
  • Diagnostic Imaging Centers
  • Mobile Screening Units

By Region:

  • North America
  • Latin America
  • Western Europe
  • Eastern Europe
  • East Asia
  • South Asia
  • MEA

Table of Content

  1. Executive Summary
    • Global Market Outlook
    • Demand-side Trends
    • Supply-side Trends
    • Technology Roadmap Analysis
    • Analysis and Recommendations
  2. Market Overview
    • Market Coverage / Taxonomy
    • Market Definition / Scope / Limitations
  3. Market Background
    • Market Dynamics
      • Drivers
      • Restraints
      • Opportunity
      • Trends
    • Scenario Forecast
      • Demand in Optimistic Scenario
      • Demand in Likely Scenario
      • Demand in Conservative Scenario
    • Opportunity Map Analysis
    • Product Life Cycle Analysis
    • Technological Advancement
    • Investment Feasibility Matrix
    • PESTLE and Porter’s Analysis
    • Regulatory Landscape
  4. By Key Regions
  5. By Key Countries
    • Regional Parent Market Outlook
    • Recent Product Launches/Approvals
  6. Global Market Analysis 2020 to 2024 and Forecast, 2025 to 2035
    • Historical Market Size Value (USD Million) Analysis, 2020 to 2024
    • Current and Future Market Size Value (USD Million) Projections, 2025 to 2035
      • Y-o-Y Growth Trend Analysis
      • Absolute $ Opportunity Analysis
  7. Global Market Analysis 2020 to 2024 and Forecast 2025 to 2035, By Type
    • Introduction / Key Findings
    • Historical Market Size Value (USD Million) Analysis By Type, 2020 to 2024
    • Current and Future Market Size Value (USD Million) Analysis and Forecast By Type, 2025 to 2035
      • Computer-Aided Detection (CADe)
      • Computer-Aided Diagnosis (CADx)
      • Deep Learning-Based Tools
      • Hybrid AI Solutions
      • Risk Assessment & Breast Density Tools
      • Others
    • Y-o-Y Growth Trend Analysis By Type, 2020 to 2024
    • Absolute $ Opportunity Analysis By Type, 2025 to 2035
  8. Global Market Analysis 2020 to 2024 and Forecast 2025 to 2035, By Imaging Technology
    • Introduction / Key Findings
    • Historical Market Size Value (USD Million) Analysis By Imaging Technology, 2020 to 2024
    • Current and Future Market Size Value (USD Million) Analysis and Forecast By Imaging Technology, 2025 to 2035
      • 2D Digital Mammography (FFDM)
      • 3D Mammography / Digital Breast Tomosynthesis (DBT)
      • Synthetic Mammography
      • Contrast-Enhanced Mammography
      • Others
    • Y-o-Y Growth Trend Analysis By Imaging Technology, 2020 to 2024
    • Absolute $ Opportunity Analysis By Imaging Technology, 2025 to 2035
  9. Global Market Analysis 2020 to 2024 and Forecast 2025 to 2035, By Application
    • Introduction / Key Findings
    • Historical Market Size Value (USD Million) Analysis By Application, 2020 to 2024
    • Current and Future Market Size Value (USD Million) Analysis and Forecast By Application, 2025 to 2035
      • Screening
      • Diagnostic Follow-Up
      • Risk Prediction / Stratification
      • Triage & Workflow Optimization
      • Others
    • Y-o-Y Growth Trend Analysis By Application, 2020 to 2024
    • Absolute $ Opportunity Analysis By Application, 2025 to 2035
  10. Global Market Analysis 2020 to 2024 and Forecast 2025 to 2035, By End User
    • Introduction / Key Findings
    • Historical Market Size Value (USD Million) Analysis By End User, 2020 to 2024
    • Current and Future Market Size Value (USD Million) Analysis and Forecast By End User, 2025 to 2035
      • Hospitals & General Clinics
      • Cancer Centers
      • Diagnostic Imaging Centers
      • Mobile Screening Value (USD Million)s
    • Y-o-Y Growth Trend Analysis By End User, 2020 to 2024
    • Absolute $ Opportunity Analysis By End User, 2025 to 2035
  11. Global Market Analysis 2020 to 2024 and Forecast 2025 to 2035, By Region
    • Introduction
    • Historical Market Size Value (USD Million) Analysis By Region, 2020 to 2024
    • Current Market Size Value (USD Million) Analysis and Forecast By Region, 2025 to 2035
      • North America
      • Latin America
      • Western Europe
      • Eastern Europe
      • East Asia
      • South Asia
      • MEA
    • Market Attractiveness Analysis By Region
  12. North America Market Analysis 2020 to 2024 and Forecast 2025 to 2035, By Country
    • Historical Market Size Value (USD Million) Trend Analysis By Market Taxonomy, 2020 to 2024
    • Market Size Value (USD Million) Forecast By Market Taxonomy, 2025 to 2035
      • By Country
        • USA
        • Canada
        • Mexico
      • By Type
      • By Imaging Technology
      • By Application
      • By End User
    • Market Attractiveness Analysis
      • By Country
      • By Type
      • By Imaging Technology
      • By Application
      • By End User
    • Key Takeaways
  13. Latin America Market Analysis 2020 to 2024 and Forecast 2025 to 2035, By Country
    • Historical Market Size Value (USD Million) Trend Analysis By Market Taxonomy, 2020 to 2024
    • Market Size Value (USD Million) Forecast By Market Taxonomy, 2025 to 2035
      • By Country
        • Brazil
        • Argentina
        • Rest of Latin America
      • By Type
      • By Imaging Technology
      • By Application
      • By End User
    • Market Attractiveness Analysis
      • By Country
      • By Type
      • By Imaging Technology
      • By Application
      • By End User
    • Key Takeaways
  14. Western Europe Market Analysis 2020 to 2024 and Forecast 2025 to 2035, By Country
    • Historical Market Size Value (USD Million) Trend Analysis By Market Taxonomy, 2020 to 2024
    • Market Size Value (USD Million) Forecast By Market Taxonomy, 2025 to 2035
      • By Country
        • Germany
        • Italy
        • France
        • UK
        • Spain
        • BENELUX
        • Nordic Countries
        • Rest of Western Europe
      • By Type
      • By Imaging Technology
      • By Application
      • By End User
    • Market Attractiveness Analysis
      • By Country
      • By Type
      • By Imaging Technology
      • By Application
      • By End User
    • Key Takeaways
  15. Eastern Europe Market Analysis 2020 to 2024 and Forecast 2025 to 2035, By Country
    • Historical Market Size Value (USD Million) Trend Analysis By Market Taxonomy, 2020 to 2024
    • Market Size Value (USD Million) Forecast By Market Taxonomy, 2025 to 2035
      • By Country
        • Russia
        • Hungry
        • Poland
        • Rest of Eastern Europe
      • By Type
      • By Imaging Technology
      • By Application
      • By End User
    • Market Attractiveness Analysis
      • By Country
      • By Type
      • By Imaging Technology
      • By Application
      • By End User
    • Key Takeaways
  16. East Asia Market Analysis 2020 to 2024 and Forecast 2025 to 2035, By Country
    • Historical Market Size Value (USD Million) Trend Analysis By Market Taxonomy, 2020 to 2024
    • Market Size Value (USD Million) Forecast By Market Taxonomy, 2025 to 2035
      • By Country
        • China
        • Japan
        • South Korea
      • By Type
      • By Imaging Technology
      • By Application
      • By End User
    • Market Attractiveness Analysis
      • By Country
      • By Type
      • By Imaging Technology
      • By Application
      • By End User
    • Key Takeaways
  17. South Asia Market Analysis 2020 to 2024 and Forecast 2025 to 2035, By Country
    • Historical Market Size Value (USD Million) Trend Analysis By Market Taxonomy, 2020 to 2024
    • Market Size Value (USD Million) Forecast By Market Taxonomy, 2025 to 2035
      • By Country
        • India
        • ASIAN Countries
        • Australia & New Zealand
        • Rest of South Asia
      • By Type
      • By Imaging Technology
      • By Application
      • By End User
    • Market Attractiveness Analysis
      • By Country
      • By Type
      • By Imaging Technology
      • By Application
      • By End User
    • Key Takeaways
  18. MEA Market Analysis 2020 to 2024 and Forecast 2025 to 2035, By Country
    • Historical Market Size Value (USD Million) Trend Analysis By Market Taxonomy, 2020 to 2024
    • Market Size Value (USD Million) Forecast By Market Taxonomy, 2025 to 2035
      • By Country
        • Saudi Arabia
        • Türkiye
        • South Africa
        • Other African Union
        • Rest of MEA
      • By Type
      • By Imaging Technology
      • By Application
      • By End User
    • Market Attractiveness Analysis
      • By Country
      • By Type
      • By Imaging Technology
      • By Application
      • By End User
    • Key Takeaways
  19. Key Countries Market Analysis
    • USA
      • Pricing Analysis
      • Market Share Analysis, 2024
        • By Type
        • By Imaging Technology
        • By Application
        • By End User
    • Brazil
      • Pricing Analysis
      • Market Share Analysis, 2024
        • By Type
        • By Imaging Technology
        • By Application
        • By End User
    • China
      • Pricing Analysis
      • Market Share Analysis, 2024
        • By Type
        • By Imaging Technology
        • By Application
        • By End User
    • India
      • Pricing Analysis
      • Market Share Analysis, 2024
        • By Type
        • By Imaging Technology
        • By Application
        • By End User
    • Europe
      • Pricing Analysis
      • Market Share Analysis, 2024
        • By Type
        • By Imaging Technology
        • By Application
        • By End User
    • Germany
      • Pricing Analysis
      • Market Share Analysis, 2024
        • By Type
        • By Imaging Technology
        • By Application
        • By End User
    • France
      • Pricing Analysis
      • Market Share Analysis, 2024
        • By Type
        • By Imaging Technology
        • By Application
        • By End User
    • UK
      • Pricing Analysis
      • Market Share Analysis, 2024
        • By Type
        • By Imaging Technology
        • By Application
        • By End User
  20. Market Structure Analysis
    • Competition Dashboard
    • Competition Benchmarking
    • Market Share Analysis of Top Players
      • By Regional
      • By Type
      • By Imaging Technology
      • By Application
      • By End User
  21. Competition Analysis
    • Competition Deep Dive
      • Hologic, Inc.
        • Overview
        • Product Portfolio
        • Profitability by Market Segments
        • Sales Footprint
        • Strategy Overview
          • Marketing Strategy
          • Product Strategy
          • Channel Strategy
      • Others
        • Overview
        • Product Portfolio
        • Profitability by Market Segments
        • Sales Footprint
        • Strategy Overview
          • Marketing Strategy
          • Product Strategy
          • Channel Strategy
      • iCAD, Inc. (DeepHealth)
        • Overview
        • Product Portfolio
        • Profitability by Market Segments
        • Sales Footprint
        • Strategy Overview
          • Marketing Strategy
          • Product Strategy
          • Channel Strategy
      • MammoScreen
        • Overview
        • Product Portfolio
        • Profitability by Market Segments
        • Sales Footprint
        • Strategy Overview
          • Marketing Strategy
          • Product Strategy
          • Channel Strategy
      • Therapixel
        • Overview
        • Product Portfolio
        • Profitability by Market Segments
        • Sales Footprint
        • Strategy Overview
          • Marketing Strategy
          • Product Strategy
          • Channel Strategy
      • ScreenPoint Medical BV.
        • Overview
        • Product Portfolio
        • Profitability by Market Segments
        • Sales Footprint
        • Strategy Overview
          • Marketing Strategy
          • Product Strategy
          • Channel Strategy
      • Envisionit Deep AI (Pty) Ltd.
        • Overview
        • Product Portfolio
        • Profitability by Market Segments
        • Sales Footprint
        • Strategy Overview
          • Marketing Strategy
          • Product Strategy
          • Channel Strategy
      • Human Bytes
        • Overview
        • Product Portfolio
        • Profitability by Market Segments
        • Sales Footprint
        • Strategy Overview
          • Marketing Strategy
          • Product Strategy
          • Channel Strategy
      • Planmed Oy
        • Overview
        • Product Portfolio
        • Profitability by Market Segments
        • Sales Footprint
        • Strategy Overview
          • Marketing Strategy
          • Product Strategy
          • Channel Strategy
      • Analogic Corporation
        • Overview
        • Product Portfolio
        • Profitability by Market Segments
        • Sales Footprint
        • Strategy Overview
          • Marketing Strategy
          • Product Strategy
          • Channel Strategy
      • GE HealthCare
        • Overview
        • Product Portfolio
        • Profitability by Market Segments
        • Sales Footprint
        • Strategy Overview
          • Marketing Strategy
          • Product Strategy
          • Channel Strategy
      • Koninklijke Philips N.V.
        • Overview
        • Product Portfolio
        • Profitability by Market Segments
        • Sales Footprint
        • Strategy Overview
          • Marketing Strategy
          • Product Strategy
          • Channel Strategy
      • Esaote SPA
        • Overview
        • Product Portfolio
        • Profitability by Market Segments
        • Sales Footprint
        • Strategy Overview
          • Marketing Strategy
          • Product Strategy
          • Channel Strategy
  22. Assumptions & Acronyms Used
  23. Research Methodology

List of Tables

  • Table 1: Global Market Value (USD Million) Forecast by Region, 2020-2035
  • Table 2: Global Market Value (USD Million) Forecast by Type, 2020-2035
  • Table 3: Global Market Value (USD Million) Forecast by Imaging Technology, 2020-2035
  • Table 4: Global Market Value (USD Million) Forecast by Application, 2020-2035
  • Table 5: Global Market Value (USD Million) Forecast by End User, 2020-2035
  • Table 6: North America Market Value (USD Million) Forecast by Country, 2020-2035
  • Table 7: North America Market Value (USD Million) Forecast by Type, 2020-2035
  • Table 8: North America Market Value (USD Million) Forecast by Imaging Technology, 2020-2035
  • Table 9: North America Market Value (USD Million) Forecast by Application, 2020-2035
  • Table 10: North America Market Value (USD Million) Forecast by End User, 2020-2035
  • Table 11: Latin America Market Value (USD Million) Forecast by Country, 2020-2035
  • Table 12: Latin America Market Value (USD Million) Forecast by Type, 2020-2035
  • Table 13: Latin America Market Value (USD Million) Forecast by Imaging Technology, 2020-2035
  • Table 14: Latin America Market Value (USD Million) Forecast by Application, 2020-2035
  • Table 15: Latin America Market Value (USD Million) Forecast by End User, 2020-2035
  • Table 16: Western Europe Market Value (USD Million) Forecast by Country, 2020-2035
  • Table 17: Western Europe Market Value (USD Million) Forecast by Type, 2020-2035
  • Table 18: Western Europe Market Value (USD Million) Forecast by Imaging Technology, 2020-2035
  • Table 19: Western Europe Market Value (USD Million) Forecast by Application, 2020-2035
  • Table 20: Western Europe Market Value (USD Million) Forecast by End User, 2020-2035
  • Table 21: Eastern Europe Market Value (USD Million) Forecast by Country, 2020-2035
  • Table 22: Eastern Europe Market Value (USD Million) Forecast by Type, 2020-2035
  • Table 23: Eastern Europe Market Value (USD Million) Forecast by Imaging Technology, 2020-2035
  • Table 24: Eastern Europe Market Value (USD Million) Forecast by Application, 2020-2035
  • Table 25: Eastern Europe Market Value (USD Million) Forecast by End User, 2020-2035
  • Table 26: East Asia Market Value (USD Million) Forecast by Country, 2020-2035
  • Table 27: East Asia Market Value (USD Million) Forecast by Type, 2020-2035
  • Table 28: East Asia Market Value (USD Million) Forecast by Imaging Technology, 2020-2035
  • Table 29: East Asia Market Value (USD Million) Forecast by Application, 2020-2035
  • Table 30: East Asia Market Value (USD Million) Forecast by End User, 2020-2035
  • Table 31: South Asia Market Value (USD Million) Forecast by Country, 2020-2035
  • Table 32: South Asia Market Value (USD Million) Forecast by Type, 2020-2035
  • Table 33: South Asia Market Value (USD Million) Forecast by Imaging Technology, 2020-2035
  • Table 34: South Asia Market Value (USD Million) Forecast by Application, 2020-2035
  • Table 35: South Asia Market Value (USD Million) Forecast by End User, 2020-2035
  • Table 36: MEA Market Value (USD Million) Forecast by Country, 2020-2035
  • Table 37: MEA Market Value (USD Million) Forecast by Type, 2020-2035
  • Table 38: MEA Market Value (USD Million) Forecast by Imaging Technology, 2020-2035
  • Table 39: MEA Market Value (USD Million) Forecast by Application, 2020-2035
  • Table 40: MEA Market Value (USD Million) Forecast by End User, 2020-2035

List of Figures

  • Figure 1: Global Market Value (USD Million) by Type, 2025 to 2035
  • Figure 2: Global Market Value (USD Million) by Imaging Technology, 2025 to 2035
  • Figure 3: Global Market Value (USD Million) by Application, 2025 to 2035
  • Figure 4: Global Market Value (USD Million) by End User, 2025 to 2035
  • Figure 5: Global Market Value (USD Million) by Region, 2025 to 2035
  • Figure 6: Global Market Value (USD Million) Analysis by Region, 2020 to 2035
  • Figure 7: Global Market Value Share (%) and BPS Analysis by Region, 2025 to 2035
  • Figure 8: Global Market Y-o-Y Growth (%) Projections by Region, 2025 to 2035
  • Figure 9: Global Market Value (USD Million) Analysis by Type, 2020 to 2035
  • Figure 10: Global Market Value Share (%) and BPS Analysis by Type, 2025 to 2035
  • Figure 11: Global Market Y-o-Y Growth (%) Projections by Type, 2025 to 2035
  • Figure 12: Global Market Value (USD Million) Analysis by Imaging Technology, 2020 to 2035
  • Figure 13: Global Market Value Share (%) and BPS Analysis by Imaging Technology, 2025 to 2035
  • Figure 14: Global Market Y-o-Y Growth (%) Projections by Imaging Technology, 2025 to 2035
  • Figure 15: Global Market Value (USD Million) Analysis by Application, 2020 to 2035
  • Figure 16: Global Market Value Share (%) and BPS Analysis by Application, 2025 to 2035
  • Figure 17: Global Market Y-o-Y Growth (%) Projections by Application, 2025 to 2035
  • Figure 18: Global Market Value (USD Million) Analysis by End User, 2020 to 2035
  • Figure 19: Global Market Value Share (%) and BPS Analysis by End User, 2025 to 2035
  • Figure 20: Global Market Y-o-Y Growth (%) Projections by End User, 2025 to 2035
  • Figure 21: Global Market Attractiveness by Type, 2025 to 2035
  • Figure 22: Global Market Attractiveness by Imaging Technology, 2025 to 2035
  • Figure 23: Global Market Attractiveness by Application, 2025 to 2035
  • Figure 24: Global Market Attractiveness by End User, 2025 to 2035
  • Figure 25: Global Market Attractiveness by Region, 2025 to 2035
  • Figure 26: North America Market Value (USD Million) by Type, 2025 to 2035
  • Figure 27: North America Market Value (USD Million) by Imaging Technology, 2025 to 2035
  • Figure 28: North America Market Value (USD Million) by Application, 2025 to 2035
  • Figure 29: North America Market Value (USD Million) by End User, 2025 to 2035
  • Figure 30: North America Market Value (USD Million) by Country, 2025 to 2035
  • Figure 31: North America Market Value (USD Million) Analysis by Country, 2020 to 2035
  • Figure 32: North America Market Value Share (%) and BPS Analysis by Country, 2025 to 2035
  • Figure 33: North America Market Y-o-Y Growth (%) Projections by Country, 2025 to 2035
  • Figure 34: North America Market Value (USD Million) Analysis by Type, 2020 to 2035
  • Figure 35: North America Market Value Share (%) and BPS Analysis by Type, 2025 to 2035
  • Figure 36: North America Market Y-o-Y Growth (%) Projections by Type, 2025 to 2035
  • Figure 37: North America Market Value (USD Million) Analysis by Imaging Technology, 2020 to 2035
  • Figure 38: North America Market Value Share (%) and BPS Analysis by Imaging Technology, 2025 to 2035
  • Figure 39: North America Market Y-o-Y Growth (%) Projections by Imaging Technology, 2025 to 2035
  • Figure 40: North America Market Value (USD Million) Analysis by Application, 2020 to 2035
  • Figure 41: North America Market Value Share (%) and BPS Analysis by Application, 2025 to 2035
  • Figure 42: North America Market Y-o-Y Growth (%) Projections by Application, 2025 to 2035
  • Figure 43: North America Market Value (USD Million) Analysis by End User, 2020 to 2035
  • Figure 44: North America Market Value Share (%) and BPS Analysis by End User, 2025 to 2035
  • Figure 45: North America Market Y-o-Y Growth (%) Projections by End User, 2025 to 2035
  • Figure 46: North America Market Attractiveness by Type, 2025 to 2035
  • Figure 47: North America Market Attractiveness by Imaging Technology, 2025 to 2035
  • Figure 48: North America Market Attractiveness by Application, 2025 to 2035
  • Figure 49: North America Market Attractiveness by End User, 2025 to 2035
  • Figure 50: North America Market Attractiveness by Country, 2025 to 2035
  • Figure 51: Latin America Market Value (USD Million) by Type, 2025 to 2035
  • Figure 52: Latin America Market Value (USD Million) by Imaging Technology, 2025 to 2035
  • Figure 53: Latin America Market Value (USD Million) by Application, 2025 to 2035
  • Figure 54: Latin America Market Value (USD Million) by End User, 2025 to 2035
  • Figure 55: Latin America Market Value (USD Million) by Country, 2025 to 2035
  • Figure 56: Latin America Market Value (USD Million) Analysis by Country, 2020 to 2035
  • Figure 57: Latin America Market Value Share (%) and BPS Analysis by Country, 2025 to 2035
  • Figure 58: Latin America Market Y-o-Y Growth (%) Projections by Country, 2025 to 2035
  • Figure 59: Latin America Market Value (USD Million) Analysis by Type, 2020 to 2035
  • Figure 60: Latin America Market Value Share (%) and BPS Analysis by Type, 2025 to 2035
  • Figure 61: Latin America Market Y-o-Y Growth (%) Projections by Type, 2025 to 2035
  • Figure 62: Latin America Market Value (USD Million) Analysis by Imaging Technology, 2020 to 2035
  • Figure 63: Latin America Market Value Share (%) and BPS Analysis by Imaging Technology, 2025 to 2035
  • Figure 64: Latin America Market Y-o-Y Growth (%) Projections by Imaging Technology, 2025 to 2035
  • Figure 65: Latin America Market Value (USD Million) Analysis by Application, 2020 to 2035
  • Figure 66: Latin America Market Value Share (%) and BPS Analysis by Application, 2025 to 2035
  • Figure 67: Latin America Market Y-o-Y Growth (%) Projections by Application, 2025 to 2035
  • Figure 68: Latin America Market Value (USD Million) Analysis by End User, 2020 to 2035
  • Figure 69: Latin America Market Value Share (%) and BPS Analysis by End User, 2025 to 2035
  • Figure 70: Latin America Market Y-o-Y Growth (%) Projections by End User, 2025 to 2035
  • Figure 71: Latin America Market Attractiveness by Type, 2025 to 2035
  • Figure 72: Latin America Market Attractiveness by Imaging Technology, 2025 to 2035
  • Figure 73: Latin America Market Attractiveness by Application, 2025 to 2035
  • Figure 74: Latin America Market Attractiveness by End User, 2025 to 2035
  • Figure 75: Latin America Market Attractiveness by Country, 2025 to 2035
  • Figure 76: Western Europe Market Value (USD Million) by Type, 2025 to 2035
  • Figure 77: Western Europe Market Value (USD Million) by Imaging Technology, 2025 to 2035
  • Figure 78: Western Europe Market Value (USD Million) by Application, 2025 to 2035
  • Figure 79: Western Europe Market Value (USD Million) by End User, 2025 to 2035
  • Figure 80: Western Europe Market Value (USD Million) by Country, 2025 to 2035
  • Figure 81: Western Europe Market Value (USD Million) Analysis by Country, 2020 to 2035
  • Figure 82: Western Europe Market Value Share (%) and BPS Analysis by Country, 2025 to 2035
  • Figure 83: Western Europe Market Y-o-Y Growth (%) Projections by Country, 2025 to 2035
  • Figure 84: Western Europe Market Value (USD Million) Analysis by Type, 2020 to 2035
  • Figure 85: Western Europe Market Value Share (%) and BPS Analysis by Type, 2025 to 2035
  • Figure 86: Western Europe Market Y-o-Y Growth (%) Projections by Type, 2025 to 2035
  • Figure 87: Western Europe Market Value (USD Million) Analysis by Imaging Technology, 2020 to 2035
  • Figure 88: Western Europe Market Value Share (%) and BPS Analysis by Imaging Technology, 2025 to 2035
  • Figure 89: Western Europe Market Y-o-Y Growth (%) Projections by Imaging Technology, 2025 to 2035
  • Figure 90: Western Europe Market Value (USD Million) Analysis by Application, 2020 to 2035
  • Figure 91: Western Europe Market Value Share (%) and BPS Analysis by Application, 2025 to 2035
  • Figure 92: Western Europe Market Y-o-Y Growth (%) Projections by Application, 2025 to 2035
  • Figure 93: Western Europe Market Value (USD Million) Analysis by End User, 2020 to 2035
  • Figure 94: Western Europe Market Value Share (%) and BPS Analysis by End User, 2025 to 2035
  • Figure 95: Western Europe Market Y-o-Y Growth (%) Projections by End User, 2025 to 2035
  • Figure 96: Western Europe Market Attractiveness by Type, 2025 to 2035
  • Figure 97: Western Europe Market Attractiveness by Imaging Technology, 2025 to 2035
  • Figure 98: Western Europe Market Attractiveness by Application, 2025 to 2035
  • Figure 99: Western Europe Market Attractiveness by End User, 2025 to 2035
  • Figure 100: Western Europe Market Attractiveness by Country, 2025 to 2035
  • Figure 101: Eastern Europe Market Value (USD Million) by Type, 2025 to 2035
  • Figure 102: Eastern Europe Market Value (USD Million) by Imaging Technology, 2025 to 2035
  • Figure 103: Eastern Europe Market Value (USD Million) by Application, 2025 to 2035
  • Figure 104: Eastern Europe Market Value (USD Million) by End User, 2025 to 2035
  • Figure 105: Eastern Europe Market Value (USD Million) by Country, 2025 to 2035
  • Figure 106: Eastern Europe Market Value (USD Million) Analysis by Country, 2020 to 2035
  • Figure 107: Eastern Europe Market Value Share (%) and BPS Analysis by Country, 2025 to 2035
  • Figure 108: Eastern Europe Market Y-o-Y Growth (%) Projections by Country, 2025 to 2035
  • Figure 109: Eastern Europe Market Value (USD Million) Analysis by Type, 2020 to 2035
  • Figure 110: Eastern Europe Market Value Share (%) and BPS Analysis by Type, 2025 to 2035
  • Figure 111: Eastern Europe Market Y-o-Y Growth (%) Projections by Type, 2025 to 2035
  • Figure 112: Eastern Europe Market Value (USD Million) Analysis by Imaging Technology, 2020 to 2035
  • Figure 113: Eastern Europe Market Value Share (%) and BPS Analysis by Imaging Technology, 2025 to 2035
  • Figure 114: Eastern Europe Market Y-o-Y Growth (%) Projections by Imaging Technology, 2025 to 2035
  • Figure 115: Eastern Europe Market Value (USD Million) Analysis by Application, 2020 to 2035
  • Figure 116: Eastern Europe Market Value Share (%) and BPS Analysis by Application, 2025 to 2035
  • Figure 117: Eastern Europe Market Y-o-Y Growth (%) Projections by Application, 2025 to 2035
  • Figure 118: Eastern Europe Market Value (USD Million) Analysis by End User, 2020 to 2035
  • Figure 119: Eastern Europe Market Value Share (%) and BPS Analysis by End User, 2025 to 2035
  • Figure 120: Eastern Europe Market Y-o-Y Growth (%) Projections by End User, 2025 to 2035
  • Figure 121: Eastern Europe Market Attractiveness by Type, 2025 to 2035
  • Figure 122: Eastern Europe Market Attractiveness by Imaging Technology, 2025 to 2035
  • Figure 123: Eastern Europe Market Attractiveness by Application, 2025 to 2035
  • Figure 124: Eastern Europe Market Attractiveness by End User, 2025 to 2035
  • Figure 125: Eastern Europe Market Attractiveness by Country, 2025 to 2035
  • Figure 126: East Asia Market Value (USD Million) by Type, 2025 to 2035
  • Figure 127: East Asia Market Value (USD Million) by Imaging Technology, 2025 to 2035
  • Figure 128: East Asia Market Value (USD Million) by Application, 2025 to 2035
  • Figure 129: East Asia Market Value (USD Million) by End User, 2025 to 2035
  • Figure 130: East Asia Market Value (USD Million) by Country, 2025 to 2035
  • Figure 131: East Asia Market Value (USD Million) Analysis by Country, 2020 to 2035
  • Figure 132: East Asia Market Value Share (%) and BPS Analysis by Country, 2025 to 2035
  • Figure 133: East Asia Market Y-o-Y Growth (%) Projections by Country, 2025 to 2035
  • Figure 134: East Asia Market Value (USD Million) Analysis by Type, 2020 to 2035
  • Figure 135: East Asia Market Value Share (%) and BPS Analysis by Type, 2025 to 2035
  • Figure 136: East Asia Market Y-o-Y Growth (%) Projections by Type, 2025 to 2035
  • Figure 137: East Asia Market Value (USD Million) Analysis by Imaging Technology, 2020 to 2035
  • Figure 138: East Asia Market Value Share (%) and BPS Analysis by Imaging Technology, 2025 to 2035
  • Figure 139: East Asia Market Y-o-Y Growth (%) Projections by Imaging Technology, 2025 to 2035
  • Figure 140: East Asia Market Value (USD Million) Analysis by Application, 2020 to 2035
  • Figure 141: East Asia Market Value Share (%) and BPS Analysis by Application, 2025 to 2035
  • Figure 142: East Asia Market Y-o-Y Growth (%) Projections by Application, 2025 to 2035
  • Figure 143: East Asia Market Value (USD Million) Analysis by End User, 2020 to 2035
  • Figure 144: East Asia Market Value Share (%) and BPS Analysis by End User, 2025 to 2035
  • Figure 145: East Asia Market Y-o-Y Growth (%) Projections by End User, 2025 to 2035
  • Figure 146: East Asia Market Attractiveness by Type, 2025 to 2035
  • Figure 147: East Asia Market Attractiveness by Imaging Technology, 2025 to 2035
  • Figure 148: East Asia Market Attractiveness by Application, 2025 to 2035
  • Figure 149: East Asia Market Attractiveness by End User, 2025 to 2035
  • Figure 150: East Asia Market Attractiveness by Country, 2025 to 2035
  • Figure 151: South Asia Market Value (USD Million) by Type, 2025 to 2035
  • Figure 152: South Asia Market Value (USD Million) by Imaging Technology, 2025 to 2035
  • Figure 153: South Asia Market Value (USD Million) by Application, 2025 to 2035
  • Figure 154: South Asia Market Value (USD Million) by End User, 2025 to 2035
  • Figure 155: South Asia Market Value (USD Million) by Country, 2025 to 2035
  • Figure 156: South Asia Market Value (USD Million) Analysis by Country, 2020 to 2035
  • Figure 157: South Asia Market Value Share (%) and BPS Analysis by Country, 2025 to 2035
  • Figure 158: South Asia Market Y-o-Y Growth (%) Projections by Country, 2025 to 2035
  • Figure 159: South Asia Market Value (USD Million) Analysis by Type, 2020 to 2035
  • Figure 160: South Asia Market Value Share (%) and BPS Analysis by Type, 2025 to 2035
  • Figure 161: South Asia Market Y-o-Y Growth (%) Projections by Type, 2025 to 2035
  • Figure 162: South Asia Market Value (USD Million) Analysis by Imaging Technology, 2020 to 2035
  • Figure 163: South Asia Market Value Share (%) and BPS Analysis by Imaging Technology, 2025 to 2035
  • Figure 164: South Asia Market Y-o-Y Growth (%) Projections by Imaging Technology, 2025 to 2035
  • Figure 165: South Asia Market Value (USD Million) Analysis by Application, 2020 to 2035
  • Figure 166: South Asia Market Value Share (%) and BPS Analysis by Application, 2025 to 2035
  • Figure 167: South Asia Market Y-o-Y Growth (%) Projections by Application, 2025 to 2035
  • Figure 168: South Asia Market Value (USD Million) Analysis by End User, 2020 to 2035
  • Figure 169: South Asia Market Value Share (%) and BPS Analysis by End User, 2025 to 2035
  • Figure 170: South Asia Market Y-o-Y Growth (%) Projections by End User, 2025 to 2035
  • Figure 171: South Asia Market Attractiveness by Type, 2025 to 2035
  • Figure 172: South Asia Market Attractiveness by Imaging Technology, 2025 to 2035
  • Figure 173: South Asia Market Attractiveness by Application, 2025 to 2035
  • Figure 174: South Asia Market Attractiveness by End User, 2025 to 2035
  • Figure 175: South Asia Market Attractiveness by Country, 2025 to 2035
  • Figure 176: MEA Market Value (USD Million) by Type, 2025 to 2035
  • Figure 177: MEA Market Value (USD Million) by Imaging Technology, 2025 to 2035
  • Figure 178: MEA Market Value (USD Million) by Application, 2025 to 2035
  • Figure 179: MEA Market Value (USD Million) by End User, 2025 to 2035
  • Figure 180: MEA Market Value (USD Million) by Country, 2025 to 2035
  • Figure 181: MEA Market Value (USD Million) Analysis by Country, 2020 to 2035
  • Figure 182: MEA Market Value Share (%) and BPS Analysis by Country, 2025 to 2035
  • Figure 183: MEA Market Y-o-Y Growth (%) Projections by Country, 2025 to 2035
  • Figure 184: MEA Market Value (USD Million) Analysis by Type, 2020 to 2035
  • Figure 185: MEA Market Value Share (%) and BPS Analysis by Type, 2025 to 2035
  • Figure 186: MEA Market Y-o-Y Growth (%) Projections by Type, 2025 to 2035
  • Figure 187: MEA Market Value (USD Million) Analysis by Imaging Technology, 2020 to 2035
  • Figure 188: MEA Market Value Share (%) and BPS Analysis by Imaging Technology, 2025 to 2035
  • Figure 189: MEA Market Y-o-Y Growth (%) Projections by Imaging Technology, 2025 to 2035
  • Figure 190: MEA Market Value (USD Million) Analysis by Application, 2020 to 2035
  • Figure 191: MEA Market Value Share (%) and BPS Analysis by Application, 2025 to 2035
  • Figure 192: MEA Market Y-o-Y Growth (%) Projections by Application, 2025 to 2035
  • Figure 193: MEA Market Value (USD Million) Analysis by End User, 2020 to 2035
  • Figure 194: MEA Market Value Share (%) and BPS Analysis by End User, 2025 to 2035
  • Figure 195: MEA Market Y-o-Y Growth (%) Projections by End User, 2025 to 2035
  • Figure 196: MEA Market Attractiveness by Type, 2025 to 2035
  • Figure 197: MEA Market Attractiveness by Imaging Technology, 2025 to 2035
  • Figure 198: MEA Market Attractiveness by Application, 2025 to 2035
  • Figure 199: MEA Market Attractiveness by End User, 2025 to 2035
  • Figure 200: MEA Market Attractiveness by Country, 2025 to 2035

Frequently Asked Questions

How big is the Global AI enhanced Mammography Screening Market in 2025?

The global AI enhanced mammography screening market is estimated to be valued at USD 159.6 million in 2025.

What will be the size of the Global AI enhanced Mammography Screening Market in 2035?

The market size for the global AI enhanced mammography screening market is projected to reach approximately USD 364.19 million by 2035.

How much will the Global AI enhanced Mammography Screening Market grow between 2025 and 2035?

The global AI enhanced mammography screening market is expected to grow at a CAGR of 8.6% between 2025 and 2035.

What are the key types in the Global AI enhanced Mammography Screening Market?

The key types in the global AI enhanced mammography screening market include Computer-Aided Detection (CADe), Computer-Aided Diagnosis (CADx), Deep Learning-Based Tools, Hybrid AI Solutions, Risk Assessment & Breast Density Tools and others.

Which Imaging Technology type segment will contribute a significant share in the Global AI enhanced Mammography Screening Market in 2025?

In terms Imaging Technology, 2D Digital Mammography (FFDM) is projected to command the highest share at 41.7% in the global AI enhanced mammography screening market in 2025

Explore Similar Insights

Future Market Insights

AI enhanced Mammography Screening Market

Chat With

MaRIA

Hi There, I am MaRIA, Your Market Research Intelligence Assistant. How may I help you?