Autonomous AI Powered Ophthalmology Screening Market Size and Share Forecast Outlook 2025 to 2035

The Global Autonomous AI Powered Ophthalmology Screening Market has been forecasted to attain a valuation of USD 1,130.0 million in 2025, rising to USD 2,650.68 million by 2035, resulting in an incremental gain of USD 1,520.68 million, which reflects a 42.6% increase over the forecast decade. A compound annual growth rate (CAGR) of 8.9% is expected to be recorded, indicating a rapid expansion trajectory for the Global Autonomous AI Powered Ophthalmology Screening Market.
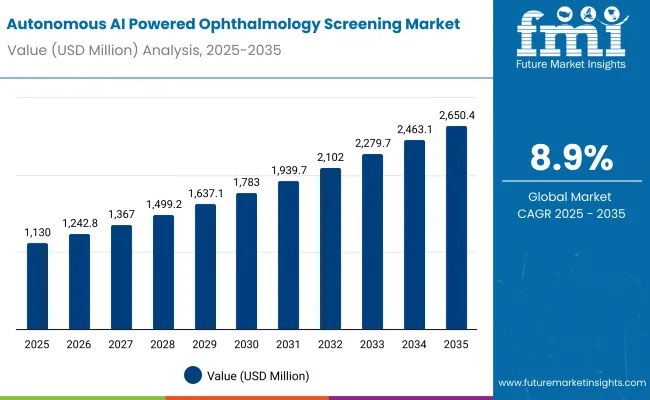
Autonomous Ai Powered Ophthalmology Screening Market

Global Autonomous AI Powered Ophthalmology Screening Market Key Takeaways

Metric Value
Global Autonomous AI Powered Ophthalmology Screening Market Estimated Value in (2025E) USD 1,130.0 million
Global Autonomous AI Powered Ophthalmology Screening Market Forecast Value in (2035F) USD 2,650.68 million
Forecast CAGR (2025 to 2035) 8.9 %

Between 2025 and 2030, autonomous AI-powered ophthalmology screening is expected to see broader adoption across hospitals, diagnostic centers, and telemedicine platforms, as ophthalmologists and healthcare providers increasingly rely on AI-driven retinal imaging to detect diabetic retinopathy, glaucoma, and age-related macular degeneration.

It will grow upto USD 600.7 million in that period from USD 1,130.0 million in 2025 to USD 1,730.7 million in 2030. Advances in cloud-based analytics, user-friendly interfaces, and portable imaging devices are making these systems more accessible, driving adoption even in mid-tier clinics and rural healthcare settings.

Between 2030 and 2035, the market is projected to expand further by USD 920.0million, driven by next-generation AI algorithms capable of multi-disease screening, predictive analytics, and personalized risk assessment. Rising adoption by national health programs and large healthcare networks will further accelerate growth. Continuous innovation in high-resolution imaging sensors, AI interpretability, and real-time patient reporting will define the next generation of ophthalmology screening solutions.

From 2020 to 2024, the Global Autonomous AI Powered Ophthalmology Screening Market, expanded from USD 717.1 million to USD 1,047.5 million, maturing through the increased availability of compact, lab-based, and portable AI screening devices.

During this phase, global medical device manufacturers collaborated with hospitals and research institutions to optimize image acquisition, streamline AI integration, and improve diagnostic accuracy laying the groundwork for broader adoption in both clinical and remote healthcare settings.

The autonomous AI-powered ophthalmology screening ecosystem is likely to evolve with features like cloud-enabled population screening, real-time teleconsultation, and integration with electronic health records (EHR). These advancements aim to reduce clinician workload, improve early detection rates, and expand accessibility, positioning AI-driven ophthalmology screening as a standard tool in preventative eye care worldwide.

Why the Global Autonomous AI Powered Ophthalmology Screening Market is growing?

The growth of the Global Autonomous AI-Powered Ophthalmology Screening Marketis driven by the ability of these systems to deliver rapid, accurate, and scalable eye disease detection particularly for conditions such as diabetic retinopathy, glaucoma, and age-related macular degeneration. Unlike traditional manual screening conducted by ophthalmologists, AI-powered platforms provide automated, high-throughput analysis of retinal images, enabling earlier diagnosis and reducing the burden on clinical staff.

Over the last few years, the adoption of AI-based ophthalmology screening has expanded beyond specialized clinics and hospitals. Increasing integration into primary care and community health settings allows broad-scale preventive screening, particularly in regions with limited access to eye care specialists. These systems utilize advanced deep learning algorithms capable of detecting subtle pathological features, improving diagnostic accuracy and patient outcomes.

Another factor accelerating market growth is the regulatory approval of autonomous AI systems, such as FDA-cleared platforms, which legitimizes their clinical use and encourages wider adoption. Concurrently, the availability of portable and cloud-connected retinal imaging devices enables deployment in remote and resource-constrained environments, democratizing access to eye care.

Moreover, rising prevalence of diabetes, aging populations, and increased awareness of vision health are driving demand for routine and early ophthalmic screening. This trend, combined with continuous improvements in AI model performance and integration with electronic health record systems, is fostering widespread adoption among healthcare providers.

Collectively, these technological, regulatory, and demographic drivers are positioning the autonomous AI-powered ophthalmology screening market for robust growth, as it becomes an essential tool for scalable, cost-effective, and preventive eye care worldwide.

Segmental Analysis

The market is segmented by technology, indication, and end user. Technology includes Image-Based AI (Fundus), OCT-Based AI, Multi-Modal AI, Edge AI, Cloud-Based AI, and Embedded AI in Cameras. By indication, the market covers Diabetic Retinopathy (DR), Age-related Macular Degeneration (AMD), Glaucoma, Cataract, and Retinopathy of Prematurity (ROP).

Based on end user, the segmentation includes Primary Care Clinics, Ophthalmology Clinics, Mobile Clinics / Rural Camps, Hospitals & Tertiary Centers, and Others. Regionally, the scope spans North America, Latin America, Western and Eastern Europe, East Asia, South Asia and Pacific, and the Middle East and Africa.
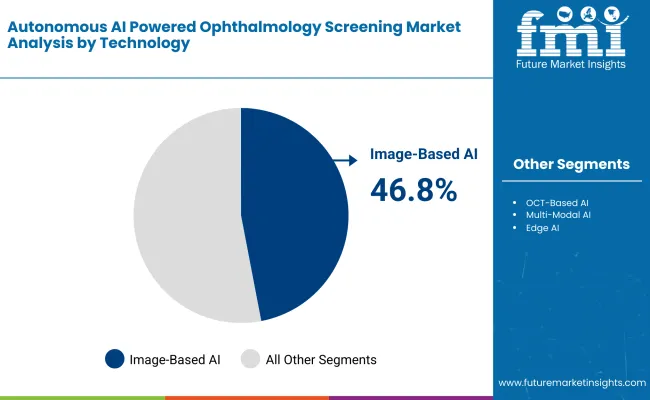
Insights into the Technology Segment with Image-Based AI (Fundus) Leading the Demand

Autonomous Ai Powered Ophthalmology Screening Market By Technology

Technology Market Value Share, 2025
Image-Based AI (Fundus) 46.8%
OCT-Based AI 12.0%
Multi-Modal AI 6.1%
Edge AI 11.8%
Cloud-Based AI 19.0%
Embedded AI in Cameras 4.3%

Image-Based AI (Fundus) Systems are projected to lead the technology category with a 46.8% market share in 2025, and are expected to maintain this position due to their ability to deliver high-accuracy retinal imaging and automated disease detection in clinical and screening environments. Unlike OCT-based or multi-modal AI systems, image-based AI leverages large datasets of fundus images to detect subtle pathological changes, enabling early diagnosis of conditions such as diabetic retinopathy, glaucoma, and age-related macular degeneration.

Recent advances in deep learning architectures, combined with high-resolution fundus cameras and optimized preprocessing pipelines, have enhanced the sensitivity and specificity of these systems to near-human expert levels. Integration with cloud platforms and electronic health records allows for real-time analytics, longitudinal patient monitoring, and seamless tele-ophthalmology workflows making these systems indispensable for large-scale vision care programs.

A key factor behind their dominance is the growing adoption in hospitals, diagnostic labs, and community screening programs. With commercial vendors offering turnkey solutions that require minimal technical expertise, image-based AI is becoming accessible to non-specialist clinics and rural healthcare setups. Their relatively low cost of deployment and minimal infrastructure demands further position them as the preferred platform for automated retinal assessment.

As eye care continues to attract cross-disciplinary interest from AI, biomedical, and public health sectors, the combination of accuracy, scalability, and ease of integration ensures that image-based AI (fundus) remains the backbone of modern ophthalmic diagnostics across clinical and research settings.
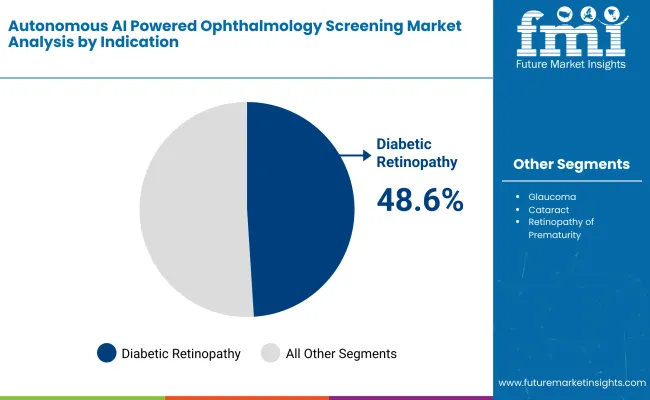
Insights into the Indication Segment with Diabetic Retinopathy (DR) Dominating the Market

Autonomous Ai Powered Ophthalmology Screening Market By Indication

Indication Market Value Share, 2025
Diabetic Retinopathy (DR) 48.6%
Age-related Macular Degeneration (AMD) 23.9%
Glaucoma 16.0%
Cataract 6.7%
Retinopathy of Prematurity (ROP) 4.8%

Diabetic Retinopathy (DR) continues to dominate the indication landscape, accounting for nearly half of the total market value in 2025 with a 48.6% share. This condition remains a primary focus for ophthalmic screening and intervention due to its high prevalence among diabetic populations and its potential to cause irreversible vision loss if untreated. DR detection and management rely heavily on advanced imaging and diagnostic modalities, which have become standard practice in both clinical and research settings.

The prominence of DR in the market is driven by widespread adoption of screening programs, increasing awareness among patients and healthcare providers, and strong investment in diagnostic technologies. The condition’s chronic nature and the need for routine monitoring make it a consistent and high-value segment for medical device and imaging companies.

Other indications such as Age-related Macular Degeneration (AMD), Glaucoma, Cataract, and Retinopathy of Prematurity (ROP) represent smaller but growing portions of the market. While these segments benefit from technological advancements in imaging and treatment, they lack the same volume-driven demand seen with DR.

The diabetic retinopathy segment remains irreplaceable in the ophthalmology market due to its combination of high prevalence, frequent monitoring requirements, and integration into standardized clinical workflows. Continued innovation in imaging resolution, AI-based diagnostics, and telemedicine solutions is expected to further strengthen DR’s market position, ensuring sustained investment and adoption across global healthcare systems.

What are the Drivers, Restraints, and Key Trends of the Global Autonomous AI Powered Ophthalmology Screening Market?

The adoption of autonomous AI-powered ophthalmology screening solutions is accelerating as healthcare providers and technology developers converge to address rising rates of eye disorders and improve diagnostic efficiency. While market momentum is strong, the sector faces structural challenges linked to regulatory compliance, infrastructure, and operator expertise.

Growing Role in Early Detection and Preventive Eye CareAI-powered screening systems are becoming essential in the detection of diabetic retinopathy, glaucoma, and other vision-threatening conditions. These solutions allow clinicians to identify early-stage disease with speed and accuracy that conventional methods cannot match.

Hospitals, primary care clinics, and telemedicine providers are increasingly deploying AI-based workflows to validate diagnoses, monitor patient outcomes, and reduce the burden on ophthalmologists. As telehealth adoption expands, autonomous screening is becoming a standard part of routine eye care.

Shift Toward Compact and Point-of-Care AI Screening DevicesThe market is expanding as manufacturers introduce portable, turnkey systems that fit into a variety of clinical settings. These devices combine high-resolution retinal imaging with AI analysis in real time, enabling even minimally trained staff to conduct screenings effectively.

Integration with cloud-based analytics, automated referral workflows, and user-friendly interfaces allows smaller clinics and community health centers to implement high-quality screening without large-scale infrastructure investment. Countries investing in preventive healthcare programs are equipping clinics and schools with AI screening setups, extending access far beyond traditional hospital environments.

Regulatory, Data, and Training ConstraintsAI ophthalmology screening requires adherence to strict medical device regulations, robust data privacy measures, and clinical validation. Operators still need training to acquire reliable images and interpret AI-generated reports, creating a learning curve for widespread deployment.

These factors limit adoption in routine practice settings, particularly in regions with constrained healthcare infrastructure. Without proper oversight and skilled handling, even advanced systems risk underutilization. Regulatory and operational complexities remain key restraints on market growth, despite strong technological momentum.
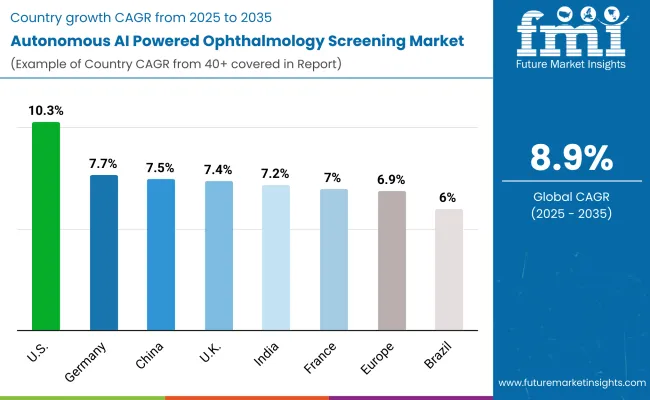
Analysis of Global Autonomous AI Powered Ophthalmology Screening Market, By Key Countries

Autonomous Ai Powered Ophthalmology Screening Market Country Wise Analysis

Country CAGR
USA 10.3%
Brazil 6.0%
China 7.5%
India 7.2%
Europe 6.9%
Germany 7.7%
France 7.0%
UK 7.4 %

The adoption and growth patterns of autonomous AI-powered ophthalmology screening systems vary significantly across regions, largely shaped by healthcare infrastructure maturity, government initiatives, and the prevalence of ophthalmic disorders.

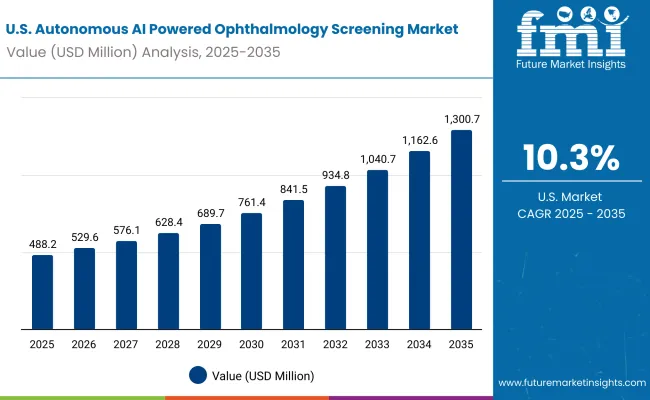
The USA market is witnessing strong growth, fueled by widespread adoption in hospitals, eye care clinics, and diagnostic centers. Significant investment in AI-driven healthcare technologies, coupled with a focus on early detection of vision disorders, accelerates deployment. Supportive regulatory frameworks and collaboration between technology providers and academic medical centers further strengthen adoption. The market in the USA is projected to grow at a CAGR of 10.3%, reflecting robust demand for AI-enabled diagnostic efficiency and improved patient outcomes.

In Europe, countries such as Germany, France, and the UK are at the forefront of adopting autonomous AI-powered ophthalmology screening systems, driven by national healthcare digitization initiatives, investments in AI-enabled diagnostics, and collaboration between hospitals and technology providers.

Government-backed programs promoting telemedicine and AI integration in public health services have facilitated large-scale deployments, enabling use of autonomous screening technologies for early detection of diabetic retinopathy, glaucoma, and other ocular diseases.

Regulatory support for AI healthcare solutions and strategic funding foster sustained market growth, though adoption in some regions remains measured as healthcare providers continue validating clinical efficacy. The market in Germany is expected to grow at a CAGR of 7.7%, France at 7.0%, and the UK at 7.4%.

Overall, the global autonomous AI-powered ophthalmology screening market reflects a strategic blend of technological innovation, healthcare policy alignment, and institutional investment, which collectively govern the pace and scale of adoption across different countries. This dynamic interplay underscores the central role that regional healthcare infrastructure, government initiatives, and clinical expertise play in shaping the trajectory of this rapidly evolving diagnostic technology market.
Sales Outlook for Global Autonomous AI Powered Ophthalmology Screening in the United States

Usa Autonomous Ai Powered Ophthalmology Screening Market

The market for autonomous AI-powered ophthalmology screening in the United States is projected to grow at a CAGR of 10.3% between 2025 and 2035. The USA remains the largest and most technologically advanced market for AI-driven eye care solutions, driven by high prevalence of diabetic retinopathy, glaucoma, and age-related macular degeneration, alongside robust healthcare infrastructure and insurance coverage. Leading academic medical centers such as Johns Hopkins, Mayo Clinic, and Wills Eye Hospital, as well as specialized ophthalmology networks, are spearheading clinical validation studies and integrating autonomous screening into routine care pathways.

  • Commercial adoption by large healthcare providers, telemedicine platforms, and retail eye care chains is accelerating demand for autonomous AI screening, particularly in primary care and community health settings.
  • USA vendors are enhancing AI platforms with predictive analytics, cloud-based interoperability, and FDA-cleared image analysis modules enabling real-time, high-accuracy diagnostics and reducing dependency on specialized ophthalmologists.
  • Cross-sector partnerships between healthcare providers, medical device companies, and AI software developers are fostering integrated care models where autonomous screening is combined with electronic health record systems, remote monitoring, and AI-assisted treatment recommendations.

Growth and Expansion Outlook for Global Autonomous AI Powered Ophthalmology Screening Market in India

The market for autonomous AI-powered ophthalmology screening in India is projected to grow at a CAGR of 7.2% between 2025 and 2035, driven by rising prevalence of diabetic retinopathy, glaucoma, and age-related eye conditions, alongside increasing smartphone penetration and telemedicine adoption. While urban tertiary hospitals and specialty eye care centers are rapidly adopting AI screening solutions, infrastructure gaps and uneven digital health literacy across rural areas limit nationwide coverage. Premier institutions such as All India Institute of Medical Sciences (AIIMS), SankaraNethralaya, and LV Prasad Eye Institute are leading pilot implementations, clinical validation studies, and AI training programs.

  • Adoption is concentrated in urban and semi-urban regions, with AI-enabled retinal screening devices deployed in ophthalmology departments, diabetes clinics, and telemedicine hubs.
  • Government initiatives, including the National Programme for Control of Blindness (NPCB), and partnerships with private eye hospitals, are supporting AI deployment for early detection and preventive care.
  • Indian AI health startups are developing cost-effective, portable retinal imaging devices integrated with autonomous diagnostic software to expand screening into smaller clinics and community health centers, aiming to overcome infrastructural and workforce limitations.

Sales Outlook for Global Autonomous AI Powered Ophthalmology Screening in China

China’s autonomous AI-powered ophthalmology screening market is projected to expand at a CAGR of 7.5% from 2025 to 2035. The market is being driven by strong government initiatives to improve eye health, widespread smartphone and telemedicine adoption, and growing prevalence of diabetic retinopathy and other retinal diseases. Leading hospitals and research centers such as Zhongshan Ophthalmic Center (Sun Yat-sen University), Peking University Third Hospital, and Shanghai Eye Disease Center are actively deploying AI screening solutions and publishing clinical validation studies. Several regional health networks have integrated autonomous AI screening platforms into community clinics, enabling early detection at scale.
  • Domestic AI companies are developing cloud- and edge-based ophthalmic screening systems tailored for Chinese hospitals and primary care centers, emphasizing regulatory compliance, simplified workflows, and Mandarin-language interfaces.
  • Many state-funded hospitals are combining AI screening tools with optical coherence tomography (OCT), fundus cameras, and teleophthalmology platforms, creating comprehensive diabetic retinopathy and glaucoma monitoring workflows.
  • Provincial and municipal health authorities are offering subsidies and co-funding programs for high-cost AI infrastructure, encouraging adoption in Tier 2 and Tier 3 cities beyond major hubs like Beijing, Shanghai, and Guangzhou.

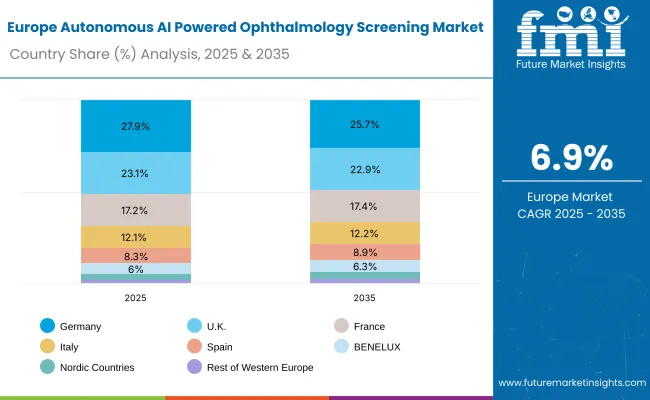
Sales Outlook for Global Autonomous AI Powered Ophthalmology Screening Europe

Europe Autonomous Ai Powered Ophthalmology Screening Market

Europe Country 2025
Germany 27.9%
UK 23.1%
France 17.2%
Italy 12.1%
Spain 8.3%
BENELUX 6.0%
Nordic Countries 3.4%
Rest of Western Europe 2.1%
Europe Country 2035
Germany 25.7%
UK 22.9%
France 17.4%
Italy 12.2%
Spain 8.9%
BENELUX 6.3%
Nordic Countries 4.1%
Rest of Western Europe 2.6%

Growth and Expansion Outlook for Global Autonomous AI Powered Ophthalmology Screening Market in the United Kingdom

The autonomous AI-powered ophthalmology screening market in the United Kingdom is projected to grow at a CAGR of 7.4% between 2025 and 2035. Market expansion is supported by a combination of strong public health initiatives, increasing integration of AI into clinical workflows, and early adoption by leading ophthalmic research centers and hospitals. Institutions such as Moorfields Eye Hospital, University College London Hospitals (UCLH), and King’s College London are piloting autonomous AI systems for diabetic retinopathy, glaucoma, and age-related macular degeneration screening.

The United Kingdom benefits from a well-established national healthcare infrastructure, enabling deployment of AI screening solutions in both urban and semi-urban regions. Early-stage integration into the NHS Diabetic Eye Screening Programme and research collaborations with AI startups are accelerating technology adoption and real-world validation.

  • Initiatives such as UKRI’s AI in Health Challenge and NHS digital transformation funding are facilitating pilot programs and scaling of autonomous AI ophthalmology solutions.
  • Cross-hospital partnerships are increasing clinical confidence, improving AI algorithm accuracy, and speeding regulatory approvals.
  • AI-powered systems are being deployed in community clinics and mobile platforms, extending access to underserved populations and reducing the burden on specialist ophthalmologists.

In-depth Analysis of Global Autonomous AI Powered Ophthalmology Screening in Germany

The autonomous AI-powered ophthalmology screening market in Germany is anticipated to grow at a CAGR of 7.7% between 2025 and 2035, driven by the country’s strong digital health infrastructure, high diabetes prevalence, and emphasis on early detection of retinal diseases. Germany is positioning itself as a key European hub for clinical validation and deployment of AI diagnostic tools, particularly in diabetic retinopathy and macular degeneration. Growth is being fueled by collaborations between university hospitals, device manufacturers, and AI developers, alongside federal initiatives supporting digital health integration. German firms and research centers are also contributing to the development of AI-enabled imaging platforms and workflow integration solutions that are increasingly being exported and adopted across Europe.
  • German digital health initiatives (DiGA and hospital innovation funding) are enabling pathways for reimbursement and integration into standard care.
  • Local imaging OEMs, including Heidelberg Engineering, are embedding AI-based apps into their diagnostic ecosystems, strengthening Germany’s role in global ophthalmology innovation.
  • Screening programs are expanding into primary care and optical retail settings, with AI tools being piloted to improve access and reduce ophthalmologist workload.

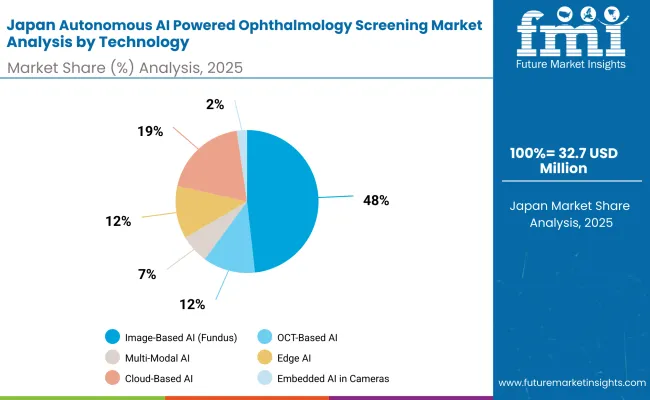
Growth Outlook for Global Autonomous AI Powered Ophthalmology Screening Market in Japan

Japan Autonomous Ai Powered Ophthalmology Screening Market By Technology

By Technology Market Value Share, 2025
Image-Based AI (Fundus) 48.2%
OCT-Based AI 11.8%
Multi-Modal AI 6.5%
Edge AI 11.9%
Cloud-Based AI 19.2%
Embedded AI in Cameras 2.3%

The autonomous AI-powered ophthalmology screening market in Japan has been projected to reachUSD 32.77 million by 2025. Image-based AI systems for fundus photography will lead the product landscape with a 48.2% share, followed by cloud-based AI at 19.2% and edge AI at 11.9%. The Japanese market is shaped by a strong national focus on preventive healthcare, universal insurance coverage, and a robust domestic base of optical and imaging device manufacturers.

Leading academic hospitals, such as the University of Tokyo Hospital, Keio University Hospital, and Osaka University Hospital, have made autonomous AI screening central to programs for diabetic retinopathy and age-related macular degeneration. Clinical pilots are combining fundus and OCT-based AI solutions across hospital and community networks, enabling broad experimentation from population-scale diabetes screening to advanced multimodal diagnostics.
  • OCT-based and multi-modal AI systems are gaining momentum in academic centers exploring early detection of AMD and glaucoma.
  • The country’s electronics and imaging firms are developing edge and embedded AI platforms, supporting both domestic roll-out and international exports.
  • A strong culture of collaboration between universities, hospitals, and manufacturers is enabling rapid system adaptation, though regulatory and reimbursement pathways continue to define the pace of standardization.

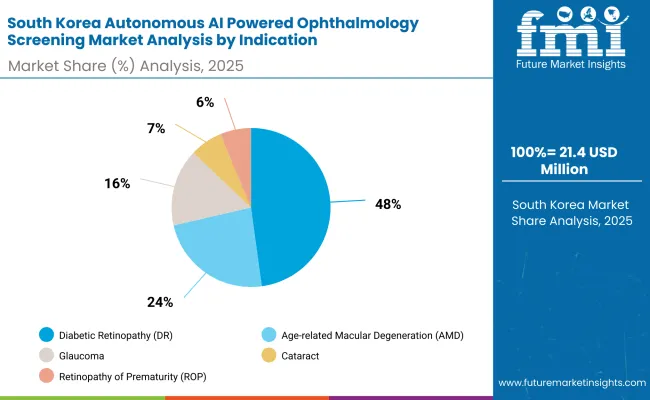
Opportunity Analysis of South Korea Global Autonomous AI Powered Ophthalmology Screening Market

South Korea Autonomous Ai Powered Ophthalmology Screening Market By Indication

By Indication Market Value Share, 2025
Diabetic Retinopathy (DR) 47.8%
Age-related Macular Degeneration (AMD) 23.5%
Glaucoma 15.7%
Cataract 6.6%
Retinopathy of Prematurity (ROP) 6.3%

The autonomous AI-powered ophthalmology screening market in South Korea has been projected to reach USD 21.47 million by 2025. By indication, diabetic retinopathy is expected to lead with a 47.8% share, followed by age-related macular degeneration at 23.5% and glaucoma at 15.7%. South Korea’s market is evolving from early academic pilots toward wider deployment in community health and tele-ophthalmology frameworks. National centers such as the Korea Institute of Science and Technology (KIST) and Seoul National University Hospital are leading research and clinical validation of AI-driven retinal imaging. A distinctive driver for South Korea is the integration of AI screening into digital health platforms and nationwide chronic disease management programs, particularly targeting the country’s growing diabetic population.
  • Domestic IT and electronics firms are partnering with hospitals to embed AI algorithms into fundus cameras and OCT systems, supporting localized innovation and export potential.
  • Government-backed digital health initiatives are supporting reimbursement discussions and data governance frameworks, enabling sustainable adoption of AI diagnostics.
  • Strong cloud infrastructure and 5G connectivity allow real-time image transfer, AI inference, and remote specialist validation, positioning South Korea as a regional model for scalable AI ophthalmology screening.

Competitive Landscape of Global Autonomous AI Powered Ophthalmology Screening Market

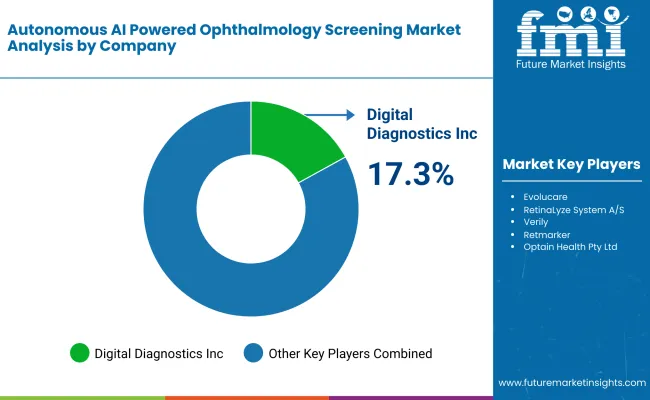
Autonomous Ai Powered Ophthalmology Screening Market By Company

Company Global Value Share 2024
Digital Diagnostics Inc. 17.3%
Others 82.7%

The autonomous AI-powered ophthalmology screening market is moderately fragmented, with Digital Diagnostics Inc. holding a leading global position due to its FDA-cleared IDx-DR platform for autonomous diabetic retinopathy detection. The company’s strength lies in its regulatory head start, established USA deployments, and expanding payer partnerships, making it the reference point for fully autonomous ophthalmic AI.

Other key players include Eyenuk, AEYE Health, and Remidio Innovative Solutions, each addressing different segments of the ecosystem. Eyenuk is scaling its EyeArt platform across major health systems with FDA clearance, AEYE Health emphasizes ultra-rapid image analysis for point-of-care settings, and Remidio differentiates with portable smartphone-based fundus cameras integrated with AI. Regional and global players such as Beijing Airdoc, Verily, RetinaLyze, Retmarker, and Zebra Medical Vision are embedding AI screening within broader healthcare and chronic disease management frameworks.

Key Developments in Global Autonomous AI Powered Ophthalmology Screening Market

  • In June 2025, Digital Diagnostics announced the deployment of its LumineticsCore® system (formerly known as IDx-DR) at WVU Medicine Uniontown Hospital for diabetic retinopathy screening in primary care settings.
  • In July 2023 RetinaLyze has launched its Advanced Glaucoma Progression AI, featuring the Glaucoma Index of Progression (GIP). This tool offers a stable and consistent method for tracking glaucoma over time, providing crucial insights for eye care professionals.

Scope of the Report

Item Value
Quantitative Units USD 1,130.0 million
Technology Image-Based AI (Fundus), OCT-Based AI, Multi-Modal AI, Edge AI, Cloud-Based AI, Embedded AI in Cameras
Indication Diabetic Retinopathy (DR), Age-related Macular Degeneration (AMD), Glaucoma, Cataract, Retinopathy of Prematurity (ROP)
End User Primary Care Clinics, Ophthalmology Clinics, Mobile Clinics / Rural Camps, Hospitals & Tertiary Centers, Others
Regions Covered North America, Latin America, Western Europe, Eastern Europe, East Asia, South Asia & Pacific, Middle East & Africa
Countries Covered USA, Brazil, China, India, Europe, Germany, France and UK
Key Companies Profiled Digital Diagnostics Inc., Eyenuk, Inc., AEYE Health, Remidio Innovative Solutions Pvt Ltd., Evolucare, RetinaLyze System A/S, Verily, Retmarker, Intelligent Retinal Imaging Systems, MONA.health, Optain Health Pty Ltd., Beijing Airdoc Technology Co., Ltd., Zebra Medical Vision, Ikerian AG, Altris, Inc., identifeye HEALTH and others

Key Segments

By Technology:

  • Image-Based AI (Fundus)
  • OCT-Based AI
  • Multi-Modal AI
  • Edge AI
  • Cloud-Based AI
  • Embedded AI in Cameras

By Indication:

  • Diabetic Retinopathy (DR)
  • Age-related Macular Degeneration (AMD)
  • Glaucoma
  • Cataract
  • Retinopathy of Prematurity (ROP)

By End User:

  • Primary Care Clinics
  • Ophthalmology Clinics
  • Mobile Clinics / Rural Camps
  • Hospitals & Tertiary Centers
  • Others

By Region:

  • North America
  • Latin America
  • Western Europe
  • Eastern Europe
  • East Asia
  • South Asia
  • MEA

Table of Content

  1. Executive Summary
    • Global Market Outlook
    • Demand-side Trends
    • Supply-side Trends
    • Technology Roadmap Analysis
    • Analysis and Recommendations
  2. Market Overview
    • Market Coverage / Taxonomy
    • Market Definition / Scope / Limitations
  3. Market Background
    • Market Dynamics
      • Drivers
      • Restraints
      • Opportunity
      • Trends
    • Scenario Forecast
      • Demand in Optimistic Scenario
      • Demand in Likely Scenario
      • Demand in Conservative Scenario
    • Opportunity Map Analysis
    • Product Life Cycle Analysis
    • Technological Advancement
    • Investment Feasibility Matrix
    • PESTLE and Porter’s Analysis
    • Regulatory Landscape
  4. 3.9.1. By Key Regions
  5. 3.9.2. By Key Countries
    • Regional Parent Market Outlook
    • Recent Prouct Launches/Approvals
  6. Global Global Market Analysis 2020 to 2024 and Forecast, 2025 to 2035
    • Historical Market Size Value (USD Million) Analysis, 2020 to 2024
    • Current and Future Market Size Value (USD Million) Projections, 2025 to 2035
      • Y-o-Y Growth Trend Analysis
      • Absolute $ Opportunity Analysis
  7. Global Global Market Analysis 2020 to 2024 and Forecast 2025 to 2035, By Technology
    • Introduction / Key Findings
    • Historical Market Size Value (USD Million) Analysis By Technology, 2020 to 2024
    • Current and Future Market Size Value (USD Million) Analysis and Forecast By Technology, 2025 to 2035
      • Image-Based AI (Fundus)
      • OCT-Based AI
      • Multi-Modal AI
      • Edge AI
      • Cloud-Based AI
      • Embedded AI in Cameras
    • Y-o-Y Growth Trend Analysis By Technology, 2020 to 2024
    • Absolute $ Opportunity Analysis By Technology, 2025 to 2035
  8. Global Global Market Analysis 2020 to 2024 and Forecast 2025 to 2035, By Indication
    • Introduction / Key Findings
    • Historical Market Size Value (USD Million) Analysis By Indication, 2020 to 2024
    • Current and Future Market Size Value (USD Million) Analysis and Forecast By Indication, 2025 to 2035
      • Diabetic Retinopathy (DR)
      • Age-related Macular Degeneration (AMD)
      • Glaucoma
      • Cataract
      • Retinopathy of Prematurity (ROP)
    • Y-o-Y Growth Trend Analysis By Indication, 2020 to 2024
    • Absolute $ Opportunity Analysis By Indication, 2025 to 2035
  9. Global Global Market Analysis 2020 to 2024 and Forecast 2025 to 2035, By End User
    • Introduction / Key Findings
    • Historical Market Size Value (USD Million) Analysis By End User, 2020 to 2024
    • Current and Future Market Size Value (USD Million) Analysis and Forecast By End User, 2025 to 2035
      • Primary Care Clinics
      • Ophthalmology Clinics
      • Mobile Clinics / Rural Camps
      • Hospitals & Tertiary Centers
      • Others
    • Y-o-Y Growth Trend Analysis By End User, 2020 to 2024
    • Absolute $ Opportunity Analysis By End User, 2025 to 2035
  10. Global Global Market Analysis 2020 to 2024 and Forecast 2025 to 2035, By Region
    • Introduction
    • Historical Market Size Value (USD Million) Analysis By Region, 2020 to 2024
    • Current Market Size Value (USD Million) Analysis and Forecast By Region, 2025 to 2035
      • North America
      • Latin America
      • Western Europe
      • Eastern Europe
      • East Asia
      • South Asia
      • MEA
    • Market Attractiveness Analysis By Region
  11. North America Global Market Analysis 2020 to 2024 and Forecast 2025 to 2035, By Country
    • Historical Market Size Value (USD Million) Trend Analysis By Market Taxonomy, 2020 to 2024
    • Market Size Value (USD Million) Forecast By Market Taxonomy, 2025 to 2035
      • By Country
        • USA
        • Canada
        • Mexico
      • By Technology
      • By Indication
      • By End User
    • Market Attractiveness Analysis
      • By Country
      • By Technology
      • By Indication
      • By End User
    • Key Takeaways
  12. Latin America Global Market Analysis 2020 to 2024 and Forecast 2025 to 2035, By Country
    • Historical Market Size Value (USD Million) Trend Analysis By Market Taxonomy, 2020 to 2024
    • Market Size Value (USD Million) Forecast By Market Taxonomy, 2025 to 2035
      • By Country
        • Brazil
        • Argentina
        • Rest of Latin America
      • By Technology
      • By Indication
      • By End User
    • Market Attractiveness Analysis
      • By Country
      • By Technology
      • By Indication
      • By End User
    • Key Takeaways
  13. Western Europe Global Market Analysis 2020 to 2024 and Forecast 2025 to 2035, By Country
    • Historical Market Size Value (USD Million) Trend Analysis By Market Taxonomy, 2020 to 2024
    • Market Size Value (USD Million) Forecast By Market Taxonomy, 2025 to 2035
      • By Country
        • Germany
        • Italy
        • France
        • UK
        • Spain
        • BENELUX
        • Nordic Countries
        • Rest of Western Europe
      • By Technology
      • By Indication
      • By End User
    • Market Attractiveness Analysis
      • By Country
      • By Technology
      • By Indication
      • By End User
    • Key Takeaways
  14. Eastern Europe Global Market Analysis 2020 to 2024 and Forecast 2025 to 2035, By Country
    • Historical Market Size Value (USD Million) Trend Analysis By Market Taxonomy, 2020 to 2024
    • Market Size Value (USD Million) Forecast By Market Taxonomy, 2025 to 2035
      • By Country
        • Russia
        • Hungry
        • Poland
        • Rest of Eastern Europe
      • By Technology
      • By Indication
      • By End User
    • Market Attractiveness Analysis
      • By Country
      • By Technology
      • By Indication
      • By End User
    • Key Takeaways
  15. East Asia Global Market Analysis 2020 to 2024 and Forecast 2025 to 2035, By Country
    • Historical Market Size Value (USD Million) Trend Analysis By Market Taxonomy, 2020 to 2024
    • Market Size Value (USD Million) Forecast By Market Taxonomy, 2025 to 2035
      • By Country
        • China
        • Japan
        • South Korea
      • By Technology
      • By Indication
      • By End User
    • Market Attractiveness Analysis
      • By Country
      • By Technology
      • By Indication
      • By End User
    • Key Takeaways
  16. South Asia Global Market Analysis 2020 to 2024 and Forecast 2025 to 2035, By Country
    • Historical Market Size Value (USD Million) Trend Analysis By Market Taxonomy, 2020 to 2024
    • Market Size Value (USD Million) Forecast By Market Taxonomy, 2025 to 2035
      • By Country
        • India
        • ASEAN Countries
        • Australia & New Zealand
        • Rest of South Asia
      • By Technology
      • By Indication
      • By End User
    • Market Attractiveness Analysis
      • By Country
      • By Technology
      • By Indication
      • By End User
    • Key Takeaways
  17. MEA Global Market Analysis 2020 to 2024 and Forecast 2025 to 2035, By Country
    • Historical Market Size Value (USD Million) Trend Analysis By Market Taxonomy, 2020 to 2024
    • Market Size Value (USD Million) Forecast By Market Taxonomy, 2025 to 2035
      • By Country
        • Saudi Arabia
        • Türkiye
        • South Africa
        • Other African Union
        • Rest of MEA
      • By Technology
      • By Indication
      • By End User
    • Market Attractiveness Analysis
      • By Country
      • By Technology
      • By Indication
      • By End User
    • Key Takeaways
  18. Key Countries Global Market Analysis
    • USA
      • Pricing Analysis
      • Market Share Analysis, 2024
        • By Technology
        • By Indication
        • By End User
    • Brazil
      • Pricing Analysis
      • Market Share Analysis, 2024
        • By Technology
        • By Indication
        • By End User
    • China
      • Pricing Analysis
      • Market Share Analysis, 2024
        • By Technology
        • By Indication
        • By End User
    • India
      • Pricing Analysis
      • Market Share Analysis, 2024
        • By Technology
        • By Indication
        • By End User
    • Europe
      • Pricing Analysis
      • Market Share Analysis, 2024
        • By Technology
        • By Indication
        • By End User
    • Germany
      • Pricing Analysis
      • Market Share Analysis, 2024
        • By Technology
        • By Indication
        • By End User
    • France
      • Pricing Analysis
      • Market Share Analysis, 2024
        • By Technology
        • By Indication
        • By End User
    • UK
      • Pricing Analysis
      • Market Share Analysis, 2024
        • By Technology
        • By Indication
        • By End User
  19. Market Structure Analysis
    • Competition Dashboard
    • Competition Benchmarking
    • Market Share Analysis of Top Players
      • By Regional
      • By Technology
      • By Indication
      • By End User
  20. Competition Analysis
    • Competition Deep Dive
      • Digital Diagnostics Inc.
        • Overview
        • Product Portfolio
        • Profitability by Market Segments (Product/Age /Sales Channel/Region)
        • Sales Footprint
        • Strategy Overview
          • Marketing Strategy
          • Product Strategy
          • Channel Strategy
      • Eyenuk, Inc.
        • Overview
        • Product Portfolio
        • Profitability by Market Segments (Product/Age /Sales Channel/Region)
        • Sales Footprint
        • Strategy Overview
          • Marketing Strategy
          • Product Strategy
          • Channel Strategy
      • AEYE Health.
        • Overview
        • Product Portfolio
        • Profitability by Market Segments (Product/Age /Sales Channel/Region)
        • Sales Footprint
        • Strategy Overview
          • Marketing Strategy
          • Product Strategy
          • Channel Strategy
      • Remidio Innovative Solutions Pvt Ltd.
        • Overview
        • Product Portfolio
        • Profitability by Market Segments (Product/Age /Sales Channel/Region)
        • Sales Footprint
        • Strategy Overview
          • Marketing Strategy
          • Product Strategy
          • Channel Strategy
      • Evolucare
        • Overview
        • Product Portfolio
        • Profitability by Market Segments (Product/Age /Sales Channel/Region)
        • Sales Footprint
        • Strategy Overview
          • Marketing Strategy
          • Product Strategy
          • Channel Strategy
      • RetinaLyze System A/S
        • Overview
        • Product Portfolio
        • Profitability by Market Segments (Product/Age /Sales Channel/Region)
        • Sales Footprint
        • Strategy Overview
          • Marketing Strategy
          • Product Strategy
          • Channel Strategy
      • Verily
        • Overview
        • Product Portfolio
        • Profitability by Market Segments (Product/Age /Sales Channel/Region)
        • Sales Footprint
        • Strategy Overview
          • Marketing Strategy
          • Product Strategy
          • Channel Strategy
      • Retmarker
        • Overview
        • Product Portfolio
        • Profitability by Market Segments (Product/Age /Sales Channel/Region)
        • Sales Footprint
        • Strategy Overview
          • Marketing Strategy
          • Product Strategy
          • Channel Strategy
      • Intelligent Retinal Imaging Systems
        • Overview
        • Product Portfolio
        • Profitability by Market Segments (Product/Age /Sales Channel/Region)
        • Sales Footprint
        • Strategy Overview
          • Marketing Strategy
          • Product Strategy
          • Channel Strategy
      • MONA.health
        • Overview
        • Product Portfolio
        • Profitability by Market Segments (Product/Age /Sales Channel/Region)
        • Sales Footprint
        • Strategy Overview
          • Marketing Strategy
          • Product Strategy
          • Channel Strategy
      • Optain Health Pty Ltd.
        • Overview
        • Product Portfolio
        • Profitability by Market Segments (Product/Age /Sales Channel/Region)
        • Sales Footprint
        • Strategy Overview
          • Marketing Strategy
          • Product Strategy
          • Channel Strategy
      • Beijing Airdoc Technology Co., Ltd.
        • Overview
        • Product Portfolio
        • Profitability by Market Segments (Product/Age /Sales Channel/Region)
        • Sales Footprint
        • Strategy Overview
          • Marketing Strategy
          • Product Strategy
          • Channel Strategy
      • Zebra Medical Vision
        • Overview
        • Product Portfolio
        • Profitability by Market Segments (Product/Age /Sales Channel/Region)
        • Sales Footprint
        • Strategy Overview
          • Marketing Strategy
          • Product Strategy
          • Channel Strategy
      • Ikerian AG
        • Overview
        • Product Portfolio
        • Profitability by Market Segments (Product/Age /Sales Channel/Region)
        • Sales Footprint
        • Strategy Overview
          • Marketing Strategy
          • Product Strategy
          • Channel Strategy
      • Altris, Inc.
        • Overview
        • Product Portfolio
        • Profitability by Market Segments (Product/Age /Sales Channel/Region)
        • Sales Footprint
        • Strategy Overview
          • Marketing Strategy
          • Product Strategy
          • Channel Strategy
      • identifeye HEALTH
        • Overview
        • Product Portfolio
        • Profitability by Market Segments (Product/Age /Sales Channel/Region)
        • Sales Footprint
        • Strategy Overview
          • Marketing Strategy
          • Product Strategy
          • Channel Strategy
  21. Assumptions & Acronyms Used
  22. Research Methodology

List of Tables

  • Table 1: Global Global Market Value (USD Million) Forecast by Region, 2020-2035
  • Table 2: Global Global Market Value (USD Million) Forecast by Technology, 2020-2035
  • Table 3: Global Global Market Value (USD Million) Forecast by Indication, 2020-2035
  • Table 4: Global Global Market Value (USD Million) Forecast by End User, 2020-2035
  • Table 5: North America Global Market Value (USD Million) Forecast by Country, 2020-2035
  • Table 6: North America Global Market Value (USD Million) Forecast by Technology, 2020-2035
  • Table 7: North America Global Market Value (USD Million) Forecast by Indication, 2020-2035
  • Table 8: North America Global Market Value (USD Million) Forecast by End User, 2020-2035
  • Table 9: Latin America Global Market Value (USD Million) Forecast by Country, 2020-2035
  • Table 10: Latin America Global Market Value (USD Million) Forecast by Technology, 2020-2035
  • Table 11: Latin America Global Market Value (USD Million) Forecast by Indication, 2020-2035
  • Table 12: Latin America Global Market Value (USD Million) Forecast by End User, 2020-2035
  • Table 13: Western Europe Global Market Value (USD Million) Forecast by Country, 2020-2035
  • Table 14: Western Europe Global Market Value (USD Million) Forecast by Technology, 2020-2035
  • Table 15: Western Europe Global Market Value (USD Million) Forecast by Indication, 2020-2035
  • Table 16: Western Europe Global Market Value (USD Million) Forecast by End User, 2020-2035
  • Table 17: Eastern Europe Global Market Value (USD Million) Forecast by Country, 2020-2035
  • Table 18: Eastern Europe Global Market Value (USD Million) Forecast by Technology, 2020-2035
  • Table 19: Eastern Europe Global Market Value (USD Million) Forecast by Indication, 2020-2035
  • Table 20: Eastern Europe Global Market Value (USD Million) Forecast by End User, 2020-2035
  • Table 21: East Asia Global Market Value (USD Million) Forecast by Country, 2020-2035
  • Table 22: East Asia Global Market Value (USD Million) Forecast by Technology, 2020-2035
  • Table 23: East Asia Global Market Value (USD Million) Forecast by Indication, 2020-2035
  • Table 24: East Asia Global Market Value (USD Million) Forecast by End User, 2020-2035
  • Table 25: South Asia Global Market Value (USD Million) Forecast by Country, 2020-2035
  • Table 26: South Asia Global Market Value (USD Million) Forecast by Technology, 2020-2035
  • Table 27: South Asia Global Market Value (USD Million) Forecast by Indication, 2020-2035
  • Table 28: South Asia Global Market Value (USD Million) Forecast by End User, 2020-2035
  • Table 29: MEA Global Market Value (USD Million) Forecast by Country, 2020-2035
  • Table 30: MEA Global Market Value (USD Million) Forecast by Technology, 2020-2035
  • Table 31: MEA Global Market Value (USD Million) Forecast by Indication, 2020-2035
  • Table 32: MEA Global Market Value (USD Million) Forecast by End User, 2020-2035

List of Figures

  • Figure 1: Global Global Market Value (USD Million) by Technology, 2025-2035
  • Figure 2: Global Global Market Value (USD Million) by Indication, 2025-2035
  • Figure 3: Global Global Market Value (USD Million) by End User, 2025-2035
  • Figure 4: Global Global Market Value (USD Million) by Region, 2025-2035
  • Figure 5: Global Global Market Value (USD Million) Analysis by Region, 2020-2035
  • Figure 6: Global Global Market Value Share (%) and BPS Analysis by Region, 2025-2035
  • Figure 7: Global Global Market Y-o-Y Growth (%) Projections by Region, 2025-2035
  • Figure 8: Global Global Market Value (USD Million) Analysis by Technology, 2020-2035
  • Figure 9: Global Global Market Value Share (%) and BPS Analysis by Technology, 2025-2035
  • Figure 10: Global Global Market Y-o-Y Growth (%) Projections by Technology, 2025-2035
  • Figure 11: Global Global Market Value (USD Million) Analysis by Indication, 2020-2035
  • Figure 12: Global Global Market Value Share (%) and BPS Analysis by Indication, 2025-2035
  • Figure 13: Global Global Market Y-o-Y Growth (%) Projections by Indication, 2025-2035
  • Figure 14: Global Global Market Value (USD Million) Analysis by End User, 2020-2035
  • Figure 15: Global Global Market Value Share (%) and BPS Analysis by End User, 2025-2035
  • Figure 16: Global Global Market Y-o-Y Growth (%) Projections by End User, 2025-2035
  • Figure 17: Global Global Market Attractiveness by Technology, 2025-2035
  • Figure 18: Global Global Market Attractiveness by Indication, 2025-2035
  • Figure 19: Global Global Market Attractiveness by End User, 2025-2035
  • Figure 20: Global Global Market Attractiveness by Region, 2025-2035
  • Figure 21: North America Global Market Value (USD Million) by Technology, 2025-2035
  • Figure 22: North America Global Market Value (USD Million) by Indication, 2025-2035
  • Figure 23: North America Global Market Value (USD Million) by End User, 2025-2035
  • Figure 24: North America Global Market Value (USD Million) by Country, 2025-2035
  • Figure 25: North America Global Market Value (USD Million) Analysis by Country, 2020-2035
  • Figure 26: North America Global Market Value Share (%) and BPS Analysis by Country, 2025-2035
  • Figure 27: North America Global Market Y-o-Y Growth (%) Projections by Country, 2025-2035
  • Figure 28: North America Global Market Value (USD Million) Analysis by Technology, 2020-2035
  • Figure 29: North America Global Market Value Share (%) and BPS Analysis by Technology, 2025-2035
  • Figure 30: North America Global Market Y-o-Y Growth (%) Projections by Technology, 2025-2035
  • Figure 31: North America Global Market Value (USD Million) Analysis by Indication, 2020-2035
  • Figure 32: North America Global Market Value Share (%) and BPS Analysis by Indication, 2025-2035
  • Figure 33: North America Global Market Y-o-Y Growth (%) Projections by Indication, 2025-2035
  • Figure 34: North America Global Market Value (USD Million) Analysis by End User, 2020-2035
  • Figure 35: North America Global Market Value Share (%) and BPS Analysis by End User, 2025-2035
  • Figure 36: North America Global Market Y-o-Y Growth (%) Projections by End User, 2025-2035
  • Figure 37: North America Global Market Attractiveness by Technology, 2025-2035
  • Figure 38: North America Global Market Attractiveness by Indication, 2025-2035
  • Figure 39: North America Global Market Attractiveness by End User, 2025-2035
  • Figure 40: North America Global Market Attractiveness by Country, 2025-2035
  • Figure 41: Latin America Global Market Value (USD Million) by Technology, 2025-2035
  • Figure 42: Latin America Global Market Value (USD Million) by Indication, 2025-2035
  • Figure 43: Latin America Global Market Value (USD Million) by End User, 2025-2035
  • Figure 44: Latin America Global Market Value (USD Million) by Country, 2025-2035
  • Figure 45: Latin America Global Market Value (USD Million) Analysis by Country, 2020-2035
  • Figure 46: Latin America Global Market Value Share (%) and BPS Analysis by Country, 2025-2035
  • Figure 47: Latin America Global Market Y-o-Y Growth (%) Projections by Country, 2025-2035
  • Figure 48: Latin America Global Market Value (USD Million) Analysis by Technology, 2020-2035
  • Figure 49: Latin America Global Market Value Share (%) and BPS Analysis by Technology, 2025-2035
  • Figure 50: Latin America Global Market Y-o-Y Growth (%) Projections by Technology, 2025-2035
  • Figure 51: Latin America Global Market Value (USD Million) Analysis by Indication, 2020-2035
  • Figure 52: Latin America Global Market Value Share (%) and BPS Analysis by Indication, 2025-2035
  • Figure 53: Latin America Global Market Y-o-Y Growth (%) Projections by Indication, 2025-2035
  • Figure 54: Latin America Global Market Value (USD Million) Analysis by End User, 2020-2035
  • Figure 55: Latin America Global Market Value Share (%) and BPS Analysis by End User, 2025-2035
  • Figure 56: Latin America Global Market Y-o-Y Growth (%) Projections by End User, 2025-2035
  • Figure 57: Latin America Global Market Attractiveness by Technology, 2025-2035
  • Figure 58: Latin America Global Market Attractiveness by Indication, 2025-2035
  • Figure 59: Latin America Global Market Attractiveness by End User, 2025-2035
  • Figure 60: Latin America Global Market Attractiveness by Country, 2025-2035
  • Figure 61: Western Europe Global Market Value (USD Million) by Technology, 2025-2035
  • Figure 62: Western Europe Global Market Value (USD Million) by Indication, 2025-2035
  • Figure 63: Western Europe Global Market Value (USD Million) by End User, 2025-2035
  • Figure 64: Western Europe Global Market Value (USD Million) by Country, 2025-2035
  • Figure 65: Western Europe Global Market Value (USD Million) Analysis by Country, 2020-2035
  • Figure 66: Western Europe Global Market Value Share (%) and BPS Analysis by Country, 2025-2035
  • Figure 67: Western Europe Global Market Y-o-Y Growth (%) Projections by Country, 2025-2035
  • Figure 68: Western Europe Global Market Value (USD Million) Analysis by Technology, 2020-2035
  • Figure 69: Western Europe Global Market Value Share (%) and BPS Analysis by Technology, 2025-2035
  • Figure 70: Western Europe Global Market Y-o-Y Growth (%) Projections by Technology, 2025-2035
  • Figure 71: Western Europe Global Market Value (USD Million) Analysis by Indication, 2020-2035
  • Figure 72: Western Europe Global Market Value Share (%) and BPS Analysis by Indication, 2025-2035
  • Figure 73: Western Europe Global Market Y-o-Y Growth (%) Projections by Indication, 2025-2035
  • Figure 74: Western Europe Global Market Value (USD Million) Analysis by End User, 2020-2035
  • Figure 75: Western Europe Global Market Value Share (%) and BPS Analysis by End User, 2025-2035
  • Figure 76: Western Europe Global Market Y-o-Y Growth (%) Projections by End User, 2025-2035
  • Figure 77: Western Europe Global Market Attractiveness by Technology, 2025-2035
  • Figure 78: Western Europe Global Market Attractiveness by Indication, 2025-2035
  • Figure 79: Western Europe Global Market Attractiveness by End User, 2025-2035
  • Figure 80: Western Europe Global Market Attractiveness by Country, 2025-2035
  • Figure 81: Eastern Europe Global Market Value (USD Million) by Technology, 2025-2035
  • Figure 82: Eastern Europe Global Market Value (USD Million) by Indication, 2025-2035
  • Figure 83: Eastern Europe Global Market Value (USD Million) by End User, 2025-2035
  • Figure 84: Eastern Europe Global Market Value (USD Million) by Country, 2025-2035
  • Figure 85: Eastern Europe Global Market Value (USD Million) Analysis by Country, 2020-2035
  • Figure 86: Eastern Europe Global Market Value Share (%) and BPS Analysis by Country, 2025-2035
  • Figure 87: Eastern Europe Global Market Y-o-Y Growth (%) Projections by Country, 2025-2035
  • Figure 88: Eastern Europe Global Market Value (USD Million) Analysis by Technology, 2020-2035
  • Figure 89: Eastern Europe Global Market Value Share (%) and BPS Analysis by Technology, 2025-2035
  • Figure 90: Eastern Europe Global Market Y-o-Y Growth (%) Projections by Technology, 2025-2035
  • Figure 91: Eastern Europe Global Market Value (USD Million) Analysis by Indication, 2020-2035
  • Figure 92: Eastern Europe Global Market Value Share (%) and BPS Analysis by Indication, 2025-2035
  • Figure 93: Eastern Europe Global Market Y-o-Y Growth (%) Projections by Indication, 2025-2035
  • Figure 94: Eastern Europe Global Market Value (USD Million) Analysis by End User, 2020-2035
  • Figure 95: Eastern Europe Global Market Value Share (%) and BPS Analysis by End User, 2025-2035
  • Figure 96: Eastern Europe Global Market Y-o-Y Growth (%) Projections by End User, 2025-2035
  • Figure 97: Eastern Europe Global Market Attractiveness by Technology, 2025-2035
  • Figure 98: Eastern Europe Global Market Attractiveness by Indication, 2025-2035
  • Figure 99: Eastern Europe Global Market Attractiveness by End User, 2025-2035
  • Figure 100: Eastern Europe Global Market Attractiveness by Country, 2025-2035
  • Figure 101: East Asia Global Market Value (USD Million) by Technology, 2025-2035
  • Figure 102: East Asia Global Market Value (USD Million) by Indication, 2025-2035
  • Figure 103: East Asia Global Market Value (USD Million) by End User, 2025-2035
  • Figure 104: East Asia Global Market Value (USD Million) by Country, 2025-2035
  • Figure 105: East Asia Global Market Value (USD Million) Analysis by Country, 2020-2035
  • Figure 106: East Asia Global Market Value Share (%) and BPS Analysis by Country, 2025-2035
  • Figure 107: East Asia Global Market Y-o-Y Growth (%) Projections by Country, 2025-2035
  • Figure 108: East Asia Global Market Value (USD Million) Analysis by Technology, 2020-2035
  • Figure 109: East Asia Global Market Value Share (%) and BPS Analysis by Technology, 2025-2035
  • Figure 110: East Asia Global Market Y-o-Y Growth (%) Projections by Technology, 2025-2035
  • Figure 111: East Asia Global Market Value (USD Million) Analysis by Indication, 2020-2035
  • Figure 112: East Asia Global Market Value Share (%) and BPS Analysis by Indication, 2025-2035
  • Figure 113: East Asia Global Market Y-o-Y Growth (%) Projections by Indication, 2025-2035
  • Figure 114: East Asia Global Market Value (USD Million) Analysis by End User, 2020-2035
  • Figure 115: East Asia Global Market Value Share (%) and BPS Analysis by End User, 2025-2035
  • Figure 116: East Asia Global Market Y-o-Y Growth (%) Projections by End User, 2025-2035
  • Figure 117: East Asia Global Market Attractiveness by Technology, 2025-2035
  • Figure 118: East Asia Global Market Attractiveness by Indication, 2025-2035
  • Figure 119: East Asia Global Market Attractiveness by End User, 2025-2035
  • Figure 120: East Asia Global Market Attractiveness by Country, 2025-2035
  • Figure 121: South Asia Global Market Value (USD Million) by Technology, 2025-2035
  • Figure 122: South Asia Global Market Value (USD Million) by Indication, 2025-2035
  • Figure 123: South Asia Global Market Value (USD Million) by End User, 2025-2035
  • Figure 124: South Asia Global Market Value (USD Million) by Country, 2025-2035
  • Figure 125: South Asia Global Market Value (USD Million) Analysis by Country, 2020-2035
  • Figure 126: South Asia Global Market Value Share (%) and BPS Analysis by Country, 2025-2035
  • Figure 127: South Asia Global Market Y-o-Y Growth (%) Projections by Country, 2025-2035
  • Figure 128: South Asia Global Market Value (USD Million) Analysis by Technology, 2020-2035
  • Figure 129: South Asia Global Market Value Share (%) and BPS Analysis by Technology, 2025-2035
  • Figure 130: South Asia Global Market Y-o-Y Growth (%) Projections by Technology, 2025-2035
  • Figure 131: South Asia Global Market Value (USD Million) Analysis by Indication, 2020-2035
  • Figure 132: South Asia Global Market Value Share (%) and BPS Analysis by Indication, 2025-2035
  • Figure 133: South Asia Global Market Y-o-Y Growth (%) Projections by Indication, 2025-2035
  • Figure 134: South Asia Global Market Value (USD Million) Analysis by End User, 2020-2035
  • Figure 135: South Asia Global Market Value Share (%) and BPS Analysis by End User, 2025-2035
  • Figure 136: South Asia Global Market Y-o-Y Growth (%) Projections by End User, 2025-2035
  • Figure 137: South Asia Global Market Attractiveness by Technology, 2025-2035
  • Figure 138: South Asia Global Market Attractiveness by Indication, 2025-2035
  • Figure 139: South Asia Global Market Attractiveness by End User, 2025-2035
  • Figure 140: South Asia Global Market Attractiveness by Country, 2025-2035
  • Figure 141: MEA Global Market Value (USD Million) by Technology, 2025-2035
  • Figure 142: MEA Global Market Value (USD Million) by Indication, 2025-2035
  • Figure 143: MEA Global Market Value (USD Million) by End User, 2025-2035
  • Figure 144: MEA Global Market Value (USD Million) by Country, 2025-2035
  • Figure 145: MEA Global Market Value (USD Million) Analysis by Country, 2020-2035
  • Figure 146: MEA Global Market Value Share (%) and BPS Analysis by Country, 2025-2035
  • Figure 147: MEA Global Market Y-o-Y Growth (%) Projections by Country, 2025-2035
  • Figure 148: MEA Global Market Value (USD Million) Analysis by Technology, 2020-2035
  • Figure 149: MEA Global Market Value Share (%) and BPS Analysis by Technology, 2025-2035
  • Figure 150: MEA Global Market Y-o-Y Growth (%) Projections by Technology, 2025-2035
  • Figure 151: MEA Global Market Value (USD Million) Analysis by Indication, 2020-2035
  • Figure 152: MEA Global Market Value Share (%) and BPS Analysis by Indication, 2025-2035
  • Figure 153: MEA Global Market Y-o-Y Growth (%) Projections by Indication, 2025-2035
  • Figure 154: MEA Global Market Value (USD Million) Analysis by End User, 2020-2035
  • Figure 155: MEA Global Market Value Share (%) and BPS Analysis by End User, 2025-2035
  • Figure 156: MEA Global Market Y-o-Y Growth (%) Projections by End User, 2025-2035
  • Figure 157: MEA Global Market Attractiveness by Technology, 2025-2035
  • Figure 158: MEA Global Market Attractiveness by Indication, 2025-2035
  • Figure 159: MEA Global Market Attractiveness by End User, 2025-2035
  • Figure 160: MEA Global Market Attractiveness by Country, 2025-2035

Frequently Asked Questions

How big is the Global Autonomous AI Powered Ophthalmology Screening Market in 2025?

The global Global Autonomous AI Powered Ophthalmology Screening Market is estimated to be valued at USD 1,130.0 million in 2025.

What will be the size of the Global Autonomous AI Powered Ophthalmology Screening Market in 2035?

The market size for the Global Autonomous AI Powered Ophthalmology Screening Market is projected to reach approximately USD 2,650.68 million by 2035.

How much will the Global Autonomous AI Powered Ophthalmology Screening Market grow between 2025 and 2035?

The Global Autonomous AI Powered Ophthalmology Screening Market is expected to grow at a CAGR of 8.9% between 2025 and 2035.

What are the key Technology in the Global Autonomous AI Powered Ophthalmology Screening Market?

The key Technology in the Global Autonomous AI Powered Ophthalmology Screening Market include Image-Based AI (Fundus), OCT-Based AI, Multi-Modal AI, Edge AI, Cloud-Based AI, Embedded AI in Cameras.

Which Indication type segment will contribute a significant share in the Global Autonomous AI Powered Ophthalmology Screening Market in 2025?

In terms of Indication, Diabetic Retinopathy (DR) is projected to command the highest share at 48.6% in the Global Autonomous AI Powered Ophthalmology Screening Market in 2025.

Explore Similar Insights

Future Market Insights

Autonomous AI Powered Ophthalmology Screening Market

Chat With

MaRIA

Hi There, I am MaRIA, Your Market Research Intelligence Assistant. How may I help you?