Reports

- Global Locations -

Headquarters

Future Market Insights, Inc.

Christiana Corporate, 200
Continental Drive, Suite 401,
Newark, Delaware - 19713,
United States

T: +1-845-579-5705

Americas

Future Market Insights, Inc.

616 Corporate Way, Suite 2-9018,
Valley Cottage, NY 10989, United States

T: +1-347-918-3531

MEA

Future Market Insights

1602-6 Jumeirah Bay X2 Tower, Plot No: JLT-PH2-X2A,
Jumeirah Lakes Towers, Dubai,
United Arab Emirates

Europe

Future Market Insights

3rd Floor, 207 Regent Street,
W1B 3HH London
United Kingdom

T: + 44 (0) 20 8123 9659
D: +44 (0) 20 3287 4268

Asia Pacific

Future Market Insights

IndiaLand Global Tech Park, Unit UG-1, Behind Grand HighStreet, Phase 1, Hinjawadi, MH, Pune – 411057, India

Autonomous Mobile Robots for Logistics and Warehousing Market Overview (2022 to 2032)

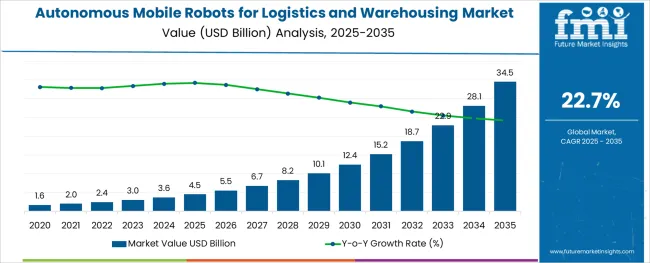
[250 Pages Report] The autonomous mobile robots for logistics and warehousing market is likely to register a CAGR of 22.7% during the forecast period and is anticipated to reach a market share of US$ ~17 Bn in 2032, from US$ 2.42 Bn in 2022.

The demand for supply chain management continues to rise as the major retail and e-commerce giants are expanding their business operations globally.

With this trend, there is a corresponding rise in demand for autonomous mobile robots for logistics and warehousing and sales of autonomous mobile robots for logistics and warehousing to fulfil logistics and delivery, which employs a large workforce to manage these services.

Attributes Details
Autonomous Mobile Robots for Logistics and Warehousing Market (CAGR) 22.7 %
Autonomous Mobile Robots for Logistics and Warehousing Market (2021) USD 1.97 billion
Autonomous Mobile Robots for Logistics and Warehousing Market (2032) USD ~17 billion

Manual labour is cost-intensive and involves huge investments for retailers. Hence, there has been a growing demand for autonomous mobile robots for logistics and warehousing applications.

The autonomous mobile robots (AMRs) deployment has drastically changed the logistics and warehousing landscape. Retailers are integrating these autonomous mobile robots into their traditional warehousing applications to automate the material handling processes.

These autonomous mobile robots are cost-effective as they drastically reduce the in-house transportation time, automate material handling with zero-defect production, improve safety and thus reduce the overall labour cost.

Don't pay for what you don't need

Customize your report by selecting specific countries or regions and save 30%!

What are the Key Drivers to the Autonomous Mobile Robots for Logistics and Warehousing Market Share?

“Increasing Demand for Logistics & Warehouse Automation”

A few years ago, the logistics and warehouse operations and processes were carried out manually, employing thousands of workers for material handling and carrying out in-house logistics operations.

As the supply-chain industry flourished globally in the past few years, there has been a huge demand for autonomous mobile robots for logistics and warehousing and sales of autonomous mobile robots for logistics and warehousing operations to improve order fulfilment and in-house distribution of goods with the ultimate goal to reduce the labour costs.

The adoption of autonomous mobile robots for logistics and warehousing has solved many problems posed by the booming supply-chain demands.

Autonomous mobile robots for logistics and warehousing manufacturers are collaborating with warehouse operations for automated inventory handling and movement, tracking and locating materials within the warehouse facilities, freeing the human workforce from such time-consuming processes and thus improving the material handling efficiency within the warehouses.
Which Region holds the Highest Growth Potential in the Autonomous Mobile Robots for Logistics and Warehousing Market?

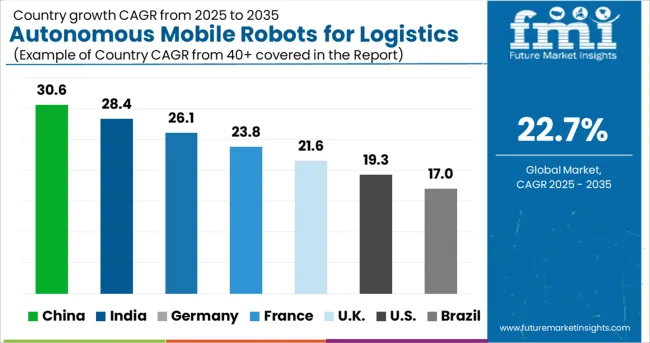
The Asia Pacific is estimated to be a highly lucrative region in autonomous mobile robots for logistics and warehousing market share. The autonomous mobile robots for logistics and warehousing market share and eCommerce are growing at a lightning pace within the Asia Pacific countries such as China, India, and South-East Asia.

The significant growth demand for autonomous mobile robots for logistics and warehousing’s massive investment into warehouse automation via the deployment of autonomous mobile robots fulfils the demand for the labour shortage and improves material handling operations to drive scalability, reliability, and efficiency.

In growing economies like India, the autonomous mobile robots for the logistics and warehousing market and the sales of autonomous mobile robots for logistics and warehousing are booming at an unprecedented rate and are estimated to attract nearly $10 billion in investments in the next 5 years. 

To address this huge investment and supply chain demand for autonomous mobile robots for logistics and warehousing, the logistics and warehouse operations are shifting from manual to automated operations through the deployment of sales of autonomous mobile robots for logistics and warehousing for effective material handling.

Sudip Saha
Sudip Saha

Principal Consultant

Talk to Analyst

Find your sweet spots for generating winning opportunities in this market.

Which Segment is showing a Rapid Growth in the Autonomous Mobile Robots for Logistics and Warehousing Market?

“Rapid growth in the e-commerce Industry globally.”

The e-commerce industry worldwide is growing at a breakneck pace. The global e-commerce sales of autonomous mobile robots for logistics and warehousing were valued at $2.4 trillion in 2017 and are estimated to be nearly $3.0 trillion by 2018, with US and China dominating the global e-commerce segment of autonomous mobile robots for the logistics and warehousing market. 

Due to this ever-growing e-commerce trend, retailers are facing challenges such as a shortage of labour for warehouse management, complicated order fulfilment processes, and more. Logistics and warehouse automation technologies such as autonomous mobile robots have made tremendous developments in recent years to overcome these supply-demand challenges.
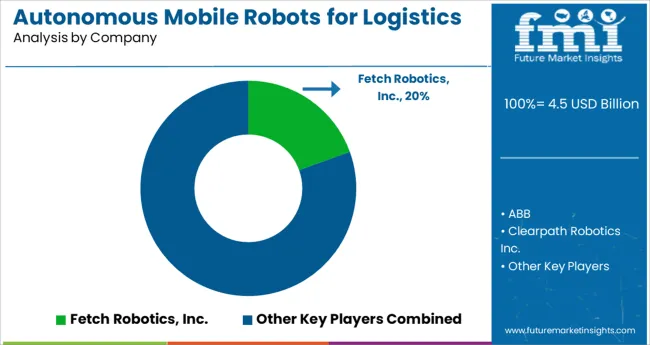
How is the Competitive Landscape in the Autonomous Mobile Robots for Logistics and Warehousing Market?

Key players in the autonomous mobile robots for logistics and warehousing market share are focusing on strategic collaboration and partnerships with major retailers as well as product innovations and developments for sustained business growth.

Get the data you need at a Fraction of the cost

Personalize your report by choosing insights you need
and save 40%!

Recent Developments

  • In 2019, inVia Robotics, a leading next-generation warehouse automation solutions provider, collaborated with Tobi, an international fashion online retailer, to deploy its inVia Picker autonomous mobile robot for automating the material handling within Tobi’s warehouses.
  • In 2019, Locus Robotics partnered with RightHand Robotics to provide cross-platform autonomous mobile robots for logistics and warehousing for high-volume order fulfilment.
  • In 2019, Prime Robotics, a leading manufacturer of autonomous mobile robots (AMR), collaborated with Fordist Group, a leading third-party logistics provider in Europe, to deploy its Mobile Shelf logistics robot system to provide scalability to warehouse operations with improved efficiency.
  • In 2018, Fetch Robotics, a leading developer and manufacturer of autonomous mobile robots partnered with Honeywell to deploy autonomous mobile robots into their warehousing operations to fulfil the growing volumes of ecommerce orders with high efficiency and productivity.

Report Scope

Report Attribute Details
Growth rate CAGR of 22.7% from 2022 to 2030
Base year for estimation 2021
Historical data 2015 - 2020
Forecast period 2022 - 2032
Quantitative units Revenue in USD Million and CAGR from 2022 to 2032
Report coverage Revenue forecast, volume forecast, company ranking, competitive landscape, growth factors, and trends, Pricing Analysis
Segments covered Product, application, region
Regional scope North America; Western Europe, Eastern Europe, Middle East, Africa, ASEAN, South Asia, Rest of Asia, Australia and New Zealand
Country scope U.S.; Canada; Mexico; Germany; U.K.; France; Italy; Spain; Russia; Belgium; Poland; Czech Republic; China; India; Japan; Australia; Brazil; Argentina; Colombia; Saudi Arabia; UAE; Iran; South Africa
Key companies profiled Kuka AG, Teradyne, Inc., Clearpath Robotics, Inc., Grey Orange Pte. Ltd., Swisslog Holding AG, K. Hartwall Oy AB, Boston Dynamics, Inc., Harvest Automation, Inc., inVia Robotics, Inc., and Omron Adept Technology, Inc.
Customization scope Free report customization (equivalent to up to 8 analysts working days) with purchase. Addition or alteration to country, regional & segment scope.
Pricing and purchase options Avail customized purchase options to meet your exact research needs.

KEY SEGMENTS

By Type, the Autonomous Mobile Robots for Logistics and Warehousing market is segmented into:

  • Autonomous Mobile Picking Robots
  • Automated Forklifts
  • Autonomous Inventory Robots
  • Aerial Inventory Robots

By Applications, the Autonomous Mobile Robots for Logistics and Warehousing market is segmented into:

  • Retail & eCommerce
  • Healthcare & Pharmaceuticals
  • Food & Beverages
  • Consumer Electronics
  • Automotive
  • Others

Frequently Asked Questions

What is the Growth Outlook for the Autonomous Mobile Robots for Logistics and Warehousing Market?

The autonomous mobile robots for logistics and warehousing market share are likely to register a CAGR of 22.7% during the forecast period.

Who are the Key Players in the Autonomous Mobile Robots for Logistics and Warehousing Market?

Key players holding substantial autonomous mobile robots for logistics and warehousing market share include Material Handling Systems., Fetch Robotics, Inc., IAM Robotics, NextShift Robotics, Stanley Robotics, Robotnik, SESTO Robotics, HAHN Robotics GmbH, Vecna Robotics, AutoGuide Mobile Robots, Robotics.

What is the Future of the Autonomous Mobile Robots for Logistics and Warehousing Market?

As per the analysis, the autonomous mobile robots for logistics and warehousing market share are likely to be US$ 8.7 Bn by 2032.

Which is the Key Driver in the Autonomous Mobile Robots for Logistics and Warehousing Market?

Due to the exponential growth of the sales of autonomous mobile robots for logistics and warehousing, warehouse and distribution centre operators may now focus on improving their operational workflow from manual to automate to satisfy shifting consumer buying trends.

Table of Content

1. Executive Summary

    1.1. Global Market Outlook

    1.2. Demand-side Trends

    1.3. Supply-side Trends

    1.4. Technology Roadmap Analysis

    1.5. Analysis and Recommendations

2. Market Overview

    2.1. Market Coverage / Taxonomy

    2.2. Market Definition / Scope / Limitations

3. Market Background

    3.1. Market Dynamics

        3.1.1. Drivers

        3.1.2. Restraints

        3.1.3. Opportunity

        3.1.4. Trends

    3.2. Scenario Forecast

        3.2.1. Demand in Optimistic Scenario

        3.2.2. Demand in Likely Scenario

        3.2.3. Demand in Conservative Scenario

    3.3. Opportunity Map Analysis

    3.4. Investment Feasibility Matrix

    3.5. Value Chain Analysis

        3.5.1. Profit Margin Analysis

        3.5.2. Service Providers

    3.6. PESTLE and Porter’s Analysis

    3.7. Regulatory Landscape

        3.7.1. By Key Regions

        3.7.2. By Key Countries

    3.8. Regional Parent Market Outlook

4. Global Autonomous Mobile Robots for Logistics and Warehousing Market Analysis 2017-2021 and Forecast, 2022-2032

    4.1. Historical Market Size Value (US$ Mn) Analysis, 2017-2021

    4.2. Current and Future Market Size Value (US$ Mn) Projections, 2022-2032

        4.2.1. Y-o-Y Growth Trend Analysis

        4.2.2. Absolute $ Opportunity Analysis

5. Global Autonomous Mobile Robots for Logistics and Warehousing Market Analysis 2017-2021 and Forecast 2022-2032, By Solution

    5.1. Introduction / Key Findings

    5.2. Historical Market Size Value (US$ Mn) Analysis By Solution, 2017-2021

    5.3. Current and Future Market Size Value (US$ Mn) Analysis and Forecast By Solution, 2022-2032

        5.3.1. Hardware

        5.3.2. Software

        5.3.3. Services

    5.4. Y-o-Y Growth Trend Analysis By Solution, 2017-2021

    5.5. Absolute $ Opportunity Analysis By Solution, 2022-2032

Deep-dive segmentation will be available in the sample on request

6. Global Autonomous Mobile Robots for Logistics and Warehousing Market Analysis 2017-2021 and Forecast 2022-2032, By Category

    6.1. Introduction / Key Findings

    6.2. Historical Market Size Value (US$ Mn) Analysis By Category, 2017-2021

    6.3. Current and Future Market Size Value (US$ Mn) Analysis and Forecast By Category, 2022-2032

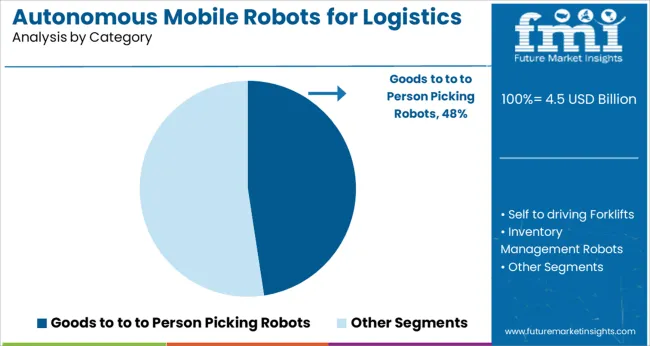
        6.3.1. Goods-to-Person Picking Robots

        6.3.2. Self-driving Forklifts

        6.3.3. Inventory Management Robots

        6.3.4. Unmanned Aerial Vehicles

        6.3.5. Data Collection Robots

    6.4. Y-o-Y Growth Trend Analysis By Category, 2017-2021

    6.5. Absolute $ Opportunity Analysis By Category, 2022-2032

Deep-dive segmentation will be available in the sample on request

7. Global Autonomous Mobile Robots for Logistics and Warehousing Market Analysis 2017-2021 and Forecast 2022-2032, By Application

    7.1. Introduction / Key Findings

    7.2. Historical Market Size Value (US$ Mn) Analysis By Application, 2017-2021

    7.3. Current and Future Market Size Value (US$ Mn) Analysis and Forecast By Application, 2022-2032

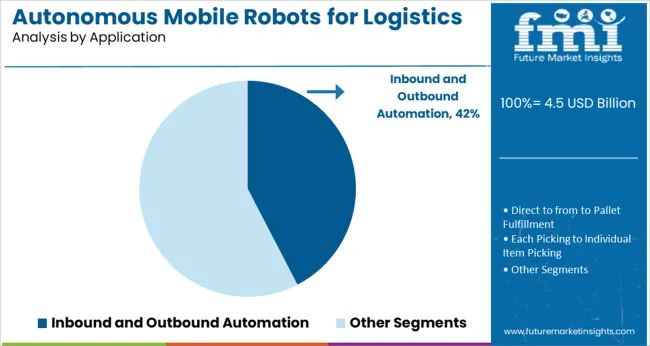
        7.3.1. Direct-from-Pallet Fulfillment

        7.3.2. Inbound and Outbound Automation

        7.3.3. Each Picking - Individual Item Picking

        7.3.4. Sortation

        7.3.5. Center Handling

        7.3.6. Induction of Palletized Goods

        7.3.7. Built to Order Pallet

        7.3.8. Order Fulfillment

        7.3.9. Robotic Truck Loading

        7.3.10. Reverse Logistics Handling

    7.4. Y-o-Y Growth Trend Analysis By Application, 2017-2021

    7.5. Absolute $ Opportunity Analysis By Application, 2022-2032

Deep-dive segmentation will be available in the sample on request

8. Global Autonomous Mobile Robots for Logistics and Warehousing Market Analysis 2017-2021 and Forecast 2022-2032, By End-use

    8.1. Introduction / Key Findings

    8.2. Historical Market Size Value (US$ Mn) Analysis By End-use, 2017-2021

    8.3. Current and Future Market Size Value (US$ Mn) Analysis and Forecast By End-use, 2022-2032

        8.3.1. Warehouses

        8.3.2. Fulfillment Centers

        8.3.3. Distribution Centers

        8.3.4. Fleet Management

    8.4. Y-o-Y Growth Trend Analysis By End-use, 2017-2021

    8.5. Absolute $ Opportunity Analysis By End-use, 2022-2032

Deep-dive segmentation will be available in the sample on request

9. Global Autonomous Mobile Robots for Logistics and Warehousing Market Analysis 2017-2021 and Forecast 2022-2032, By Region

    9.1. Introduction

    9.2. Historical Market Size Value (US$ Mn) Analysis By Region, 2017-2021

    9.3. Current Market Size Value (US$ Mn) Analysis and Forecast By Region, 2022-2032

        9.3.1. North America

        9.3.2. Latin America

        9.3.3. Europe

        9.3.4. East Asia

        9.3.5. South Asia & Pacific

        9.3.6. MEA

    9.4. Market Attractiveness Analysis By Region

10. North America Autonomous Mobile Robots for Logistics and Warehousing Market Analysis 2017-2021 and Forecast 2022-2032, By Country

    10.1. Historical Market Size Value (US$ Mn) Trend Analysis By Market Taxonomy, 2017-2021

    10.2. Market Size Value (US$ Mn) Forecast By Market Taxonomy, 2022-2032

        10.2.1. By Country

            10.2.1.1. U.S.

            10.2.1.2. Canada

        10.2.2. By Solution

        10.2.3. By Category

        10.2.4. By Application

        10.2.5. By End-use

    10.3. Market Attractiveness Analysis

        10.3.1. By Country

        10.3.2. By Solution

        10.3.3. By Category

        10.3.4. By Application

        10.3.5. By End-use

    10.4. Key Takeaways

11. Latin America Autonomous Mobile Robots for Logistics and Warehousing Market Analysis 2017-2021 and Forecast 2022-2032, By Country

    11.1. Historical Market Size Value (US$ Mn) Trend Analysis By Market Taxonomy, 2017-2021

    11.2. Market Size Value (US$ Mn) Forecast By Market Taxonomy, 2022-2032

        11.2.1. By Country

            11.2.1.1. Mexico

            11.2.1.2. Brazil

            11.2.1.3. Rest of Latin America

        11.2.2. By Solution

        11.2.3. By Category

        11.2.4. By Application

        11.2.5. By End-use

    11.3. Market Attractiveness Analysis

        11.3.1. By Country

        11.3.2. By Solution

        11.3.3. By Category

        11.3.4. By Application

        11.3.5. By End-use

    11.4. Key Takeaways

12. Europe Autonomous Mobile Robots for Logistics and Warehousing Market Analysis 2017-2021 and Forecast 2022-2032, By Country

    12.1. Historical Market Size Value (US$ Mn) Trend Analysis By Market Taxonomy, 2017-2021

    12.2. Market Size Value (US$ Mn) Forecast By Market Taxonomy, 2022-2032

        12.2.1. By Country

            12.2.1.1. Germany

            12.2.1.2. Italy

            12.2.1.3. France

            12.2.1.4. U.K.

            12.2.1.5. Spain

            12.2.1.6. BENELUX

            12.2.1.7. Russia

            12.2.1.8. Rest of Europe

        12.2.2. By Solution

        12.2.3. By Category

        12.2.4. By Application

        12.2.5. By End-use

    12.3. Market Attractiveness Analysis

        12.3.1. By Country

        12.3.2. By Solution

        12.3.3. By Category

        12.3.4. By Application

        12.3.5. By End-use

    12.4. Key Takeaways

13. East Asia Autonomous Mobile Robots for Logistics and Warehousing Market Analysis 2017-2021 and Forecast 2022-2032, By Country

    13.1. Historical Market Size Value (US$ Mn) Trend Analysis By Market Taxonomy, 2017-2021

    13.2. Market Size Value (US$ Mn) Forecast By Market Taxonomy, 2022-2032

        13.2.1. By Country

            13.2.1.1. China

            13.2.1.2. Japan

            13.2.1.3. South Korea

        13.2.2. By Solution

        13.2.3. By Category

        13.2.4. By Application

        13.2.5. By End-use

    13.3. Market Attractiveness Analysis

        13.3.1. By Country

        13.3.2. By Solution

        13.3.3. By Category

        13.3.4. By Application

        13.3.5. By End-use

    13.4. Key Takeaways

14. South Asia & Pacific Autonomous Mobile Robots for Logistics and Warehousing Market Analysis 2017-2021 and Forecast 2022-2032, By Country

    14.1. Historical Market Size Value (US$ Mn) Trend Analysis By Market Taxonomy, 2017-2021

    14.2. Market Size Value (US$ Mn) Forecast By Market Taxonomy, 2022-2032

        14.2.1. By Country

            14.2.1.1. India

            14.2.1.2. ASEAN

            14.2.1.3. Australia and New Zealand

            14.2.1.4. Rest of South Asia & Pacific

        14.2.2. By Solution

        14.2.3. By Category

        14.2.4. By Application

        14.2.5. By End-use

    14.3. Market Attractiveness Analysis

        14.3.1. By Country

        14.3.2. By Solution

        14.3.3. By Category

        14.3.4. By Application

        14.3.5. By End-use

    14.4. Key Takeaways

15. MEA Autonomous Mobile Robots for Logistics and Warehousing Market Analysis 2017-2021 and Forecast 2022-2032, By Country

    15.1. Historical Market Size Value (US$ Mn) Trend Analysis By Market Taxonomy, 2017-2021

    15.2. Market Size Value (US$ Mn) Forecast By Market Taxonomy, 2022-2032

        15.2.1. By Country

            15.2.1.1. GCC Countries

            15.2.1.2. Turkey

            15.2.1.3. South Africa

            15.2.1.4. Rest of MEA

        15.2.2. By Solution

        15.2.3. By Category

        15.2.4. By Application

        15.2.5. By End-use

    15.3. Market Attractiveness Analysis

        15.3.1. By Country

        15.3.2. By Solution

        15.3.3. By Category

        15.3.4. By Application

        15.3.5. By End-use

    15.4. Key Takeaways

16. Key Countries Autonomous Mobile Robots for Logistics and Warehousing Market Analysis

    16.1. U.S.

        16.1.1. Pricing Analysis

        16.1.2. Market Share Analysis, 2021

            16.1.2.1. By Solution

            16.1.2.2. By Category

            16.1.2.3. By Application

            16.1.2.4. By End-use

    16.2. Canada

        16.2.1. Pricing Analysis

        16.2.2. Market Share Analysis, 2021

            16.2.2.1. By Solution

            16.2.2.2. By Category

            16.2.2.3. By Application

            16.2.2.4. By End-use

    16.3. Mexico

        16.3.1. Pricing Analysis

        16.3.2. Market Share Analysis, 2021

            16.3.2.1. By Solution

            16.3.2.2. By Category

            16.3.2.3. By Application

            16.3.2.4. By End-use

    16.4. Brazil

        16.4.1. Pricing Analysis

        16.4.2. Market Share Analysis, 2021

            16.4.2.1. By Solution

            16.4.2.2. By Category

            16.4.2.3. By Application

            16.4.2.4. By End-use

    16.5. Germany

        16.5.1. Pricing Analysis

        16.5.2. Market Share Analysis, 2021

            16.5.2.1. By Solution

            16.5.2.2. By Category

            16.5.2.3. By Application

            16.5.2.4. By End-use

    16.6. Italy

        16.6.1. Pricing Analysis

        16.6.2. Market Share Analysis, 2021

            16.6.2.1. By Solution

            16.6.2.2. By Category

            16.6.2.3. By Application

            16.6.2.4. By End-use

    16.7. France

        16.7.1. Pricing Analysis

        16.7.2. Market Share Analysis, 2021

            16.7.2.1. By Solution

            16.7.2.2. By Category

            16.7.2.3. By Application

            16.7.2.4. By End-use

    16.8. U.K.

        16.8.1. Pricing Analysis

        16.8.2. Market Share Analysis, 2021

            16.8.2.1. By Solution

            16.8.2.2. By Category

            16.8.2.3. By Application

            16.8.2.4. By End-use

    16.9. Spain

        16.9.1. Pricing Analysis

        16.9.2. Market Share Analysis, 2021

            16.9.2.1. By Solution

            16.9.2.2. By Category

            16.9.2.3. By Application

            16.9.2.4. By End-use

    16.10. BENELUX

        16.10.1. Pricing Analysis

        16.10.2. Market Share Analysis, 2021

            16.10.2.1. By Solution

            16.10.2.2. By Category

            16.10.2.3. By Application

            16.10.2.4. By End-use

    16.11. Russia

        16.11.1. Pricing Analysis

        16.11.2. Market Share Analysis, 2021

            16.11.2.1. By Solution

            16.11.2.2. By Category

            16.11.2.3. By Application

            16.11.2.4. By End-use

    16.12. China

        16.12.1. Pricing Analysis

        16.12.2. Market Share Analysis, 2021

            16.12.2.1. By Solution

            16.12.2.2. By Category

            16.12.2.3. By Application

            16.12.2.4. By End-use

    16.13. Japan

        16.13.1. Pricing Analysis

        16.13.2. Market Share Analysis, 2021

            16.13.2.1. By Solution

            16.13.2.2. By Category

            16.13.2.3. By Application

            16.13.2.4. By End-use

    16.14. South Korea

        16.14.1. Pricing Analysis

        16.14.2. Market Share Analysis, 2021

            16.14.2.1. By Solution

            16.14.2.2. By Category

            16.14.2.3. By Application

            16.14.2.4. By End-use

    16.15. India

        16.15.1. Pricing Analysis

        16.15.2. Market Share Analysis, 2021

            16.15.2.1. By Solution

            16.15.2.2. By Category

            16.15.2.3. By Application

            16.15.2.4. By End-use

    16.16. ASEAN

        16.16.1. Pricing Analysis

        16.16.2. Market Share Analysis, 2021

            16.16.2.1. By Solution

            16.16.2.2. By Category

            16.16.2.3. By Application

            16.16.2.4. By End-use

    16.17. Australia and New Zealand

        16.17.1. Pricing Analysis

        16.17.2. Market Share Analysis, 2021

            16.17.2.1. By Solution

            16.17.2.2. By Category

            16.17.2.3. By Application

            16.17.2.4. By End-use

    16.18. GCC Countries

        16.18.1. Pricing Analysis

        16.18.2. Market Share Analysis, 2021

            16.18.2.1. By Solution

            16.18.2.2. By Category

            16.18.2.3. By Application

            16.18.2.4. By End-use

    16.19. Turkey

        16.19.1. Pricing Analysis

        16.19.2. Market Share Analysis, 2021

            16.19.2.1. By Solution

            16.19.2.2. By Category

            16.19.2.3. By Application

            16.19.2.4. By End-use

    16.20. South Africa

        16.20.1. Pricing Analysis

        16.20.2. Market Share Analysis, 2021

            16.20.2.1. By Solution

            16.20.2.2. By Category

            16.20.2.3. By Application

            16.20.2.4. By End-use

17. Market Structure Analysis

    17.1. Competition Dashboard

    17.2. Competition Benchmarking

    17.3. Market Share Analysis of Top Players

        17.3.1. By Regional

        17.3.2. By Solution

        17.3.3. By Category

        17.3.4. By Application

        17.3.5. By End-use

18. Competition Analysis

    18.1. Competition Deep Dive

        18.1.1. Fetch Robotics, Inc.

            18.1.1.1. Overview

            18.1.1.2. Product Portfolio

            18.1.1.3. Profitability by Market Segments

            18.1.1.4. Sales Footprint

            18.1.1.5. Strategy Overview

                18.1.1.5.1. Marketing Strategy

                18.1.1.5.2. Product Strategy

                18.1.1.5.3. Channel Strategy

        18.1.2. ABB

            18.1.2.1. Overview

            18.1.2.2. Product Portfolio

            18.1.2.3. Profitability by Market Segments

            18.1.2.4. Sales Footprint

            18.1.2.5. Strategy Overview

                18.1.2.5.1. Marketing Strategy

                18.1.2.5.2. Product Strategy

                18.1.2.5.3. Channel Strategy

        18.1.3. Clearpath Robotics Inc.

            18.1.3.1. Overview

            18.1.3.2. Product Portfolio

            18.1.3.3. Profitability by Market Segments

            18.1.3.4. Sales Footprint

            18.1.3.5. Strategy Overview

                18.1.3.5.1. Marketing Strategy

                18.1.3.5.2. Product Strategy

                18.1.3.5.3. Channel Strategy

        18.1.4. Robotnik

            18.1.4.1. Overview

            18.1.4.2. Product Portfolio

            18.1.4.3. Profitability by Market Segments

            18.1.4.4. Sales Footprint

            18.1.4.5. Strategy Overview

                18.1.4.5.1. Marketing Strategy

                18.1.4.5.2. Product Strategy

                18.1.4.5.3. Channel Strategy

        18.1.5. Denso Robotics

            18.1.5.1. Overview

            18.1.5.2. Product Portfolio

            18.1.5.3. Profitability by Market Segments

            18.1.5.4. Sales Footprint

            18.1.5.5. Strategy Overview

                18.1.5.5.1. Marketing Strategy

                18.1.5.5.2. Product Strategy

                18.1.5.5.3. Channel Strategy

        18.1.6. Daifuku Co., Ltd.

            18.1.6.1. Overview

            18.1.6.2. Product Portfolio

            18.1.6.3. Profitability by Market Segments

            18.1.6.4. Sales Footprint

            18.1.6.5. Strategy Overview

                18.1.6.5.1. Marketing Strategy

                18.1.6.5.2. Product Strategy

                18.1.6.5.3. Channel Strategy

        18.1.7. FANUC Corporation

            18.1.7.1. Overview

            18.1.7.2. Product Portfolio

            18.1.7.3. Profitability by Market Segments

            18.1.7.4. Sales Footprint

            18.1.7.5. Strategy Overview

                18.1.7.5.1. Marketing Strategy

                18.1.7.5.2. Product Strategy

                18.1.7.5.3. Channel Strategy

        18.1.8. Hitachi Transport System, Ltd.

            18.1.8.1. Overview

            18.1.8.2. Product Portfolio

            18.1.8.3. Profitability by Market Segments

            18.1.8.4. Sales Footprint

            18.1.8.5. Strategy Overview

                18.1.8.5.1. Marketing Strategy

                18.1.8.5.2. Product Strategy

                18.1.8.5.3. Channel Strategy

        18.1.9. Jungheinrich AG

            18.1.9.1. Overview

            18.1.9.2. Product Portfolio

            18.1.9.3. Profitability by Market Segments

            18.1.9.4. Sales Footprint

            18.1.9.5. Strategy Overview

                18.1.9.5.1. Marketing Strategy

                18.1.9.5.2. Product Strategy

                18.1.9.5.3. Channel Strategy

        18.1.10. Kawasaki Heavy Industries, Ltd.

            18.1.10.1. Overview

            18.1.10.2. Product Portfolio

            18.1.10.3. Profitability by Market Segments

            18.1.10.4. Sales Footprint

            18.1.10.5. Strategy Overview

                18.1.10.5.1. Marketing Strategy

                18.1.10.5.2. Product Strategy

                18.1.10.5.3. Channel Strategy

        18.1.11. KION GROUP AG

            18.1.11.1. Overview

            18.1.11.2. Product Portfolio

            18.1.11.3. Profitability by Market Segments

            18.1.11.4. Sales Footprint

            18.1.11.5. Strategy Overview

                18.1.11.5.1. Marketing Strategy

                18.1.11.5.2. Product Strategy

                18.1.11.5.3. Channel Strategy

        18.1.12. Krones AG

            18.1.12.1. Overview

            18.1.12.2. Product Portfolio

            18.1.12.3. Profitability by Market Segments

            18.1.12.4. Sales Footprint

            18.1.12.5. Strategy Overview

                18.1.12.5.1. Marketing Strategy

                18.1.12.5.2. Product Strategy

                18.1.12.5.3. Channel Strategy

        18.1.13. KUKA AG

            18.1.13.1. Overview

            18.1.13.2. Product Portfolio

            18.1.13.3. Profitability by Market Segments

            18.1.13.4. Sales Footprint

            18.1.13.5. Strategy Overview

                18.1.13.5.1. Marketing Strategy

                18.1.13.5.2. Product Strategy

                18.1.13.5.3. Channel Strategy

        18.1.14. Mitsubishi Electric Corporation

            18.1.14.1. Overview

            18.1.14.2. Product Portfolio

            18.1.14.3. Profitability by Market Segments

            18.1.14.4. Sales Footprint

            18.1.14.5. Strategy Overview

                18.1.14.5.1. Marketing Strategy

                18.1.14.5.2. Product Strategy

                18.1.14.5.3. Channel Strategy

        18.1.15. Murata Machinery, Ltd.

            18.1.15.1. Overview

            18.1.15.2. Product Portfolio

            18.1.15.3. Profitability by Market Segments

            18.1.15.4. Sales Footprint

            18.1.15.5. Strategy Overview

                18.1.15.5.1. Marketing Strategy

                18.1.15.5.2. Product Strategy

                18.1.15.5.3. Channel Strategy

        18.1.16. Omron Corporation

            18.1.16.1. Overview

            18.1.16.2. Product Portfolio

            18.1.16.3. Profitability by Market Segments

            18.1.16.4. Sales Footprint

            18.1.16.5. Strategy Overview

                18.1.16.5.1. Marketing Strategy

                18.1.16.5.2. Product Strategy

                18.1.16.5.3. Channel Strategy

        18.1.17. SSI Schaefer

            18.1.17.1. Overview

            18.1.17.2. Product Portfolio

            18.1.17.3. Profitability by Market Segments

            18.1.17.4. Sales Footprint

            18.1.17.5. Strategy Overview

                18.1.17.5.1. Marketing Strategy

                18.1.17.5.2. Product Strategy

                18.1.17.5.3. Channel Strategy

        18.1.18. Swisslog Holding AG

            18.1.18.1. Overview

            18.1.18.2. Product Portfolio

            18.1.18.3. Profitability by Market Segments

            18.1.18.4. Sales Footprint

            18.1.18.5. Strategy Overview

                18.1.18.5.1. Marketing Strategy

                18.1.18.5.2. Product Strategy

                18.1.18.5.3. Channel Strategy

        18.1.19. Toyota Material Handling

            18.1.19.1. Overview

            18.1.19.2. Product Portfolio

            18.1.19.3. Profitability by Market Segments

            18.1.19.4. Sales Footprint

            18.1.19.5. Strategy Overview

                18.1.19.5.1. Marketing Strategy

                18.1.19.5.2. Product Strategy

                18.1.19.5.3. Channel Strategy

        18.1.20. Vanderlande Industries

            18.1.20.1. Overview

            18.1.20.2. Product Portfolio

            18.1.20.3. Profitability by Market Segments

            18.1.20.4. Sales Footprint

            18.1.20.5. Strategy Overview

                18.1.20.5.1. Marketing Strategy

                18.1.20.5.2. Product Strategy

                18.1.20.5.3. Channel Strategy

19. Assumptions & Acronyms Used

20. Research Methodology

List of Tables

Table 1: Global Autonomous Mobile Robots for Logistics and Warehousing Market Value (US$ Mn) Forecast by Region, 2017-2032

Table 2: Global Autonomous Mobile Robots for Logistics and Warehousing Market Value (US$ Mn) Forecast by Solution, 2017-2032

Table 3: Global Autonomous Mobile Robots for Logistics and Warehousing Market Value (US$ Mn) Forecast by Category, 2017-2032

Table 4: Global Autonomous Mobile Robots for Logistics and Warehousing Market Value (US$ Mn) Forecast by Application, 2017-2032

Table 5: Global Autonomous Mobile Robots for Logistics and Warehousing Market Value (US$ Mn) Forecast by End-use, 2017-2032

Table 6: North America Autonomous Mobile Robots for Logistics and Warehousing Market Value (US$ Mn) Forecast by Country, 2017-2032

Table 7: North America Autonomous Mobile Robots for Logistics and Warehousing Market Value (US$ Mn) Forecast by Solution, 2017-2032

Table 8: North America Autonomous Mobile Robots for Logistics and Warehousing Market Value (US$ Mn) Forecast by Category, 2017-2032

Table 9: North America Autonomous Mobile Robots for Logistics and Warehousing Market Value (US$ Mn) Forecast by Application, 2017-2032

Table 10: North America Autonomous Mobile Robots for Logistics and Warehousing Market Value (US$ Mn) Forecast by End-use, 2017-2032

Table 11: Latin America Autonomous Mobile Robots for Logistics and Warehousing Market Value (US$ Mn) Forecast by Country, 2017-2032

Table 12: Latin America Autonomous Mobile Robots for Logistics and Warehousing Market Value (US$ Mn) Forecast by Solution, 2017-2032

Table 13: Latin America Autonomous Mobile Robots for Logistics and Warehousing Market Value (US$ Mn) Forecast by Category, 2017-2032

Table 14: Latin America Autonomous Mobile Robots for Logistics and Warehousing Market Value (US$ Mn) Forecast by Application, 2017-2032

Table 15: Latin America Autonomous Mobile Robots for Logistics and Warehousing Market Value (US$ Mn) Forecast by End-use, 2017-2032

Table 16: Europe Autonomous Mobile Robots for Logistics and Warehousing Market Value (US$ Mn) Forecast by Country, 2017-2032

Table 17: Europe Autonomous Mobile Robots for Logistics and Warehousing Market Value (US$ Mn) Forecast by Solution, 2017-2032

Table 18: Europe Autonomous Mobile Robots for Logistics and Warehousing Market Value (US$ Mn) Forecast by Category, 2017-2032

Table 19: Europe Autonomous Mobile Robots for Logistics and Warehousing Market Value (US$ Mn) Forecast by Application, 2017-2032

Table 20: Europe Autonomous Mobile Robots for Logistics and Warehousing Market Value (US$ Mn) Forecast by End-use, 2017-2032

Table 21: East Asia Autonomous Mobile Robots for Logistics and Warehousing Market Value (US$ Mn) Forecast by Country, 2017-2032

Table 22: East Asia Autonomous Mobile Robots for Logistics and Warehousing Market Value (US$ Mn) Forecast by Solution, 2017-2032

Table 23: East Asia Autonomous Mobile Robots for Logistics and Warehousing Market Value (US$ Mn) Forecast by Category, 2017-2032

Table 24: East Asia Autonomous Mobile Robots for Logistics and Warehousing Market Value (US$ Mn) Forecast by Application, 2017-2032

Table 25: East Asia Autonomous Mobile Robots for Logistics and Warehousing Market Value (US$ Mn) Forecast by End-use, 2017-2032

Table 26: South Asia & Pacific Autonomous Mobile Robots for Logistics and Warehousing Market Value (US$ Mn) Forecast by Country, 2017-2032

Table 27: South Asia & Pacific Autonomous Mobile Robots for Logistics and Warehousing Market Value (US$ Mn) Forecast by Solution, 2017-2032

Table 28: South Asia & Pacific Autonomous Mobile Robots for Logistics and Warehousing Market Value (US$ Mn) Forecast by Category, 2017-2032

Table 29: South Asia & Pacific Autonomous Mobile Robots for Logistics and Warehousing Market Value (US$ Mn) Forecast by Application, 2017-2032

Table 30: South Asia & Pacific Autonomous Mobile Robots for Logistics and Warehousing Market Value (US$ Mn) Forecast by End-use, 2017-2032

Table 31: MEA Autonomous Mobile Robots for Logistics and Warehousing Market Value (US$ Mn) Forecast by Country, 2017-2032

Table 32: MEA Autonomous Mobile Robots for Logistics and Warehousing Market Value (US$ Mn) Forecast by Solution, 2017-2032

Table 33: MEA Autonomous Mobile Robots for Logistics and Warehousing Market Value (US$ Mn) Forecast by Category, 2017-2032

Table 34: MEA Autonomous Mobile Robots for Logistics and Warehousing Market Value (US$ Mn) Forecast by Application, 2017-2032

Table 35: MEA Autonomous Mobile Robots for Logistics and Warehousing Market Value (US$ Mn) Forecast by End-use, 2017-2032

List of Charts

Figure 1: Global Autonomous Mobile Robots for Logistics and Warehousing Market Value (US$ Mn) by Solution, 2022-2032

Figure 2: Global Autonomous Mobile Robots for Logistics and Warehousing Market Value (US$ Mn) by Category, 2022-2032

Figure 3: Global Autonomous Mobile Robots for Logistics and Warehousing Market Value (US$ Mn) by Application, 2022-2032

Figure 4: Global Autonomous Mobile Robots for Logistics and Warehousing Market Value (US$ Mn) by End-use, 2022-2032

Figure 5: Global Autonomous Mobile Robots for Logistics and Warehousing Market Value (US$ Mn) by Region, 2022-2032

Figure 6: Global Autonomous Mobile Robots for Logistics and Warehousing Market Value (US$ Mn) Analysis by Region, 2017-2032

Figure 7: Global Autonomous Mobile Robots for Logistics and Warehousing Market Value Share (%) and BPS Analysis by Region, 2022-2032

Figure 8: Global Autonomous Mobile Robots for Logistics and Warehousing Market Y-o-Y Growth (%) Projections by Region, 2022-2032

Figure 9: Global Autonomous Mobile Robots for Logistics and Warehousing Market Value (US$ Mn) Analysis by Solution, 2017-2032

Figure 10: Global Autonomous Mobile Robots for Logistics and Warehousing Market Value Share (%) and BPS Analysis by Solution, 2022-2032

Figure 11: Global Autonomous Mobile Robots for Logistics and Warehousing Market Y-o-Y Growth (%) Projections by Solution, 2022-2032

Figure 12: Global Autonomous Mobile Robots for Logistics and Warehousing Market Value (US$ Mn) Analysis by Category, 2017-2032

Figure 13: Global Autonomous Mobile Robots for Logistics and Warehousing Market Value Share (%) and BPS Analysis by Category, 2022-2032

Figure 14: Global Autonomous Mobile Robots for Logistics and Warehousing Market Y-o-Y Growth (%) Projections by Category, 2022-2032

Figure 15: Global Autonomous Mobile Robots for Logistics and Warehousing Market Value (US$ Mn) Analysis by Application, 2017-2032

Figure 16: Global Autonomous Mobile Robots for Logistics and Warehousing Market Value Share (%) and BPS Analysis by Application, 2022-2032

Figure 17: Global Autonomous Mobile Robots for Logistics and Warehousing Market Y-o-Y Growth (%) Projections by Application, 2022-2032

Figure 18: Global Autonomous Mobile Robots for Logistics and Warehousing Market Value (US$ Mn) Analysis by End-use, 2017-2032

Figure 19: Global Autonomous Mobile Robots for Logistics and Warehousing Market Value Share (%) and BPS Analysis by End-use, 2022-2032

Figure 20: Global Autonomous Mobile Robots for Logistics and Warehousing Market Y-o-Y Growth (%) Projections by End-use, 2022-2032

Figure 21: Global Autonomous Mobile Robots for Logistics and Warehousing Market Attractiveness by Solution, 2022-2032

Figure 22: Global Autonomous Mobile Robots for Logistics and Warehousing Market Attractiveness by Category, 2022-2032

Figure 23: Global Autonomous Mobile Robots for Logistics and Warehousing Market Attractiveness by Application, 2022-2032

Figure 24: Global Autonomous Mobile Robots for Logistics and Warehousing Market Attractiveness by End-use, 2022-2032

Figure 25: Global Autonomous Mobile Robots for Logistics and Warehousing Market Attractiveness by Region, 2022-2032

Figure 26: North America Autonomous Mobile Robots for Logistics and Warehousing Market Value (US$ Mn) by Solution, 2022-2032

Figure 27: North America Autonomous Mobile Robots for Logistics and Warehousing Market Value (US$ Mn) by Category, 2022-2032

Figure 28: North America Autonomous Mobile Robots for Logistics and Warehousing Market Value (US$ Mn) by Application, 2022-2032

Figure 29: North America Autonomous Mobile Robots for Logistics and Warehousing Market Value (US$ Mn) by End-use, 2022-2032

Figure 30: North America Autonomous Mobile Robots for Logistics and Warehousing Market Value (US$ Mn) by Country, 2022-2032

Figure 31: North America Autonomous Mobile Robots for Logistics and Warehousing Market Value (US$ Mn) Analysis by Country, 2017-2032

Figure 32: North America Autonomous Mobile Robots for Logistics and Warehousing Market Value Share (%) and BPS Analysis by Country, 2022-2032

Figure 33: North America Autonomous Mobile Robots for Logistics and Warehousing Market Y-o-Y Growth (%) Projections by Country, 2022-2032

Figure 34: North America Autonomous Mobile Robots for Logistics and Warehousing Market Value (US$ Mn) Analysis by Solution, 2017-2032

Figure 35: North America Autonomous Mobile Robots for Logistics and Warehousing Market Value Share (%) and BPS Analysis by Solution, 2022-2032

Figure 36: North America Autonomous Mobile Robots for Logistics and Warehousing Market Y-o-Y Growth (%) Projections by Solution, 2022-2032

Figure 37: North America Autonomous Mobile Robots for Logistics and Warehousing Market Value (US$ Mn) Analysis by Category, 2017-2032

Figure 38: North America Autonomous Mobile Robots for Logistics and Warehousing Market Value Share (%) and BPS Analysis by Category, 2022-2032

Figure 39: North America Autonomous Mobile Robots for Logistics and Warehousing Market Y-o-Y Growth (%) Projections by Category, 2022-2032

Figure 40: North America Autonomous Mobile Robots for Logistics and Warehousing Market Value (US$ Mn) Analysis by Application, 2017-2032

Figure 41: North America Autonomous Mobile Robots for Logistics and Warehousing Market Value Share (%) and BPS Analysis by Application, 2022-2032

Figure 42: North America Autonomous Mobile Robots for Logistics and Warehousing Market Y-o-Y Growth (%) Projections by Application, 2022-2032

Figure 43: North America Autonomous Mobile Robots for Logistics and Warehousing Market Value (US$ Mn) Analysis by End-use, 2017-2032

Figure 44: North America Autonomous Mobile Robots for Logistics and Warehousing Market Value Share (%) and BPS Analysis by End-use, 2022-2032

Figure 45: North America Autonomous Mobile Robots for Logistics and Warehousing Market Y-o-Y Growth (%) Projections by End-use, 2022-2032

Figure 46: North America Autonomous Mobile Robots for Logistics and Warehousing Market Attractiveness by Solution, 2022-2032

Figure 47: North America Autonomous Mobile Robots for Logistics and Warehousing Market Attractiveness by Category, 2022-2032

Figure 48: North America Autonomous Mobile Robots for Logistics and Warehousing Market Attractiveness by Application, 2022-2032

Figure 49: North America Autonomous Mobile Robots for Logistics and Warehousing Market Attractiveness by End-use, 2022-2032

Figure 50: North America Autonomous Mobile Robots for Logistics and Warehousing Market Attractiveness by Country, 2022-2032

Figure 51: Latin America Autonomous Mobile Robots for Logistics and Warehousing Market Value (US$ Mn) by Solution, 2022-2032

Figure 52: Latin America Autonomous Mobile Robots for Logistics and Warehousing Market Value (US$ Mn) by Category, 2022-2032

Figure 53: Latin America Autonomous Mobile Robots for Logistics and Warehousing Market Value (US$ Mn) by Application, 2022-2032

Figure 54: Latin America Autonomous Mobile Robots for Logistics and Warehousing Market Value (US$ Mn) by End-use, 2022-2032

Figure 55: Latin America Autonomous Mobile Robots for Logistics and Warehousing Market Value (US$ Mn) by Country, 2022-2032

Figure 56: Latin America Autonomous Mobile Robots for Logistics and Warehousing Market Value (US$ Mn) Analysis by Country, 2017-2032

Figure 57: Latin America Autonomous Mobile Robots for Logistics and Warehousing Market Value Share (%) and BPS Analysis by Country, 2022-2032

Figure 58: Latin America Autonomous Mobile Robots for Logistics and Warehousing Market Y-o-Y Growth (%) Projections by Country, 2022-2032

Figure 59: Latin America Autonomous Mobile Robots for Logistics and Warehousing Market Value (US$ Mn) Analysis by Solution, 2017-2032

Figure 60: Latin America Autonomous Mobile Robots for Logistics and Warehousing Market Value Share (%) and BPS Analysis by Solution, 2022-2032

Figure 61: Latin America Autonomous Mobile Robots for Logistics and Warehousing Market Y-o-Y Growth (%) Projections by Solution, 2022-2032

Figure 62: Latin America Autonomous Mobile Robots for Logistics and Warehousing Market Value (US$ Mn) Analysis by Category, 2017-2032

Figure 63: Latin America Autonomous Mobile Robots for Logistics and Warehousing Market Value Share (%) and BPS Analysis by Category, 2022-2032

Figure 64: Latin America Autonomous Mobile Robots for Logistics and Warehousing Market Y-o-Y Growth (%) Projections by Category, 2022-2032

Figure 65: Latin America Autonomous Mobile Robots for Logistics and Warehousing Market Value (US$ Mn) Analysis by Application, 2017-2032

Figure 66: Latin America Autonomous Mobile Robots for Logistics and Warehousing Market Value Share (%) and BPS Analysis by Application, 2022-2032

Figure 67: Latin America Autonomous Mobile Robots for Logistics and Warehousing Market Y-o-Y Growth (%) Projections by Application, 2022-2032

Figure 68: Latin America Autonomous Mobile Robots for Logistics and Warehousing Market Value (US$ Mn) Analysis by End-use, 2017-2032

Figure 69: Latin America Autonomous Mobile Robots for Logistics and Warehousing Market Value Share (%) and BPS Analysis by End-use, 2022-2032

Figure 70: Latin America Autonomous Mobile Robots for Logistics and Warehousing Market Y-o-Y Growth (%) Projections by End-use, 2022-2032

Figure 71: Latin America Autonomous Mobile Robots for Logistics and Warehousing Market Attractiveness by Solution, 2022-2032

Figure 72: Latin America Autonomous Mobile Robots for Logistics and Warehousing Market Attractiveness by Category, 2022-2032

Figure 73: Latin America Autonomous Mobile Robots for Logistics and Warehousing Market Attractiveness by Application, 2022-2032

Figure 74: Latin America Autonomous Mobile Robots for Logistics and Warehousing Market Attractiveness by End-use, 2022-2032

Figure 75: Latin America Autonomous Mobile Robots for Logistics and Warehousing Market Attractiveness by Country, 2022-2032

Figure 76: Europe Autonomous Mobile Robots for Logistics and Warehousing Market Value (US$ Mn) by Solution, 2022-2032

Figure 77: Europe Autonomous Mobile Robots for Logistics and Warehousing Market Value (US$ Mn) by Category, 2022-2032

Figure 78: Europe Autonomous Mobile Robots for Logistics and Warehousing Market Value (US$ Mn) by Application, 2022-2032

Figure 79: Europe Autonomous Mobile Robots for Logistics and Warehousing Market Value (US$ Mn) by End-use, 2022-2032

Figure 80: Europe Autonomous Mobile Robots for Logistics and Warehousing Market Value (US$ Mn) by Country, 2022-2032

Figure 81: Europe Autonomous Mobile Robots for Logistics and Warehousing Market Value (US$ Mn) Analysis by Country, 2017-2032

Figure 82: Europe Autonomous Mobile Robots for Logistics and Warehousing Market Value Share (%) and BPS Analysis by Country, 2022-2032

Figure 83: Europe Autonomous Mobile Robots for Logistics and Warehousing Market Y-o-Y Growth (%) Projections by Country, 2022-2032

Figure 84: Europe Autonomous Mobile Robots for Logistics and Warehousing Market Value (US$ Mn) Analysis by Solution, 2017-2032

Figure 85: Europe Autonomous Mobile Robots for Logistics and Warehousing Market Value Share (%) and BPS Analysis by Solution, 2022-2032

Figure 86: Europe Autonomous Mobile Robots for Logistics and Warehousing Market Y-o-Y Growth (%) Projections by Solution, 2022-2032

Figure 87: Europe Autonomous Mobile Robots for Logistics and Warehousing Market Value (US$ Mn) Analysis by Category, 2017-2032

Figure 88: Europe Autonomous Mobile Robots for Logistics and Warehousing Market Value Share (%) and BPS Analysis by Category, 2022-2032

Figure 89: Europe Autonomous Mobile Robots for Logistics and Warehousing Market Y-o-Y Growth (%) Projections by Category, 2022-2032

Figure 90: Europe Autonomous Mobile Robots for Logistics and Warehousing Market Value (US$ Mn) Analysis by Application, 2017-2032

Figure 91: Europe Autonomous Mobile Robots for Logistics and Warehousing Market Value Share (%) and BPS Analysis by Application, 2022-2032

Figure 92: Europe Autonomous Mobile Robots for Logistics and Warehousing Market Y-o-Y Growth (%) Projections by Application, 2022-2032

Figure 93: Europe Autonomous Mobile Robots for Logistics and Warehousing Market Value (US$ Mn) Analysis by End-use, 2017-2032

Figure 94: Europe Autonomous Mobile Robots for Logistics and Warehousing Market Value Share (%) and BPS Analysis by End-use, 2022-2032

Figure 95: Europe Autonomous Mobile Robots for Logistics and Warehousing Market Y-o-Y Growth (%) Projections by End-use, 2022-2032

Figure 96: Europe Autonomous Mobile Robots for Logistics and Warehousing Market Attractiveness by Solution, 2022-2032

Figure 97: Europe Autonomous Mobile Robots for Logistics and Warehousing Market Attractiveness by Category, 2022-2032

Figure 98: Europe Autonomous Mobile Robots for Logistics and Warehousing Market Attractiveness by Application, 2022-2032

Figure 99: Europe Autonomous Mobile Robots for Logistics and Warehousing Market Attractiveness by End-use, 2022-2032

Figure 100: Europe Autonomous Mobile Robots for Logistics and Warehousing Market Attractiveness by Country, 2022-2032

Figure 101: East Asia Autonomous Mobile Robots for Logistics and Warehousing Market Value (US$ Mn) by Solution, 2022-2032

Figure 102: East Asia Autonomous Mobile Robots for Logistics and Warehousing Market Value (US$ Mn) by Category, 2022-2032

Figure 103: East Asia Autonomous Mobile Robots for Logistics and Warehousing Market Value (US$ Mn) by Application, 2022-2032

Figure 104: East Asia Autonomous Mobile Robots for Logistics and Warehousing Market Value (US$ Mn) by End-use, 2022-2032

Figure 105: East Asia Autonomous Mobile Robots for Logistics and Warehousing Market Value (US$ Mn) by Country, 2022-2032

Figure 106: East Asia Autonomous Mobile Robots for Logistics and Warehousing Market Value (US$ Mn) Analysis by Country, 2017-2032

Figure 107: East Asia Autonomous Mobile Robots for Logistics and Warehousing Market Value Share (%) and BPS Analysis by Country, 2022-2032

Figure 108: East Asia Autonomous Mobile Robots for Logistics and Warehousing Market Y-o-Y Growth (%) Projections by Country, 2022-2032

Figure 109: East Asia Autonomous Mobile Robots for Logistics and Warehousing Market Value (US$ Mn) Analysis by Solution, 2017-2032

Figure 110: East Asia Autonomous Mobile Robots for Logistics and Warehousing Market Value Share (%) and BPS Analysis by Solution, 2022-2032

Figure 111: East Asia Autonomous Mobile Robots for Logistics and Warehousing Market Y-o-Y Growth (%) Projections by Solution, 2022-2032

Figure 112: East Asia Autonomous Mobile Robots for Logistics and Warehousing Market Value (US$ Mn) Analysis by Category, 2017-2032

Figure 113: East Asia Autonomous Mobile Robots for Logistics and Warehousing Market Value Share (%) and BPS Analysis by Category, 2022-2032

Figure 114: East Asia Autonomous Mobile Robots for Logistics and Warehousing Market Y-o-Y Growth (%) Projections by Category, 2022-2032

Figure 115: East Asia Autonomous Mobile Robots for Logistics and Warehousing Market Value (US$ Mn) Analysis by Application, 2017-2032

Figure 116: East Asia Autonomous Mobile Robots for Logistics and Warehousing Market Value Share (%) and BPS Analysis by Application, 2022-2032

Figure 117: East Asia Autonomous Mobile Robots for Logistics and Warehousing Market Y-o-Y Growth (%) Projections by Application, 2022-2032

Figure 118: East Asia Autonomous Mobile Robots for Logistics and Warehousing Market Value (US$ Mn) Analysis by End-use, 2017-2032

Figure 119: East Asia Autonomous Mobile Robots for Logistics and Warehousing Market Value Share (%) and BPS Analysis by End-use, 2022-2032

Figure 120: East Asia Autonomous Mobile Robots for Logistics and Warehousing Market Y-o-Y Growth (%) Projections by End-use, 2022-2032

Figure 121: East Asia Autonomous Mobile Robots for Logistics and Warehousing Market Attractiveness by Solution, 2022-2032

Figure 122: East Asia Autonomous Mobile Robots for Logistics and Warehousing Market Attractiveness by Category, 2022-2032

Figure 123: East Asia Autonomous Mobile Robots for Logistics and Warehousing Market Attractiveness by Application, 2022-2032

Figure 124: East Asia Autonomous Mobile Robots for Logistics and Warehousing Market Attractiveness by End-use, 2022-2032

Figure 125: East Asia Autonomous Mobile Robots for Logistics and Warehousing Market Attractiveness by Country, 2022-2032

Figure 126: South Asia & Pacific Autonomous Mobile Robots for Logistics and Warehousing Market Value (US$ Mn) by Solution, 2022-2032

Figure 127: South Asia & Pacific Autonomous Mobile Robots for Logistics and Warehousing Market Value (US$ Mn) by Category, 2022-2032

Figure 128: South Asia & Pacific Autonomous Mobile Robots for Logistics and Warehousing Market Value (US$ Mn) by Application, 2022-2032

Figure 129: South Asia & Pacific Autonomous Mobile Robots for Logistics and Warehousing Market Value (US$ Mn) by End-use, 2022-2032

Figure 130: South Asia & Pacific Autonomous Mobile Robots for Logistics and Warehousing Market Value (US$ Mn) by Country, 2022-2032

Figure 131: South Asia & Pacific Autonomous Mobile Robots for Logistics and Warehousing Market Value (US$ Mn) Analysis by Country, 2017-2032

Figure 132: South Asia & Pacific Autonomous Mobile Robots for Logistics and Warehousing Market Value Share (%) and BPS Analysis by Country, 2022-2032

Figure 133: South Asia & Pacific Autonomous Mobile Robots for Logistics and Warehousing Market Y-o-Y Growth (%) Projections by Country, 2022-2032

Figure 134: South Asia & Pacific Autonomous Mobile Robots for Logistics and Warehousing Market Value (US$ Mn) Analysis by Solution, 2017-2032

Figure 135: South Asia & Pacific Autonomous Mobile Robots for Logistics and Warehousing Market Value Share (%) and BPS Analysis by Solution, 2022-2032

Figure 136: South Asia & Pacific Autonomous Mobile Robots for Logistics and Warehousing Market Y-o-Y Growth (%) Projections by Solution, 2022-2032

Figure 137: South Asia & Pacific Autonomous Mobile Robots for Logistics and Warehousing Market Value (US$ Mn) Analysis by Category, 2017-2032

Figure 138: South Asia & Pacific Autonomous Mobile Robots for Logistics and Warehousing Market Value Share (%) and BPS Analysis by Category, 2022-2032

Figure 139: South Asia & Pacific Autonomous Mobile Robots for Logistics and Warehousing Market Y-o-Y Growth (%) Projections by Category, 2022-2032

Figure 140: South Asia & Pacific Autonomous Mobile Robots for Logistics and Warehousing Market Value (US$ Mn) Analysis by Application, 2017-2032

Figure 141: South Asia & Pacific Autonomous Mobile Robots for Logistics and Warehousing Market Value Share (%) and BPS Analysis by Application, 2022-2032

Figure 142: South Asia & Pacific Autonomous Mobile Robots for Logistics and Warehousing Market Y-o-Y Growth (%) Projections by Application, 2022-2032

Figure 143: South Asia & Pacific Autonomous Mobile Robots for Logistics and Warehousing Market Value (US$ Mn) Analysis by End-use, 2017-2032

Figure 144: South Asia & Pacific Autonomous Mobile Robots for Logistics and Warehousing Market Value Share (%) and BPS Analysis by End-use, 2022-2032

Figure 145: South Asia & Pacific Autonomous Mobile Robots for Logistics and Warehousing Market Y-o-Y Growth (%) Projections by End-use, 2022-2032

Figure 146: South Asia & Pacific Autonomous Mobile Robots for Logistics and Warehousing Market Attractiveness by Solution, 2022-2032

Figure 147: South Asia & Pacific Autonomous Mobile Robots for Logistics and Warehousing Market Attractiveness by Category, 2022-2032

Figure 148: South Asia & Pacific Autonomous Mobile Robots for Logistics and Warehousing Market Attractiveness by Application, 2022-2032

Figure 149: South Asia & Pacific Autonomous Mobile Robots for Logistics and Warehousing Market Attractiveness by End-use, 2022-2032

Figure 150: South Asia & Pacific Autonomous Mobile Robots for Logistics and Warehousing Market Attractiveness by Country, 2022-2032

Figure 151: MEA Autonomous Mobile Robots for Logistics and Warehousing Market Value (US$ Mn) by Solution, 2022-2032

Figure 152: MEA Autonomous Mobile Robots for Logistics and Warehousing Market Value (US$ Mn) by Category, 2022-2032

Figure 153: MEA Autonomous Mobile Robots for Logistics and Warehousing Market Value (US$ Mn) by Application, 2022-2032

Figure 154: MEA Autonomous Mobile Robots for Logistics and Warehousing Market Value (US$ Mn) by End-use, 2022-2032

Figure 155: MEA Autonomous Mobile Robots for Logistics and Warehousing Market Value (US$ Mn) by Country, 2022-2032

Figure 156: MEA Autonomous Mobile Robots for Logistics and Warehousing Market Value (US$ Mn) Analysis by Country, 2017-2032

Figure 157: MEA Autonomous Mobile Robots for Logistics and Warehousing Market Value Share (%) and BPS Analysis by Country, 2022-2032

Figure 158: MEA Autonomous Mobile Robots for Logistics and Warehousing Market Y-o-Y Growth (%) Projections by Country, 2022-2032

Figure 159: MEA Autonomous Mobile Robots for Logistics and Warehousing Market Value (US$ Mn) Analysis by Solution, 2017-2032

Figure 160: MEA Autonomous Mobile Robots for Logistics and Warehousing Market Value Share (%) and BPS Analysis by Solution, 2022-2032

Figure 161: MEA Autonomous Mobile Robots for Logistics and Warehousing Market Y-o-Y Growth (%) Projections by Solution, 2022-2032

Figure 162: MEA Autonomous Mobile Robots for Logistics and Warehousing Market Value (US$ Mn) Analysis by Category, 2017-2032

Figure 163: MEA Autonomous Mobile Robots for Logistics and Warehousing Market Value Share (%) and BPS Analysis by Category, 2022-2032

Figure 164: MEA Autonomous Mobile Robots for Logistics and Warehousing Market Y-o-Y Growth (%) Projections by Category, 2022-2032

Figure 165: MEA Autonomous Mobile Robots for Logistics and Warehousing Market Value (US$ Mn) Analysis by Application, 2017-2032

Figure 166: MEA Autonomous Mobile Robots for Logistics and Warehousing Market Value Share (%) and BPS Analysis by Application, 2022-2032

Figure 167: MEA Autonomous Mobile Robots for Logistics and Warehousing Market Y-o-Y Growth (%) Projections by Application, 2022-2032

Figure 168: MEA Autonomous Mobile Robots for Logistics and Warehousing Market Value (US$ Mn) Analysis by End-use, 2017-2032

Figure 169: MEA Autonomous Mobile Robots for Logistics and Warehousing Market Value Share (%) and BPS Analysis by End-use, 2022-2032

Figure 170: MEA Autonomous Mobile Robots for Logistics and Warehousing Market Y-o-Y Growth (%) Projections by End-use, 2022-2032

Figure 171: MEA Autonomous Mobile Robots for Logistics and Warehousing Market Attractiveness by Solution, 2022-2032

Figure 172: MEA Autonomous Mobile Robots for Logistics and Warehousing Market Attractiveness by Category, 2022-2032

Figure 173: MEA Autonomous Mobile Robots for Logistics and Warehousing Market Attractiveness by Application, 2022-2032

Figure 174: MEA Autonomous Mobile Robots for Logistics and Warehousing Market Attractiveness by End-use, 2022-2032

Figure 175: MEA Autonomous Mobile Robots for Logistics and Warehousing Market Attractiveness by Country, 2022-2032

Recommendations

Technology

Connected Logistics Market

Published : January 2023

Technology

Reverse Logistics Market

Published : October 2022

Explore Technology Insights

View Reports

Autonomous Mobile Robots for Logistics and Warehousing Market