Autonomous Imaging Market Size and Share Forecast Outlook 2025 to 2035

The Global Autonomous Imaging Market has been forecasted to attain a valuation of USD 1,892.0 million in 2025, rising to USD 4,199.58 million by 2035, resulting in an incremental gain of USD 2,307.6 million, which reflects a 45.1% increase over the forecast decade. A compound annual growth rate (CAGR) of 8.3% is expected to be recorded, indicating a rapid expansion trajectory for the global autonomous imaging market.
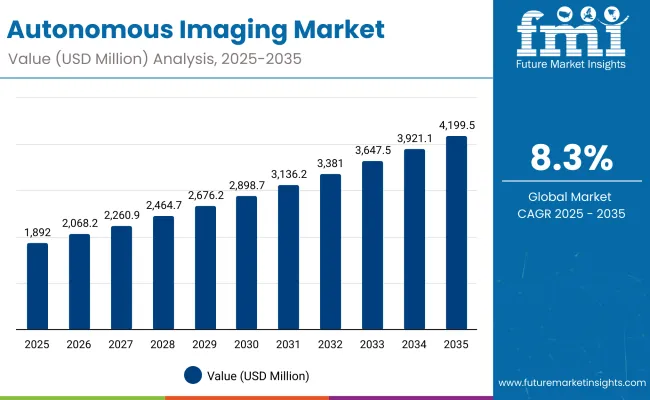
Autonomous Imaging Market

Global Autonomous Imaging Market Key Takeaways

Metric Value
Global Autonomous Imaging Market Estimated Value in (2025E) USD 1,892.0 million
Global Autonomous Imaging Market Forecast Value in (2035F) USD 4,199 .5 million
Forecast CAGR (2025 to 2035) 8.3 %

Between 2025 and 2030, the global autonomous imaging market will see adoption across healthcare, automotive, defense, and industrial inspection as organization rely on imaging systems capable of self-navigation and AI-driven interpretation. It will grow upto USD 926.8 million in that period from USD 1,892.0 million in 2025 to USD 2,818.8 million in 2030.

The combination of edge AI, multimodal sensors, and adaptive imaging algorithms is enhancing the accessibility of autonomous imaging across medical fields such as radiology, oncology, and cardiology. These technologies enable real-time image acquisition, automated anomaly detection, and predictive insights, improving diagnostic accuracy and workflow efficiency.

Between 2030 and 2035, the market is projected to expand further by USD 1,380.8 millionfueled by advances in autonomous surgical imaging, space-based imaging platforms, and AI-enhanced situational awareness systems.

Demand will intensify from sectors such as personalized medicine, where real-time, self-correcting image acquisition is essential for accurate diagnosis, treatment planning, and patient monitoring.Progress in neuromorphic vision sensors, high-speed edge processors, and quantum imaging techniques will define the next wave of autonomous imaging innovations.

From 2020 to 2024, the Global Autonomous Imaging Market, expanded from USD 1216.2 million to USD 1,757.7 million, transitioning from a largely experimental phase into early commercialization. During this period, AI-enabled vision systems, autonomous drones, and robotic imaging platforms matured through partnerships between technology firms, universities, and medical device companies. Streamlined imaging software, improved sensor fusion, and more reliable data interpretation capabilities laid the foundation for scaling autonomous imaging into broader industries.

Looking ahead, the autonomous imaging ecosystem will evolve to incorporate AI-powered anomaly detection, real-time 3D reconstruction, and integration with autonomous robotics and IoT infrastructures. These innovations will shorten deployment cycles, expand cross-sector use cases, and increase operational efficiency positioning autonomous imaging as a core enabling technology for next-generation healthcare, mobility, defense, and industrial ecosystems.

Why the Global Autonomous Imaging Market is growing?

The growth of the global autonomous imaging market is driven by the increasing demand for faster, more accurate, and operator-independent diagnostic solutions across healthcare settings. Unlike traditional imaging modalities, autonomous systems integrate AI-driven analysis, automated image acquisition, and real-time processing, enabling consistent, high-quality imaging with minimal human intervention making them indispensable in modern hospitals, clinics, and remote care facilities.

Over the last decade, the scope of autonomous imaging has expanded beyond conventional radiology. It now plays a critical role in emergency care, outpatient diagnostics, and preventive health screening, allowing clinicians to quickly identify conditions ranging from cardiovascular anomalies to musculoskeletal injuries. As healthcare providers increasingly adopt value-based and patient-centric care models, autonomous imaging solutions are becoming a mandatory component of efficient diagnostic workflows.

Another factor driving market expansion is the shift from fully manual systems to smart, integrated platforms. Vendors such as Arterys and Aidoc turnkey solutions that combine imaging modalities CT, X-ray, MRI, ultrasound, and mammography with AI-assisted workflow management and cloud-based data analysis. This decentralization of expertise allows smaller clinics and remote facilities to achieve hospital-level diagnostic capabilities without extensive specialist intervention.

Moreover, rising adoption in emerging markets, growing geriatric populations, and an increased focus on early disease detection are fueling demand for compact, portable, and multi-modal autonomous imaging systems. Innovations such as low-dose protocols, hybrid imaging, 3D/4D visualization, and automated anomaly detection are further expanding clinical utility, supporting more comprehensive and efficient patient care.

Collectively, these technological, operational, and demographic drivers are positioning the global autonomous imaging market for sustained growth, as healthcare systems worldwide seek to enhance diagnostic efficiency, accessibility, and precision.

Segmental Analysis

The market is segmented by type, device type, deployment type, and end user. By type, it includes semi-autonomous systems and fully autonomous systems, reflecting varying levels of automation in imaging workflows, by device type, segmentation covers X-ray machines, CT scanners, MRI machines, ultrasound systems, mammography systems, and others, representing the broad adoption of autonomous imaging across diagnostic modalities, by deployment type, the market is divided into on-premises, cloud-based, and hybrid models, depending on infrastructure and data management needs, by end user, the segmentation includes hospitals, diagnostic imaging centers, outpatient/ambulatory surgery centers, telemedicine providers, and research institutions, which collectively drive demand for autonomous imaging technologies in both clinical and research settings.

Regionally, the scope spans North America, Latin America, Western and Eastern Europe, East Asia, South Asia and Pacific, and the Middle East and Africa.
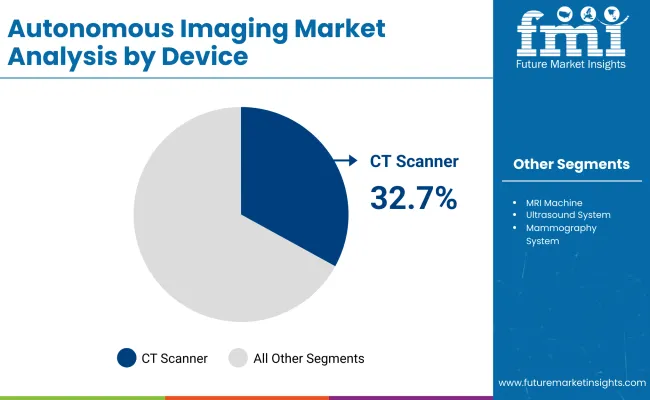
Insights into the device type of segment with CT Scanner leading the segment

Autonomous Imaging Market By Device

Device Market Value Share, 2025
X ray Machine 21.4%
CT Scanner 32.7%
MRI Machine 17.8%
Ultrasound System 13.8%
Mammography System 6.2%
Others 8.1%

CT scanners are projected to lead the autonomous imaging market with a 32.7% share in 2025, and are expected to maintain this position due to their ability to deliver high-resolution, volumetric imaging with rapid acquisition times across a wide range of clinical applications. Unlike conventional X-ray systems, CT scanners offer multi-slice detectors, AI-assisted image reconstruction, and dose-optimization technologies allowing clinicians to capture precise anatomical and functional information while minimizing radiation exposure.

Recent advances in photon-counting detectors, iterative reconstruction algorithms, and hybrid imaging integration (such as PET/CT) have enabled these systems to operate with unprecedented speed and diagnostic precision. Moreover, automation in scanning protocols, workflow management, and AI-driven anomaly detection allows healthcare providers to perform complex studies efficiently, supporting early disease detection and detailed anatomical mapping.

A key factor behind their dominance is widespread deployment in hospitals, emergency care units, and diagnostic centers. With commercial vendors offering turnkey solutions that require minimal operator training, CT scanners are becoming increasingly accessible to medium-sized clinics and outpatient facilities. Their combination of throughput, resolution, and automation further positions them as the go-to modality for advanced diagnostic imaging.

As demand for rapid, AI-enhanced, and minimally invasive diagnostics grows, the versatility and precision of CT scanners ensure they remain central to modern clinical imaging, supporting improved patient outcomes and operational efficiency across global healthcare settings.
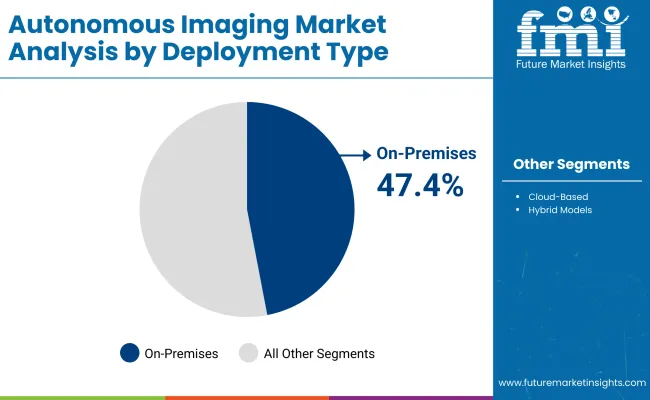
Insights into the deployment segment with on-premises dominating the market

Autonomous Imaging Market By Deployment Type

Deployment Type Market Value Share, 2025
On-premises 47.4%
Cloud-based 28.9%
Hybrid Models 23.7%

On-premises continues to dominate the deployment type in 2025, accounting for 47.4% of total demand. This model remains the backbone of enterprise IT infrastructure due to its proven ability to deliver high control, security, and customization over critical workloads. Organizations with strict data privacy, compliance, and latency requirements continue to favor on-premises solutions, leveraging mature hardware and software ecosystems that have been optimized over decades.

What makes on-premises deployment irreplaceable is its predictability, reliability, and control. IT teams have long-standing expertise in managing on-premises systems, including servers, storage, and networking, and organizations have invested heavily in operational procedures, security protocols, and disaster recovery plans. These investments create a rich foundation for maintaining consistent performance and regulatory compliance. Moreover, enterprise training programs and industry certifications continue to emphasize on-premises best practices, ensuring a sustained pool of skilled professionals.

While cloud-based and hybrid solutions are gaining traction in specific use cases such as remote collaboration, elasticity, and pay-as-you-go models, on-premises deployments remain the mainstay of global enterprise IT, largely due to their versatility, security, and long-term cost predictability.

What are the Drivers, Restraints, and Key Trends of the Global Autonomous Imaging Market?

The adoption of autonomous imaging is accelerating across research laboratories, pharmaceutical companies, and advanced manufacturing facilities as AI, robotics, and imaging technologies converge to enable high-throughput, precise, and reproducible data acquisition. While the market shows strong growth, structural limitations linked to system complexity, cost, and operational requirements remain significant.

Growing Role in High-Precision Imaging and Automation Autonomous imaging is emerging as a critical enabler in materials science, life sciences, and semiconductor research, where precision and reproducibility are essential. These systems allow researchers to conduct high-resolution analyses with minimal human intervention, reducing errors and improving data consistency.

Industries are deploying autonomous imaging platforms to accelerate discovery, validate experimental results, and monitor quality across production processes, addressing the increasing demand for scalable and automated solutions. The integration of AI-driven image analysis further enhances detection accuracy, enabling the identification of subtle variations that may be overlooked in manual assessments.

As automation technologies mature, autonomous imaging is transitioning from a niche capability to a standard tool within experimental validation workflows. This trend is particularly evident in sectors where high throughput and reliability are critical, reinforcing autonomous imaging’s role as a driver of efficiency, innovation, and competitive advantage in the global market.

Shift Toward Compact and Turnkey Autonomous Imaging Solutions A key trend shaping the global autonomous imaging market is the movement away from large, specialized imaging setups toward compact, turnkey systems. Manufacturers are increasingly delivering platforms that integrate high-resolution cameras, robotics, and AI-powered control into a single unit, reducing dependence on complex infrastructure.

These solutions are designed for ease of use, enabling operators with limited technical expertise to perform advanced imaging tasks with precision. Enhancements in environmental control, automated focusing, and software integration have further expanded their applicability across healthcare, research, and industrial sectors.

Countries aiming to strengthen research independence are equipping universities and mid-sized facilities with in-house autonomous imaging solutions, broadening access beyond high-end institutions. This transition is making autonomous imaging more scalable and practical, reflecting a wider trend toward democratizing advanced imaging technologies and positioning them as mainstream tools rather than niche, resource-intensive systems.

High Implementation Costs as a Key Restraint in Autonomous Imaging High implementation costs remain a significant restraint on the adoption of autonomous imaging systems across healthcare, research, and industrial sectors. These systems integrate advanced AI algorithms, robotics, high-resolution sensors, and multimodal imaging technologies, making initial investments substantial. Beyond purchase costs, operational expenses such as routine calibration, software maintenance, and staff training further increase the total cost of ownership.

Smaller hospitals, clinics, and research institutions often face budgetary limitations that hinder procurement and delay deployment. High costs also affect emerging markets, where limited IT infrastructure and financial resources reduce the feasibility of adopting advanced imaging platforms.

Market analyses indicate that these financial barriers are among the primary reasons autonomous imaging systems remain concentrated in well-funded institutions and specialized research centers. Until cost-effective solutions or scalable, modular models become more widely available, high implementation expenses will continue to limit the widespread adoption and integration of autonomous imaging technologies globally.
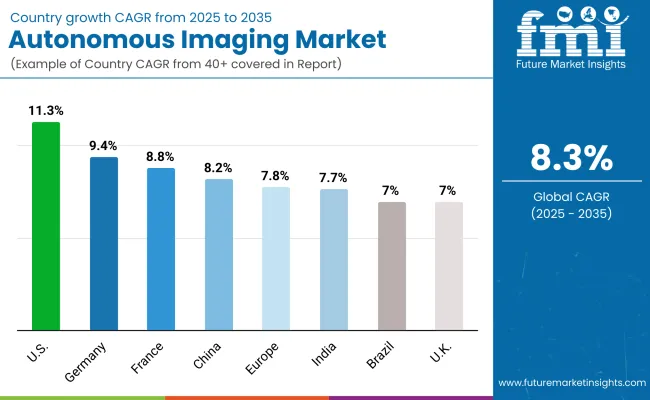
Analysis of Global Autonomous Imaging Market, By Key Countries

Autonomous Imaging Market Country Wise Analysis

Country CAGR
USA 11.3%
Brazil 7.0%
China 8.2%
India 7.7%
Europe 7.8%
Germany 9.4%
France 8.8%
UK 7%

The adoption and growth patterns of autonomous imaging systems exhibit notable variations across regions, shaped by the maturity of research and industrial infrastructure, government funding, and demand from specialized applications.

In the United States, the autonomous imaging market is driven by a strong ecosystem of academic research labs, technology companies, and industrial players in healthcare sectors. Advanced AI-powered imaging platforms and robotics-enabled systems support high-throughput, precise data acquisition, enabling applications ranging from diagnostic imaging to industrial quality control.

Continuous investments in smart laboratories, automation, and AI integration further accelerate adoption. Favorable government initiatives and collaborations between public research institutions and private enterprises reinforce the development and deployment of autonomous imaging technologies. The market in the USA is projected to account for 11.3% in 2025.

In Europe, countries such as Germany, France, and the UK are at the forefront of the autonomous imaging market, driven by strong research infrastructure, advanced industrial applications, and government-backed innovation initiatives. National programs supporting AI, robotics, and high-precision imaging foster collaborations between academic institutions and private enterprises, enabling the integration of autonomous imaging platforms across healthcare, manufacturing, and defense sectors.

Leading research centers and technology hubs provide access to state-of-the-art laboratory facilities and advanced automation systems, promoting adoption of both compact and integrated imaging solutions. Strategic funding and regulatory support for smart laboratories and AI-enabled technologies further accelerate market growth, although adoption progresses carefully as organizations evaluate the operational complexity and cost-effectiveness of these systems. The market in Germany is projected to account for 9.4%, France 8.8%, and the UK 6.7% of the global autonomous imaging market in 2025.

Overall, the European market demonstrates a balance of technological advancement, institutional investment, and research alignment, illustrating how national priorities, infrastructure availability, and expertise shape adoption patterns for autonomous imaging technologies across the region.
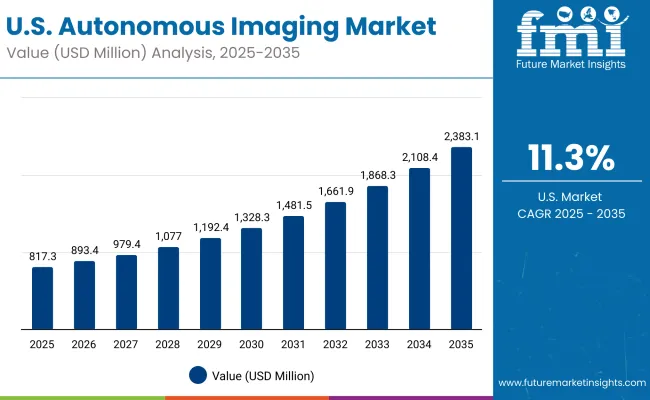
Sales Outlook for Global Autonomous Imaging in the United States

Usa Autonomous Imaging Market

The autonomous imaging market in the United States is projected to account for 11.3% of the global market in 2025. Companies like GE HealthCare, Siemens Healthineers, and Philips are scaling clinical-grade imaging solutions, while cloud and AI players such as Microsoft Azure, Amazon Web Services, and NVIDIA are offering imaging-as-a-service platforms that allow hospitals and research labs to access high-performance analytics without major capital investment.

  • USA vendors such as GE HealthCare, Butterfly Network, and Nanox are developing AI-integrated imaging platforms that automate data acquisition, analysis, and interpretation, reducing operator training time and improving reproducibility.
  • Cross-disciplinary collaborations between biomedical engineering, materials science, and robotics departments are fostering hybrid workflows where autonomous imaging is integrated with microscopy, spectroscopy, and production-line monitoring.
  • Strong government funding and public-private partnerships are accelerating R&D in autonomous imaging technologies, including compact, lab-ready systems and industrial-grade inspection platforms.

Growth and Expansion Outlook for Global Autonomous Imaging Market in India

The autonomous imaging market in India is is projected to expand at a CAGR of 7.7%, driven primarily by premier academic and research institutions, though adoption remains constrained by limited infrastructure and high system costs.

Institutions such as the Indian Institute of Science (IISc), Tata Institute of Fundamental Research (TIFR), and IIT Bombay are pioneering the deployment of autonomous imaging systems in biomedical research, materials characterization, and industrial prototyping. These institutions are integrating AI-enabled imaging platforms with existing laboratory workflows to support high-precision experiments and early-stage industrial applications.

  • Indian research groups are exploring modular and cost-effective autonomous imaging solutions, including low-cost vacuum and optical systems, simplified robotic arms, and AI-assisted image analysis software. These efforts aim to build entry-level, lab-ready platforms suitable for institutions with constrained budgets.
  • Most installations are grant-dependent, with procurement tied to Department of Science & Technology (DST), SERB, and other central government funding programs. Co-funding initiatives and technology grants encourage local innovation and provide resources for adopting autonomous imaging in academic and industrial projects.
  • Partnerships with international research facilities remain essential to bridge the gap in domestic expertise. Collaborative programs allow Indian institutions such as Indian Institute of Technology Bombay (IIT Bombay), and Indian Institute of Science (IISc) to access advanced AI-driven imaging systems, exchange technical knowledge, and accelerate adoption of autonomous imaging technologies in both research and industrial environments.

Sales Outlook for Global Autonomous Imaging in China

China’s autonomous imaging market is projected to expand at a CAGR of 8.2% between 2025 and 2035, reflecting the country’s rapid investment in AI-driven imaging technologies, autonomous vehicles, smart city infrastructure, and industrial automation.

China has become a hub for applied imaging innovation, with research institutions such as Tsinghua University, Peking University, and the Institute of Physics (Chinese Academy of Sciences) collaborating closely with industrial partners to deploy AI-enabled imaging systems in healthcare. These institutions emphasize translating research into real-world solutions, developing autonomous imaging platforms for medical diagnostics and supporting companies in scaling high-precision imaging technologies for commercial use.
  • Local vendors such as United Imaging Healthcare, Shantou Institute of Ultrasonic Instruments (SIUI), and Deepwise are increasingly providing modular, lab-ready imaging systems tailored for research labs, industrial testing, and commercial applications. These platforms focus on cost-effective integration, simplified interfaces, and AI-powered automation, making them accessible to universities and small-to-medium enterprises.
  • Many state-funded laboratories are combining autonomous imaging with complementary tools such as LIDAR, 3D sensing, spectroscopy, and quality control sensors, creating end-to-end workflows for industrial, automotive, and healthcare applications.
  • Regional governments are offering co-funding programs and infrastructure grants for high-cost equipment, promoting adoption in Tier 1 and Tier 2 cities beyond traditional research hubs like Beijing and Shanghai. These initiatives facilitate broader access to advanced imaging capabilities and strengthen local innovation ecosystems.

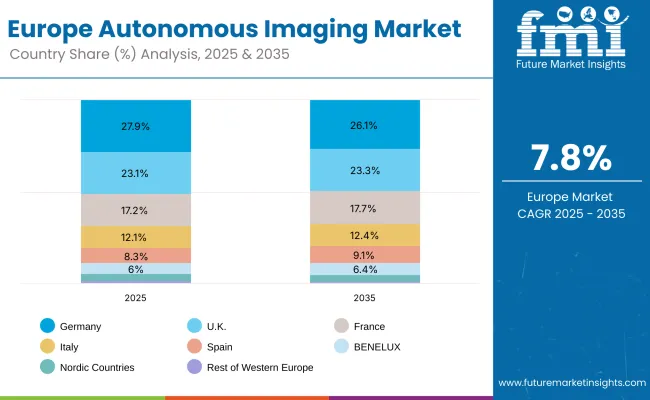
Sales Outlook for Global Autonomous Imaging in Europe

Europe Autonomous Imaging Market

Europe Country 2025
Germany 27.9%
UK 23.1%
France 17.2%
Italy 12.1%
Spain 8.3%
BENELUX 6.0%
Nordic Countries 3.4%
Rest of Western Europe 1.9%
Europe Country 2035
Germany 26.1%
UK 23.3%
France 17.7%
Italy 12.4%
Spain 9.1%
BENELUX 6.4%
Nordic Countries 4.1%
Rest of Western Europe 1.0%

Growth and Expansion Outlook for Global Autonomous Imaging Market in the United Kingdom

The global autonomous imaging market in the United Kingdom is projected to grow at a CAGR of 6.7% between 2025 and 2035. The market is being driven by the deployment of AI-enabled imaging solutions in hospitals, diagnostic centers, and clinical research facilities.

Leading institutions such as the University of Oxford, University of Cambridge, and Imperial College London are collaborating with medical technology companies to implement high-resolution imaging platforms for early disease detection, surgical planning, and patient monitoring.

The country’s well-established healthcare ecosystem supports the integration of autonomous imaging systems with hospital IT networks, electronic health records, and cloud-based analytics, enabling improved diagnostic accuracy, workflow efficiency, and patient outcomes.

There has been a rise in AI-enabled and cloud-connected imaging installations, driven by government innovation funding and participation in pan-European technology initiatives. These systems are increasingly being used in conjunction with automated robotics and real-time data analytics, enabling more comprehensive monitoring, quality control, and diagnostic capabilities across sectors.

  • AI-powered imaging sensors, 3D cameras, and cloud-based analysis platforms are improving operational efficiency and accuracy.
  • Autonomous imaging is being deployed in hospitals, diagnostic centers, and clinical research facilities for applications such as early disease detection, AI-assisted radiology, surgical planning, pathology analysis, and continuous patient monitoring. These systems improve diagnostic accuracy, streamline workflows, and enable real-time clinical decision support.
  • UKRI funding programs and public-private partnerships are promoting research, development, and deployment of autonomous imaging solutions across industries.

In-depth Analysis of Global Autonomous Imaging in Germany

The autonomous imaging market in Germany is projected to grow at a CAGR of 9.4% between 2025 and 2035. Germany is establishing itselfas a leading hub for advanced autonomous imaging technologies in healthcare diagnostics. While adoption in research and academia remains strong, the current growth is largely driven by collaborations between technology firms, AI startups, and industrial automation companies.

German companies are strategically developing autonomous imaging subsystems including AI-powered cameras, 3D sensors, and cloud-enabled imaging platforms which are increasingly being integrated into global imaging solutions.
  • Instrumentation and AI firms based in Germany are critical suppliers of autonomous imaging components and export extensively to both industrial and healthcare integrators.
  • Research centers and innovation labs are leveraging autonomous imaging for applications in predictive maintenance, precision farming, and automated quality control in manufacturing.
  • Public-private initiatives and EU funding programs are facilitating the development of imaging platforms that combine AI, robotics, and high-resolution sensors for industrial and scientific use.

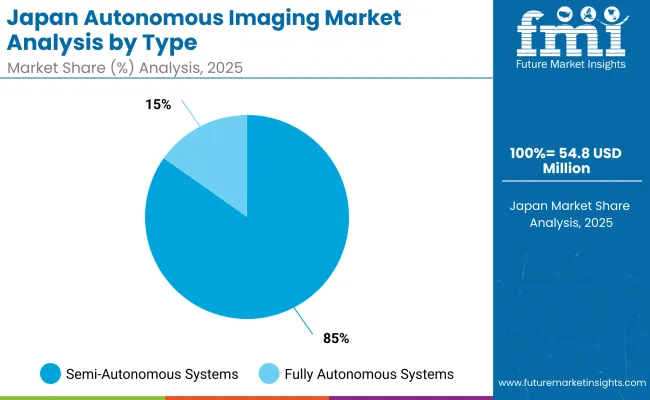
Growth Outlook for Global Autonomous Imaging Market in Japan

Japan Autonomous Imaging Market By Type

Type Market Value Share, 2025
Semi-autonomous Systems 84.8%
Fully Autonomous Systems 15.2%

The Global Autonomous Imaging Market in Japan is projected to reach USD 54.87 million by 2025, with semi-autonomous imaging systems leading the product landscape at 84.8% market share, followed by fully autonomous systems at 15.2%. The market is shaped by Japan’s strong tradition in robotics, AI research, and high-resolution imaging technologies.

Companies such as Hitachi Medical Systems, Terumo Corporation, and Nihon Kohden, are deploying autonomous imaging solutions for healthcare applications. Their platforms support AI-assisted diagnostics, real-time patient monitoring, and image-guided interventions.

By combining high-resolution imaging with analytics and hospital IT systems, these companies are improving diagnostic accuracy, enabling predictive healthcare, and supporting personalized treatment planning across hospitals and clinical research facilities.
  • Government funding and national AI initiatives are increasing capital support for high-end autonomous imaging systems across academic consortia and innovation hubs.
  • AI-driven imaging for industrial quality control and medical diagnostics is gaining traction in Japanese labs and pilot programs.
  • The country’s strong in-house development culture supports customized system integration, although it can slow adoption of standardized commercial platforms.

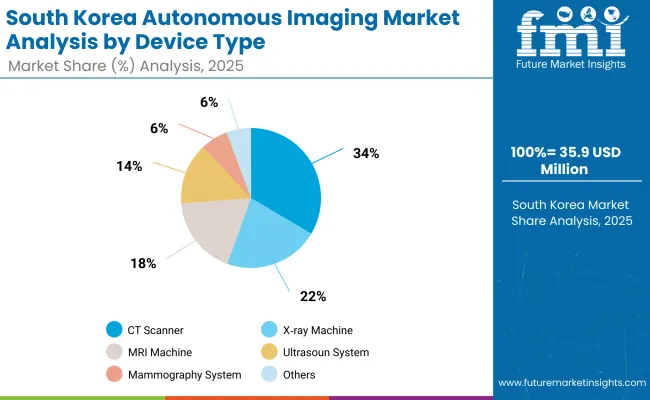
Opportunity Analysis of South Korea Global Autonomous Imaging Market

South Korea Autonomous Imaging Market By Device Type

Device Type Market Value Share, 2025
X ray Machine 22.0%
CT Scanner 33.6%
MRI Machine 18.3%
Ultrasoun System 14.2%
Mammography System 6.4%
Others 5.7%

The global autonomous imaging market in South Korea has been projected to reach USD 35.95 million in 2025. CT Scannerare expected to lead device type with an33.6% followed by X-ray machines at 22.0%.South Korea’s medical imaging market is evolving toward advanced diagnostic and AI-integrated applications. Leading hospitals and diagnostic centers are adopting high-resolution imaging systems combined with AI-assisted analysis to improve diagnostic accuracy, workflow efficiency, and patient outcomes.
  • Hospitals are implementing hybrid imaging setups that combine CT, MRI, and X-ray systems with AI-driven analytics for faster and more precise diagnostics.
  • Domestic medical technology companies are collaborating with universities and research institutes to develop next-generation imaging platforms, including portable X-ray and AI-powered ultrasound devices.
  • Strong digital infrastructure supports integration with hospital information systems, cloud-based PACS (Picture Archiving and Communication Systems), and real-time image sharing across multiple healthcare facilities, enhancing telemedicine and remote diagnostics capabilities.

Competitive Landscape of Global Autonomous Imaging Market

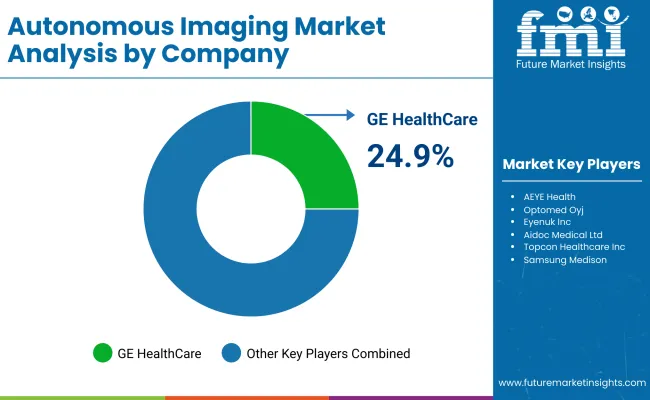
Autonomous Imaging Market By Company

Company Global Value Share 2024
GE HealthCare 24.9%
Others 75.1%

The Global Autonomous Imaging Market is moderately concentrated, with GE HealthCare holding the largest share at 24.9% in 2024. The company’s leadership is driven by its comprehensive portfolio of autonomous imaging solutions, advanced AI integration, and established global customer base across hospitals and diagnostic centers. GE HealthCare continues to strengthen its position through innovations in imaging automation, cloud-based analytics, and workflow optimization tools.

Other notable players include AEYE Health, OptomedOyj, Eyenuk, Inc., Aidoc Medical Ltd., NIDEK Co., Ltd., Topcon Healthcare, Inc., EchoNous, Bracco Imaging + Subtle Medical, Inc., andSamsung Medison, each targeting specialized segments within the autonomous imaging ecosystem. AEYE Health focuses on autonomous retinal imaging systems, while OptomedOyj provides portable ophthalmic imaging solutions.

Eyenuk and Aidoc leverage AI-driven diagnostic tools for multi-modal imaging. NIDEK, Topcon, and Samsung Medison concentrate on advanced ophthalmic and general imaging devices with AI-assisted capabilities. Bracco Imaging and Subtle Medical integrate AI into imaging contrast and workflow solutions. Collectively, these players account for the remaining 75.1% of the market, reflecting a diverse competitive landscape with multiple specialized offerings.

Key Developments in Global Autonomous Imaging Market

  • On March 2025, GE HealthCare announced a collaboration with NVIDIA at GTC 2025, expanding the existing relationship between the two companies to focus on pioneering innovation in autonomous imaging, beginning with autonomous X-ray technologies and autonomous applications within ultrasound. Autonomous X-ray and ultrasound are promising new areas of development, using AI-enabled software to capture and analyze medical images, which could minimize the burden on technicians and radiologists.
  • On May 2024, AEYE Health has developed the AEYE-DS, the first FDA-cleared fully autonomous AI system for portable diabetic retinopathy screening. This device operates with handheld or tabletop cameras, providing instant AI diagnosis in under a minute.

Scope of the Report

Item Value
Quantitative Units USD 1,892.0 million
By Type Semi-autonomous Systems, Fully Autonomous Systems
By Device Type X ray Machine, CT Scanner, MRI Machine, Ultrasound System, Mammography System, Others
By Deployment Type On-premises, Cloud-based, Hybrid Models
Regions Covered North America, Latin America, Western Europe, Eastern Europe, East Asia, South Asia & Pacific, Middle East & Africa
Countries Covered USA, Brazil, China, India, Europe, Germany, France and UK
Key Companies Profiled GE HealthCare, AEYE Health, Optomed Oyj, Eyenuk, Inc., Aidoc Medical Ltd., NIDEK Co., Ltd., Topcon Healthcare, Inc., EchoNous, Bracco Imaging + Subtle Medical, Inc., Samsung Medison

Key Segments

By Type:

  • Semi-autonomous Systems
  • Fully Autonomous Systems
  • Bioinformatics & Software Solutions

By Device Type:

  • X ray Machine
  • CT Scanner
  • MRI Machine
  • Ultrasound System
  • Mammography System
  • Others

By Deployment Type:

  • On-premises
  • Cloud-based
  • Hybrid Models

By End User:

  • Hospitals
  • Diagnostic Imaging Centers
  • Outpatient/Ambulatory Surgery Centers
  • Telemedicine
  • Research Institutions

By Region:

  • North America
  • Latin America
  • Western Europe
  • Eastern Europe
  • East Asia
  • South Asia
  • MEA

Table of Content

  1. Executive Summary
    • Global Market Outlook
    • Demand-side Trends
    • Supply-side Trends
    • Technology Roadmap Analysis
    • Analysis and Recommendations
  2. Market Overview
    • Market Coverage / Taxonomy
    • Market Definition / Scope / Limitations
  3. Market Background
    • Market Dynamics
      • Drivers
      • Restraints
      • Opportunity
      • Trends
    • Scenario Forecast
      • Demand in Optimistic Scenario
      • Demand in Likely Scenario
      • Demand in Conservative Scenario
    • Opportunity Map Analysis
    • Product Life Cycle Analysis
    • Technological Advancement
    • Investment Feasibility Matrix
    • PESTLE and Porter’s Analysis
    • Regulatory Landscape
  4. 3.9.1. By Key Regions
  5. 3.9.2. By Key Countries
    • Regional Parent Market Outlook
    • Recent Product Launches/Approvals
  6. Global Global Market Analysis 2020 to 2024 and Forecast, 2025 to 2035
    • Historical Market Size Value (USD Million) Analysis, 2020 to 2024
    • Current and Future Market Size Value (USD Million) Projections, 2025 to 2035
      • Y-o-Y Growth Trend Analysis
      • Absolute $ Opportunity Analysis
  7. Global Global Market Analysis 2020 to 2024 and Forecast 2025 to 2035, By Type
    • Introduction / Key Findings
    • Historical Market Size Value (USD Million) Analysis By Type, 2020 to 2024
    • Current and Future Market Size Value (USD Million) Analysis and Forecast By Type, 2025 to 2035
      • Semi-autonomous Systems
      • Fully Autonomous Systems
      • Bioinformatics & Software Solutions
    • Y-o-Y Growth Trend Analysis By Type, 2020 to 2024
    • Absolute $ Opportunity Analysis By Type, 2025 to 2035
  8. Global Global Market Analysis 2020 to 2024 and Forecast 2025 to 2035, By Device Type
    • Introduction / Key Findings
    • Historical Market Size Value (USD Million) Analysis By Device Type, 2020 to 2024
    • Current and Future Market Size Value (USD Million) Analysis and Forecast By Device Type, 2025 to 2035
      • X ray Machine
      • CT Scanner
      • MRI Machine
      • Ultrasound System
      • Mammography System
      • Others
    • Y-o-Y Growth Trend Analysis By Device Type, 2020 to 2024
    • Absolute $ Opportunity Analysis By Device Type, 2025 to 2035
  9. Global Global Market Analysis 2020 to 2024 and Forecast 2025 to 2035, By Deployment Type
    • Introduction / Key Findings
    • Historical Market Size Value (USD Million) Analysis By Deployment Type, 2020 to 2024
    • Current and Future Market Size Value (USD Million) Analysis and Forecast By Deployment Type, 2025 to 2035
      • On-premises
      • Cloud-based
      • Hybrid Models
  10. 7.3.7. Others
    • Y-o-Y Growth Trend Analysis By Deployment Type, 2020 to 2024
    • Absolute $ Opportunity Analysis By Deployment Type, 2025 to 2035
  11. Global Global Market Analysis 2020 to 2024 and Forecast 2025 to 2035, By End User
    • Introduction / Key Findings
    • Historical Market Size Value (USD Million) Analysis By End User, 2020 to 2024
    • Current and Future Market Size Value (USD Million) Analysis and Forecast By End User, 2025 to 2035
      • Hospitals
      • Diagnostic Imaging Centers
      • Outpatient/Ambulatory Surgery Centers
      • Telemedicine
      • Research Institutions
    • Y-o-Y Growth Trend Analysis By End User, 2020 to 2024
    • Absolute $ Opportunity Analysis By End User, 2025 to 2035
  12. Global Global Market Analysis 2020 to 2024 and Forecast 2025 to 2035, By Region
    • Introduction
    • Historical Market Size Value (USD Million) Analysis By Region, 2020 to 2024
    • Current Market Size Value (USD Million) Analysis and Forecast By Region, 2025 to 2035
      • North America
      • Latin America
      • Western Europe
      • Eastern Europe
      • East Asia
      • South Asia
      • MEA
    • Market Attractiveness Analysis By Region
  13. North America Global Market Analysis 2020 to 2024 and Forecast 2025 to 2035, By Country
    • Historical Market Size Value (USD Million) Trend Analysis By Market Taxonomy, 2020 to 2024
    • Market Size Value (USD Million) Forecast By Market Taxonomy, 2025 to 2035
      • By Country
        • USA
        • Canada
        • Mexico
      • By Type
      • By Device Type
      • By Deployment Type
      • By End User
    • Market Attractiveness Analysis
      • By Country
      • By Type
      • By Device Type
      • By Deployment Type
      • By End User
    • Key Takeaways
  14. Latin America Global Market Analysis 2020 to 2024 and Forecast 2025 to 2035, By Country
    • Historical Market Size Value (USD Million) Trend Analysis By Market Taxonomy, 2020 to 2024
    • Market Size Value (USD Million) Forecast By Market Taxonomy, 2025 to 2035
      • By Country
        • Brazil
        • Argentina
        • Rest of Latin America
      • By Type
      • By Device Type
      • By Deployment Type
      • By End User
    • Market Attractiveness Analysis
      • By Country
      • By Type
      • By Device Type
      • By Deployment Type
      • By End User
    • Key Takeaways
  15. Western Europe Global Market Analysis 2020 to 2024 and Forecast 2025 to 2035, By Country
    • Historical Market Size Value (USD Million) Trend Analysis By Market Taxonomy, 2020 to 2024
    • Market Size Value (USD Million) Forecast By Market Taxonomy, 2025 to 2035
      • By Country
        • Germany
        • Italy
        • France
        • UK
        • Spain
        • BENELUX
        • Nordic Countries
        • Rest of Western Europe
      • By Type
      • By Device Type
      • By Deployment Type
      • By End User
    • Market Attractiveness Analysis
      • By Country
      • By Type
      • By Device Type
      • By Deployment Type
      • By End User
    • Key Takeaways
  16. Eastern Europe Global Market Analysis 2020 to 2024 and Forecast 2025 to 2035, By Country
    • Historical Market Size Value (USD Million) Trend Analysis By Market Taxonomy, 2020 to 2024
    • Market Size Value (USD Million) Forecast By Market Taxonomy, 2025 to 2035
      • By Country
        • Russia
        • Hungry
        • Poland
        • Rest of Eastern Europe
      • By Type
      • By Device Type
      • By Deployment Type
      • By End User
    • Market Attractiveness Analysis
      • By Country
      • By Type
      • By Device Type
      • By Deployment Type
      • By End User
    • Key Takeaways
  17. East Asia Global Market Analysis 2020 to 2024 and Forecast 2025 to 2035, By Country
    • Historical Market Size Value (USD Million) Trend Analysis By Market Taxonomy, 2020 to 2024
    • Market Size Value (USD Million) Forecast By Market Taxonomy, 2025 to 2035
      • By Country
        • China
        • Japan
        • South Korea
      • By Type
      • By Device Type
      • By Deployment Type
      • By End User
    • Market Attractiveness Analysis
      • By Country
      • By Type
      • By Device Type
      • By Deployment Type
      • By End User
    • Key Takeaways
  18. South Asia Global Market Analysis 2020 to 2024 and Forecast 2025 to 2035, By Country
    • Historical Market Size Value (USD Million) Trend Analysis By Market Taxonomy, 2020 to 2024
    • Market Size Value (USD Million) Forecast By Market Taxonomy, 2025 to 2035
      • By Country
        • India
        • ASEAN Countries
        • Australia & New Zealand
        • Rest of South Asia
      • By Type
      • By Device Type
      • By Deployment Type
      • By End User
    • Market Attractiveness Analysis
      • By Country
      • By Type
      • By Device Type
      • By Deployment Type
      • By End User
    • Key Takeaways
  19. MEA Global Market Analysis 2020 to 2024 and Forecast 2025 to 2035, By Country
    • Historical Market Size Value (USD Million) Trend Analysis By Market Taxonomy, 2020 to 2024
    • Market Size Value (USD Million) Forecast By Market Taxonomy, 2025 to 2035
      • By Country
        • Saudi Arabia
        • Türkiye
        • South Africa
        • Other African Union
        • Rest of MEA
      • By Type
      • By Device Type
      • By Deployment Type
      • By End User
    • Market Attractiveness Analysis
      • By Country
      • By Type
      • By Device Type
      • By Deployment Type
      • By End User
    • Key Takeaways
  20. Key Countries Global Market Analysis
    • USA
      • Pricing Analysis
      • Market Share Analysis, 2024
        • By Type
        • By Device Type
        • By Deployment Type
        • By End User
    • Brazil
      • Pricing Analysis
      • Market Share Analysis, 2024
        • By Type
        • By Device Type
        • By Deployment Type
        • By End User
    • China
      • Pricing Analysis
      • Market Share Analysis, 2024
        • By Type
        • By Device Type
        • By Deployment Type
        • By End User
    • India
      • Pricing Analysis
      • Market Share Analysis, 2024
        • By Type
        • By Device Type
        • By Deployment Type
        • By End User
    • Europe
      • Pricing Analysis
      • Market Share Analysis, 2024
        • By Type
        • By Device Type
        • By Deployment Type
        • By End User
    • Germany
      • Pricing Analysis
      • Market Share Analysis, 2024
        • By Type
        • By Device Type
        • By Deployment Type
        • By End User
    • France
      • Pricing Analysis
      • Market Share Analysis, 2024
        • By Type
        • By Device Type
        • By Deployment Type
        • By End User
    • UK
      • Pricing Analysis
      • Market Share Analysis, 2024
        • By Type
        • By Device Type
        • By Deployment Type
        • By End User
  21. Market Structure Analysis
    • Competition Dashboard
    • Competition Benchmarking
    • Market Share Analysis of Top Players
      • By Regional
      • By Type
      • By Device Type
      • By Deployment Type
      • By End User
  22. Competition Analysis
    • Competition Deep Dive
      • GE HealthCare
        • Overview
        • Product Portfolio
        • Profitability by Market Segments (Product/Age /Sales Channel/Region)
        • Sales Footprint
        • Strategy Overview
          • Marketing Strategy
          • Product Strategy
          • Channel Strategy
      • AEYE Health
        • Overview
        • Product Portfolio
        • Profitability by Market Segments (Product/Age /Sales Channel/Region)
        • Sales Footprint
        • Strategy Overview
          • Marketing Strategy
          • Product Strategy
          • Channel Strategy
      • Optomed Oyj
        • Overview
        • Product Portfolio
        • Profitability by Market Segments (Product/Age /Sales Channel/Region)
        • Sales Footprint
        • Strategy Overview
          • Marketing Strategy
          • Product Strategy
          • Channel Strategy
      • Eyenuk, Inc.
        • Overview
        • Product Portfolio
        • Profitability by Market Segments (Product/Age /Sales Channel/Region)
        • Sales Footprint
        • Strategy Overview
          • Marketing Strategy
          • Product Strategy
          • Channel Strategy
      • Aidoc Medical Ltd.
        • Overview
        • Product Portfolio
        • Profitability by Market Segments (Product/Age /Sales Channel/Region)
        • Sales Footprint
        • Strategy Overview
          • Marketing Strategy
          • Product Strategy
          • Channel Strategy
      • NIDEK Co., Ltd.
        • Overview
        • Product Portfolio
        • Profitability by Market Segments (Product/Age /Sales Channel/Region)
        • Sales Footprint
        • Strategy Overview
          • Marketing Strategy
          • Product Strategy
          • Channel Strategy
      • Topcon Healthcare, Inc.
        • Overview
        • Product Portfolio
        • Profitability by Market Segments (Product/Age /Sales Channel/Region)
        • Sales Footprint
        • Strategy Overview
          • Marketing Strategy
          • Product Strategy
          • Channel Strategy
      • EchoNous
        • Overview
        • Product Portfolio
        • Profitability by Market Segments (Product/Age /Sales Channel/Region)
        • Sales Footprint
        • Strategy Overview
          • Marketing Strategy
          • Product Strategy
          • Channel Strategy
      • Bracco Imaging + Subtle Medical, Inc.
        • Overview
        • Product Portfolio
        • Profitability by Market Segments (Product/Age /Sales Channel/Region)
        • Sales Footprint
        • Strategy Overview
          • Marketing Strategy
          • Product Strategy
          • Channel Strategy
      • Samsung Medison
        • Overview
        • Product Portfolio
        • Profitability by Market Segments (Product/Age /Sales Channel/Region)
        • Sales Footprint
        • Strategy Overview
          • Marketing Strategy
          • Product Strategy
          • Channel Strategy
  23. Assumptions & Acronyms Used
  24. Research Methodology

List of Tables

  • Table 1: Global Global Market Value (USD Million) Forecast by Region, 2020-2035
  • Table 2: Global Global Market Value (USD Million) Forecast by Type, 2020-2035
  • Table 3: Global Global Market Value (USD Million) Forecast by Device Type, 2020-2035
  • Table 4: Global Global Market Value (USD Million) Forecast by Deployment Type, 2020-2035
  • Table 5: Global Global Market Value (USD Million) Forecast by End User, 2020-2035
  • Table 6: North America Global Market Value (USD Million) Forecast by Country, 2020-2035
  • Table 7: North America Global Market Value (USD Million) Forecast by Type, 2020-2035
  • Table 8: North America Global Market Value (USD Million) Forecast by Device Type, 2020-2035
  • Table 9: North America Global Market Value (USD Million) Forecast by Deployment Type, 2020-2035
  • Table 10: North America Global Market Value (USD Million) Forecast by End User, 2020-2035
  • Table 11: Latin America Global Market Value (USD Million) Forecast by Country, 2020-2035
  • Table 12: Latin America Global Market Value (USD Million) Forecast by Type, 2020-2035
  • Table 13: Latin America Global Market Value (USD Million) Forecast by Device Type, 2020-2035
  • Table 14: Latin America Global Market Value (USD Million) Forecast by Deployment Type, 2020-2035
  • Table 15: Latin America Global Market Value (USD Million) Forecast by End User, 2020-2035
  • Table 16: Western Europe Global Market Value (USD Million) Forecast by Country, 2020-2035
  • Table 17: Western Europe Global Market Value (USD Million) Forecast by Type, 2020-2035
  • Table 18: Western Europe Global Market Value (USD Million) Forecast by Device Type, 2020-2035
  • Table 19: Western Europe Global Market Value (USD Million) Forecast by Deployment Type, 2020-2035
  • Table 20: Western Europe Global Market Value (USD Million) Forecast by End User, 2020-2035
  • Table 21: Eastern Europe Global Market Value (USD Million) Forecast by Country, 2020-2035
  • Table 22: Eastern Europe Global Market Value (USD Million) Forecast by Type, 2020-2035
  • Table 23: Eastern Europe Global Market Value (USD Million) Forecast by Device Type, 2020-2035
  • Table 24: Eastern Europe Global Market Value (USD Million) Forecast by Deployment Type, 2020-2035
  • Table 25: Eastern Europe Global Market Value (USD Million) Forecast by End User, 2020-2035
  • Table 26: East Asia Global Market Value (USD Million) Forecast by Country, 2020-2035
  • Table 27: East Asia Global Market Value (USD Million) Forecast by Type, 2020-2035
  • Table 28: East Asia Global Market Value (USD Million) Forecast by Device Type, 2020-2035
  • Table 29: East Asia Global Market Value (USD Million) Forecast by Deployment Type, 2020-2035
  • Table 30: East Asia Global Market Value (USD Million) Forecast by End User, 2020-2035
  • Table 31: South Asia Global Market Value (USD Million) Forecast by Country, 2020-2035
  • Table 32: South Asia Global Market Value (USD Million) Forecast by Type, 2020-2035
  • Table 33: South Asia Global Market Value (USD Million) Forecast by Device Type, 2020-2035
  • Table 34: South Asia Global Market Value (USD Million) Forecast by Deployment Type, 2020-2035
  • Table 35: South Asia Global Market Value (USD Million) Forecast by End User, 2020-2035
  • Table 36: MEA Global Market Value (USD Million) Forecast by Country, 2020-2035
  • Table 37: MEA Global Market Value (USD Million) Forecast by Type, 2020-2035
  • Table 38: MEA Global Market Value (USD Million) Forecast by Device Type, 2020-2035
  • Table 39: MEA Global Market Value (USD Million) Forecast by Deployment Type, 2020-2035
  • Table 40: MEA Global Market Value (USD Million) Forecast by End User, 2020-2035

List of Figures

  • Figure 1: Global Global Market Value (USD Million) by Type, 2025-2035
  • Figure 2: Global Global Market Value (USD Million) by Device Type, 2025-2035
  • Figure 3: Global Global Market Value (USD Million) by Deployment Type, 2025-2035
  • Figure 4: Global Global Market Value (USD Million) by End User, 2025-2035
  • Figure 5: Global Global Market Value (USD Million) by Region, 2025-2035
  • Figure 6: Global Global Market Value (USD Million) Analysis by Region, 2020-2035
  • Figure 7: Global Global Market Value Share (%) and BPS Analysis by Region, 2025-2035
  • Figure 8: Global Global Market Y-o-Y Growth (%) Projections by Region, 2025-2035
  • Figure 9: Global Global Market Value (USD Million) Analysis by Type, 2020-2035
  • Figure 10: Global Global Market Value Share (%) and BPS Analysis by Type, 2025-2035
  • Figure 11: Global Global Market Y-o-Y Growth (%) Projections by Type, 2025-2035
  • Figure 12: Global Global Market Value (USD Million) Analysis by Device Type, 2020-2035
  • Figure 13: Global Global Market Value Share (%) and BPS Analysis by Device Type, 2025-2035
  • Figure 14: Global Global Market Y-o-Y Growth (%) Projections by Device Type, 2025-2035
  • Figure 15: Global Global Market Value (USD Million) Analysis by Deployment Type, 2020-2035
  • Figure 16: Global Global Market Value Share (%) and BPS Analysis by Deployment Type, 2025-2035
  • Figure 17: Global Global Market Y-o-Y Growth (%) Projections by Deployment Type, 2025-2035
  • Figure 18: Global Global Market Value (USD Million) Analysis by End User, 2020-2035
  • Figure 19: Global Global Market Value Share (%) and BPS Analysis by End User, 2025-2035
  • Figure 20: Global Global Market Y-o-Y Growth (%) Projections by End User, 2025-2035
  • Figure 21: Global Global Market Attractiveness by Type, 2025-2035
  • Figure 22: Global Global Market Attractiveness by Device Type, 2025-2035
  • Figure 23: Global Global Market Attractiveness by Deployment Type, 2025-2035
  • Figure 24: Global Global Market Attractiveness by End User, 2025-2035
  • Figure 25: Global Global Market Attractiveness by Region, 2025-2035
  • Figure 26: North America Global Market Value (USD Million) by Type, 2025-2035
  • Figure 27: North America Global Market Value (USD Million) by Device Type, 2025-2035
  • Figure 28: North America Global Market Value (USD Million) by Deployment Type, 2025-2035
  • Figure 29: North America Global Market Value (USD Million) by End User, 2025-2035
  • Figure 30: North America Global Market Value (USD Million) by Country, 2025-2035
  • Figure 31: North America Global Market Value (USD Million) Analysis by Country, 2020-2035
  • Figure 32: North America Global Market Value Share (%) and BPS Analysis by Country, 2025-2035
  • Figure 33: North America Global Market Y-o-Y Growth (%) Projections by Country, 2025-2035
  • Figure 34: North America Global Market Value (USD Million) Analysis by Type, 2020-2035
  • Figure 35: North America Global Market Value Share (%) and BPS Analysis by Type, 2025-2035
  • Figure 36: North America Global Market Y-o-Y Growth (%) Projections by Type, 2025-2035
  • Figure 37: North America Global Market Value (USD Million) Analysis by Device Type, 2020-2035
  • Figure 38: North America Global Market Value Share (%) and BPS Analysis by Device Type, 2025-2035
  • Figure 39: North America Global Market Y-o-Y Growth (%) Projections by Device Type, 2025-2035
  • Figure 40: North America Global Market Value (USD Million) Analysis by Deployment Type, 2020-2035
  • Figure 41: North America Global Market Value Share (%) and BPS Analysis by Deployment Type, 2025-2035
  • Figure 42: North America Global Market Y-o-Y Growth (%) Projections by Deployment Type, 2025-2035
  • Figure 43: North America Global Market Value (USD Million) Analysis by End User, 2020-2035
  • Figure 44: North America Global Market Value Share (%) and BPS Analysis by End User, 2025-2035
  • Figure 45: North America Global Market Y-o-Y Growth (%) Projections by End User, 2025-2035
  • Figure 46: North America Global Market Attractiveness by Type, 2025-2035
  • Figure 47: North America Global Market Attractiveness by Device Type, 2025-2035
  • Figure 48: North America Global Market Attractiveness by Deployment Type, 2025-2035
  • Figure 49: North America Global Market Attractiveness by End User, 2025-2035
  • Figure 50: North America Global Market Attractiveness by Country, 2025-2035
  • Figure 51: Latin America Global Market Value (USD Million) by Type, 2025-2035
  • Figure 52: Latin America Global Market Value (USD Million) by Device Type, 2025-2035
  • Figure 53: Latin America Global Market Value (USD Million) by Deployment Type, 2025-2035
  • Figure 54: Latin America Global Market Value (USD Million) by End User, 2025-2035
  • Figure 55: Latin America Global Market Value (USD Million) by Country, 2025-2035
  • Figure 56: Latin America Global Market Value (USD Million) Analysis by Country, 2020-2035
  • Figure 57: Latin America Global Market Value Share (%) and BPS Analysis by Country, 2025-2035
  • Figure 58: Latin America Global Market Y-o-Y Growth (%) Projections by Country, 2025-2035
  • Figure 59: Latin America Global Market Value (USD Million) Analysis by Type, 2020-2035
  • Figure 60: Latin America Global Market Value Share (%) and BPS Analysis by Type, 2025-2035
  • Figure 61: Latin America Global Market Y-o-Y Growth (%) Projections by Type, 2025-2035
  • Figure 62: Latin America Global Market Value (USD Million) Analysis by Device Type, 2020-2035
  • Figure 63: Latin America Global Market Value Share (%) and BPS Analysis by Device Type, 2025-2035
  • Figure 64: Latin America Global Market Y-o-Y Growth (%) Projections by Device Type, 2025-2035
  • Figure 65: Latin America Global Market Value (USD Million) Analysis by Deployment Type, 2020-2035
  • Figure 66: Latin America Global Market Value Share (%) and BPS Analysis by Deployment Type, 2025-2035
  • Figure 67: Latin America Global Market Y-o-Y Growth (%) Projections by Deployment Type, 2025-2035
  • Figure 68: Latin America Global Market Value (USD Million) Analysis by End User, 2020-2035
  • Figure 69: Latin America Global Market Value Share (%) and BPS Analysis by End User, 2025-2035
  • Figure 70: Latin America Global Market Y-o-Y Growth (%) Projections by End User, 2025-2035
  • Figure 71: Latin America Global Market Attractiveness by Type, 2025-2035
  • Figure 72: Latin America Global Market Attractiveness by Device Type, 2025-2035
  • Figure 73: Latin America Global Market Attractiveness by Deployment Type, 2025-2035
  • Figure 74: Latin America Global Market Attractiveness by End User, 2025-2035
  • Figure 75: Latin America Global Market Attractiveness by Country, 2025-2035
  • Figure 76: Western Europe Global Market Value (USD Million) by Type, 2025-2035
  • Figure 77: Western Europe Global Market Value (USD Million) by Device Type, 2025-2035
  • Figure 78: Western Europe Global Market Value (USD Million) by Deployment Type, 2025-2035
  • Figure 79: Western Europe Global Market Value (USD Million) by End User, 2025-2035
  • Figure 80: Western Europe Global Market Value (USD Million) by Country, 2025-2035
  • Figure 81: Western Europe Global Market Value (USD Million) Analysis by Country, 2020-2035
  • Figure 82: Western Europe Global Market Value Share (%) and BPS Analysis by Country, 2025-2035
  • Figure 83: Western Europe Global Market Y-o-Y Growth (%) Projections by Country, 2025-2035
  • Figure 84: Western Europe Global Market Value (USD Million) Analysis by Type, 2020-2035
  • Figure 85: Western Europe Global Market Value Share (%) and BPS Analysis by Type, 2025-2035
  • Figure 86: Western Europe Global Market Y-o-Y Growth (%) Projections by Type, 2025-2035
  • Figure 87: Western Europe Global Market Value (USD Million) Analysis by Device Type, 2020-2035
  • Figure 88: Western Europe Global Market Value Share (%) and BPS Analysis by Device Type, 2025-2035
  • Figure 89: Western Europe Global Market Y-o-Y Growth (%) Projections by Device Type, 2025-2035
  • Figure 90: Western Europe Global Market Value (USD Million) Analysis by Deployment Type, 2020-2035
  • Figure 91: Western Europe Global Market Value Share (%) and BPS Analysis by Deployment Type, 2025-2035
  • Figure 92: Western Europe Global Market Y-o-Y Growth (%) Projections by Deployment Type, 2025-2035
  • Figure 93: Western Europe Global Market Value (USD Million) Analysis by End User, 2020-2035
  • Figure 94: Western Europe Global Market Value Share (%) and BPS Analysis by End User, 2025-2035
  • Figure 95: Western Europe Global Market Y-o-Y Growth (%) Projections by End User, 2025-2035
  • Figure 96: Western Europe Global Market Attractiveness by Type, 2025-2035
  • Figure 97: Western Europe Global Market Attractiveness by Device Type, 2025-2035
  • Figure 98: Western Europe Global Market Attractiveness by Deployment Type, 2025-2035
  • Figure 99: Western Europe Global Market Attractiveness by End User, 2025-2035
  • Figure 100: Western Europe Global Market Attractiveness by Country, 2025-2035
  • Figure 101: Eastern Europe Global Market Value (USD Million) by Type, 2025-2035
  • Figure 102: Eastern Europe Global Market Value (USD Million) by Device Type, 2025-2035
  • Figure 103: Eastern Europe Global Market Value (USD Million) by Deployment Type, 2025-2035
  • Figure 104: Eastern Europe Global Market Value (USD Million) by End User, 2025-2035
  • Figure 105: Eastern Europe Global Market Value (USD Million) by Country, 2025-2035
  • Figure 106: Eastern Europe Global Market Value (USD Million) Analysis by Country, 2020-2035
  • Figure 107: Eastern Europe Global Market Value Share (%) and BPS Analysis by Country, 2025-2035
  • Figure 108: Eastern Europe Global Market Y-o-Y Growth (%) Projections by Country, 2025-2035
  • Figure 109: Eastern Europe Global Market Value (USD Million) Analysis by Type, 2020-2035
  • Figure 110: Eastern Europe Global Market Value Share (%) and BPS Analysis by Type, 2025-2035
  • Figure 111: Eastern Europe Global Market Y-o-Y Growth (%) Projections by Type, 2025-2035
  • Figure 112: Eastern Europe Global Market Value (USD Million) Analysis by Device Type, 2020-2035
  • Figure 113: Eastern Europe Global Market Value Share (%) and BPS Analysis by Device Type, 2025-2035
  • Figure 114: Eastern Europe Global Market Y-o-Y Growth (%) Projections by Device Type, 2025-2035
  • Figure 115: Eastern Europe Global Market Value (USD Million) Analysis by Deployment Type, 2020-2035
  • Figure 116: Eastern Europe Global Market Value Share (%) and BPS Analysis by Deployment Type, 2025-2035
  • Figure 117: Eastern Europe Global Market Y-o-Y Growth (%) Projections by Deployment Type, 2025-2035
  • Figure 118: Eastern Europe Global Market Value (USD Million) Analysis by End User, 2020-2035
  • Figure 119: Eastern Europe Global Market Value Share (%) and BPS Analysis by End User, 2025-2035
  • Figure 120: Eastern Europe Global Market Y-o-Y Growth (%) Projections by End User, 2025-2035
  • Figure 121: Eastern Europe Global Market Attractiveness by Type, 2025-2035
  • Figure 122: Eastern Europe Global Market Attractiveness by Device Type, 2025-2035
  • Figure 123: Eastern Europe Global Market Attractiveness by Deployment Type, 2025-2035
  • Figure 124: Eastern Europe Global Market Attractiveness by End User, 2025-2035
  • Figure 125: Eastern Europe Global Market Attractiveness by Country, 2025-2035
  • Figure 126: East Asia Global Market Value (USD Million) by Type, 2025-2035
  • Figure 127: East Asia Global Market Value (USD Million) by Device Type, 2025-2035
  • Figure 128: East Asia Global Market Value (USD Million) by Deployment Type, 2025-2035
  • Figure 129: East Asia Global Market Value (USD Million) by End User, 2025-2035
  • Figure 130: East Asia Global Market Value (USD Million) by Country, 2025-2035
  • Figure 131: East Asia Global Market Value (USD Million) Analysis by Country, 2020-2035
  • Figure 132: East Asia Global Market Value Share (%) and BPS Analysis by Country, 2025-2035
  • Figure 133: East Asia Global Market Y-o-Y Growth (%) Projections by Country, 2025-2035
  • Figure 134: East Asia Global Market Value (USD Million) Analysis by Type, 2020-2035
  • Figure 135: East Asia Global Market Value Share (%) and BPS Analysis by Type, 2025-2035
  • Figure 136: East Asia Global Market Y-o-Y Growth (%) Projections by Type, 2025-2035
  • Figure 137: East Asia Global Market Value (USD Million) Analysis by Device Type, 2020-2035
  • Figure 138: East Asia Global Market Value Share (%) and BPS Analysis by Device Type, 2025-2035
  • Figure 139: East Asia Global Market Y-o-Y Growth (%) Projections by Device Type, 2025-2035
  • Figure 140: East Asia Global Market Value (USD Million) Analysis by Deployment Type, 2020-2035
  • Figure 141: East Asia Global Market Value Share (%) and BPS Analysis by Deployment Type, 2025-2035
  • Figure 142: East Asia Global Market Y-o-Y Growth (%) Projections by Deployment Type, 2025-2035
  • Figure 143: East Asia Global Market Value (USD Million) Analysis by End User, 2020-2035
  • Figure 144: East Asia Global Market Value Share (%) and BPS Analysis by End User, 2025-2035
  • Figure 145: East Asia Global Market Y-o-Y Growth (%) Projections by End User, 2025-2035
  • Figure 146: East Asia Global Market Attractiveness by Type, 2025-2035
  • Figure 147: East Asia Global Market Attractiveness by Device Type, 2025-2035
  • Figure 148: East Asia Global Market Attractiveness by Deployment Type, 2025-2035
  • Figure 149: East Asia Global Market Attractiveness by End User, 2025-2035
  • Figure 150: East Asia Global Market Attractiveness by Country, 2025-2035
  • Figure 151: South Asia Global Market Value (USD Million) by Type, 2025-2035
  • Figure 152: South Asia Global Market Value (USD Million) by Device Type, 2025-2035
  • Figure 153: South Asia Global Market Value (USD Million) by Deployment Type, 2025-2035
  • Figure 154: South Asia Global Market Value (USD Million) by End User, 2025-2035
  • Figure 155: South Asia Global Market Value (USD Million) by Country, 2025-2035
  • Figure 156: South Asia Global Market Value (USD Million) Analysis by Country, 2020-2035
  • Figure 157: South Asia Global Market Value Share (%) and BPS Analysis by Country, 2025-2035
  • Figure 158: South Asia Global Market Y-o-Y Growth (%) Projections by Country, 2025-2035
  • Figure 159: South Asia Global Market Value (USD Million) Analysis by Type, 2020-2035
  • Figure 160: South Asia Global Market Value Share (%) and BPS Analysis by Type, 2025-2035
  • Figure 161: South Asia Global Market Y-o-Y Growth (%) Projections by Type, 2025-2035
  • Figure 162: South Asia Global Market Value (USD Million) Analysis by Device Type, 2020-2035
  • Figure 163: South Asia Global Market Value Share (%) and BPS Analysis by Device Type, 2025-2035
  • Figure 164: South Asia Global Market Y-o-Y Growth (%) Projections by Device Type, 2025-2035
  • Figure 165: South Asia Global Market Value (USD Million) Analysis by Deployment Type, 2020-2035
  • Figure 166: South Asia Global Market Value Share (%) and BPS Analysis by Deployment Type, 2025-2035
  • Figure 167: South Asia Global Market Y-o-Y Growth (%) Projections by Deployment Type, 2025-2035
  • Figure 168: South Asia Global Market Value (USD Million) Analysis by End User, 2020-2035
  • Figure 169: South Asia Global Market Value Share (%) and BPS Analysis by End User, 2025-2035
  • Figure 170: South Asia Global Market Y-o-Y Growth (%) Projections by End User, 2025-2035
  • Figure 171: South Asia Global Market Attractiveness by Type, 2025-2035
  • Figure 172: South Asia Global Market Attractiveness by Device Type, 2025-2035
  • Figure 173: South Asia Global Market Attractiveness by Deployment Type, 2025-2035
  • Figure 174: South Asia Global Market Attractiveness by End User, 2025-2035
  • Figure 175: South Asia Global Market Attractiveness by Country, 2025-2035
  • Figure 176: MEA Global Market Value (USD Million) by Type, 2025-2035
  • Figure 177: MEA Global Market Value (USD Million) by Device Type, 2025-2035
  • Figure 178: MEA Global Market Value (USD Million) by Deployment Type, 2025-2035
  • Figure 179: MEA Global Market Value (USD Million) by End User, 2025-2035
  • Figure 180: MEA Global Market Value (USD Million) by Country, 2025-2035
  • Figure 181: MEA Global Market Value (USD Million) Analysis by Country, 2020-2035
  • Figure 182: MEA Global Market Value Share (%) and BPS Analysis by Country, 2025-2035
  • Figure 183: MEA Global Market Y-o-Y Growth (%) Projections by Country, 2025-2035
  • Figure 184: MEA Global Market Value (USD Million) Analysis by Type, 2020-2035
  • Figure 185: MEA Global Market Value Share (%) and BPS Analysis by Type, 2025-2035
  • Figure 186: MEA Global Market Y-o-Y Growth (%) Projections by Type, 2025-2035
  • Figure 187: MEA Global Market Value (USD Million) Analysis by Device Type, 2020-2035
  • Figure 188: MEA Global Market Value Share (%) and BPS Analysis by Device Type, 2025-2035
  • Figure 189: MEA Global Market Y-o-Y Growth (%) Projections by Device Type, 2025-2035
  • Figure 190: MEA Global Market Value (USD Million) Analysis by Deployment Type, 2020-2035
  • Figure 191: MEA Global Market Value Share (%) and BPS Analysis by Deployment Type, 2025-2035
  • Figure 192: MEA Global Market Y-o-Y Growth (%) Projections by Deployment Type, 2025-2035
  • Figure 193: MEA Global Market Value (USD Million) Analysis by End User, 2020-2035
  • Figure 194: MEA Global Market Value Share (%) and BPS Analysis by End User, 2025-2035
  • Figure 195: MEA Global Market Y-o-Y Growth (%) Projections by End User, 2025-2035
  • Figure 196: MEA Global Market Attractiveness by Type, 2025-2035
  • Figure 197: MEA Global Market Attractiveness by Device Type, 2025-2035
  • Figure 198: MEA Global Market Attractiveness by Deployment Type, 2025-2035
  • Figure 199: MEA Global Market Attractiveness by End User, 2025-2035
  • Figure 200: MEA Global Market Attractiveness by Country, 2025-2035

Frequently Asked Questions

How big is the Global Autonomous Imaging Market in 2025?

The global autonomous imaging market is estimated to be valued at USD 1,892.0 million in 2025.

What will be the size of the Global Autonomous Imaging Market in 2035?

The market size for the global autonomous imaging market is projected to reach approximately USD 4,199.58 million by 2035.

How much will the Global Autonomous Imaging Market grow between 2025 and 2035?

The global autonomous imaging market is expected to grow at a CAGR of 8.3% between 2025 and 2035.

What are the key type in the Global Autonomous Imaging Market?

The key types in the Global Autonomous Imaging Market include Semi-autonomous Systems and Fully Autonomous Systems.

Which Device type segment will contribute a significant share in the Global Autonomous Imaging Market in 2025?

In terms of device, CT Scanner is projected to command the highest share at 32.7% in the global autonomous imaging market in 2025.

Explore Similar Insights

Future Market Insights

Autonomous Imaging Market

Chat With

MaRIA

Hi There, I am MaRIA, Your Market Research Intelligence Assistant. How may I help you?