Reports

- Global Locations -

Headquarters

Future Market Insights, Inc.

Christiana Corporate, 200
Continental Drive, Suite 401,
Newark, Delaware - 19713,
United States

T: +1-845-579-5705

Americas

Future Market Insights, Inc.

616 Corporate Way, Suite 2-9018,
Valley Cottage, NY 10989, United States

T: +1-347-918-3531

MEA

Future Market Insights

1602-6 Jumeirah Bay X2 Tower, Plot No: JLT-PH2-X2A,
Jumeirah Lakes Towers, Dubai,
United Arab Emirates

Europe

Future Market Insights

3rd Floor, 207 Regent Street,
W1B 3HH London
United Kingdom

T: + 44 (0) 20 8123 9659
D: +44 (0) 20 3287 4268

Asia Pacific

Future Market Insights

IndiaLand Global Tech Park, Unit UG-1, Behind Grand HighStreet, Phase 1, Hinjawadi, MH, Pune – 411057, India

Autonomous Drone Platform Market Overview

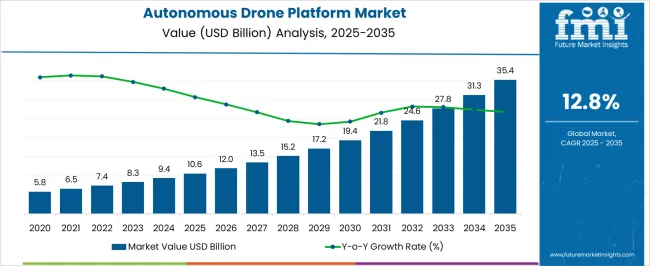
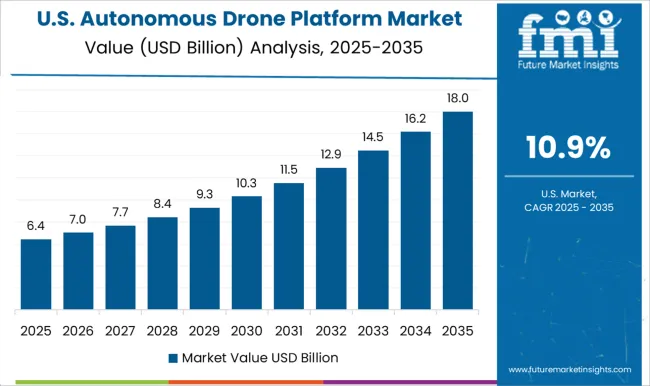
The autonomous drone platform market is projected to have a significant CAGR of 12.8% by 2033. According to FMI, the market is expected to expand from US$ 8.3 billion in 2023 to US$ 24.9 billion by 2033.

A negative reputation surrounds drones. Most people equate them with pricey military planes or little consumer toys. Recent research by FMI, however, indicates that real-world commercial uses actually influence how drones develop in the future.

Due to their increased capacity for efficiency and data analytics, drone use in corporate operations has expanded across a variety of industries in recent years. Since 2012, VCs have put $1.5 billion into drone industry-shaping businesses.

A number of drone operators are aggressively expanding their operations to satisfy the demands of various end users, which is likely to boost efficiency and industrial output. This is predicted to fuel the autonomous drone platform market growth during the forecast period.

The military and law enforcement employ unmanned aerial vehicles (UAVs) for warfare, distant observation, and investigative tasks. Additionally, using big data, artificial intelligence, and other technologies, the military collaborates with entrepreneurs to create autonomous UAV drone capabilities. These factors support the demand for autonomous drones platform throughout the anticipated time period.

Don't pay for what you don't need

Customize your report by selecting specific countries or regions and save 30%!

Commercial Sector Takes a Surprising Lead over Military Demand in the Autonomous Drone Platform Market

Drones can take the place of conventional ways of operation in many commercial operations. This development follows the Federal Aviation Administration's expansion of drone usage authorizations for commercial, non-hobbyist use.

Moreover, drones can save time and money, as they require fewer humans to operate and lack safety infrastructure. Additionally, they can improve data analytics, which helps businesses understand and forecast operating performance. The adoption of autonomous drones platform even opens up new business models and prospects in some sectors.

The majority of the value is created by services that operate and maintain drones for businesses. End-user businesses hand over to outside parties the operations, data management, and maintenance of drones. For instance, telecommunications companies may end up selling drone data communications services to direct drones and send the data they collect.

AI Analytics- Motivators to Autonomous Drone Platform Market Investment

The vast commercial market potential, the falling costs of drone parts (such as sensors and batteries), and technological advancements in artificial intelligence (AI) and analytics are the primary motivators for investments in the autonomous drone platform market.
These factors have led to a steady increase in market share. For instance, as of June 2017, 52 trades totaling $216 million have been seen, surpassing the annual total of 2014 by 11 deals and $52 million in the market. At the current run rate, deals involving $506 million in investment are anticipated to reach a record high of 122.

Furthermore, it is anticipated that the market continues to rise as a result of the main players' growing investments in the drone business, like Amazon and Google.

Attributes Details
Autonomous Drone Platform Market CAGR (2023 to 2033) 12.8%
Autonomous Drone Platform Market Size (2023) US$ 8.3 billion
Autonomous Drone Platform Market Size (2033) US$ 24.9 billion
Sudip Saha
Sudip Saha

Principal Consultant

Talk to Analyst

Find your sweet spots for generating winning opportunities in this market.

Does the Autonomous Drone Platform Market have a Promising Future? Industry Analysis from (2018 to 2022) to (2023 to 2033)

Moreover, revenue generation in the market expanded at a 12.7% CAGR from 2018 to 2022. With a value of US$ 7.5 billion in 2022, the market is seeing lucrative opportunities and is expected to reach US$ 24.9 billion by 2033.

Earlier drones have a specified application in military operations, such as surveillance, reconnaissance, and target acquisition. These drones are equipped with advanced sensors and cameras to provide real-time data to military personnel. For instance, the USA Air Force is using MQ-9 Reaper drones for surveillance and intimidation of enemies.

However, sales of autonomous drone platforms are becoming common in the commercial sector due to technological improvements. Due to this, it is predicted that in the short run, demand for autonomous drone platforms is likely to expand quickly, reaching US$ 11.7 billion by 2026.

What are the Latest Trends Advancing the Autonomous Drone Platform Market?

Increased Demand for Miniaturization

Drones that can fly independently without human control have been developed as a result of the increased desire for drones to be miniature. Compared to manually controlled drones, autonomous drones are capable of doing tasks like surveillance, mapping, and delivery in a safer and more effective way.

Introduction of GPS and Sensors

GPS and other navigational sensors are major reasons behind the high sales of autonomous drone platforms. Due to the elimination of the necessity for a pilot, commercial users are now more likely to be interested in autonomous drone platforms.

Swarm Intelligence

Swarm intelligence uses AI to plan the actions of hundreds or thousands of robots, imitating the way some groups of animals cooperate, enabling drones to collectively compete in increasingly difficult jobs.

Currently, humans train collaborative robots, but that day is quickly approaching when robots are able to think by themselves and instruct one another. Drone squadrons can simultaneously perform specific jobs and cover large geographic areas. Swarm intelligence encourages the autonomous drone platform market share further.

Get the data you need at a Fraction of the cost

Personalize your report by choosing insights you need
and save 40%!

Comparative View of Autonomous Drone Platform Market

Autonomous Drone Platform Market:

Attributes Autonomous Drone Platform Market
CAGR (2023 to 2033) 12.8%
Market Value (2033) US$ 24.9 billion
Growth Factor Demand is high in the commercial and military sectors due to several applications.
Opportunity The widespread use of autonomous drone platforms and their strong sales are largely due to GPS and other navigational sensors.
Key Trends Swarm intelligence uses AI to plan and open up new possibilities for the market players.

Commercial Drones Market:

Attributes Commercial Drones Market
CAGR (2023 to 2033) 23.7%
Market Value (2033) US$ 21.69 billion
Growth Factor Location-based services, like e-commerce businesses, drive market expansion.
Opportunity Manufacturers are encouraged to boost output for better income generation through motion and temperature sensors in cameras.
Key Trends Aerial Imaging and green mapping are the recent trends encouraging the market share.

Toy Drones Market:

Attributes Toy Drones Market
CAGR (2023 to 2033) 8.6%
Market Value (2033) US$ 951.5 million
Growth Factor Growth is attributed to programmed intelligence and real-time interaction.
Opportunity Microcontrollers that support Bluetooth and Wi-Fi allow connected toys to use mobile devices to access a range of online services, fostering the growth of the global industry.
Key Trends The most recent generation of consumer drones is used widely in drone competitions and sports.

Category Analysis

Cutting-edge Technologies in Agriculture Support the Demand for Autonomous Drone Platform

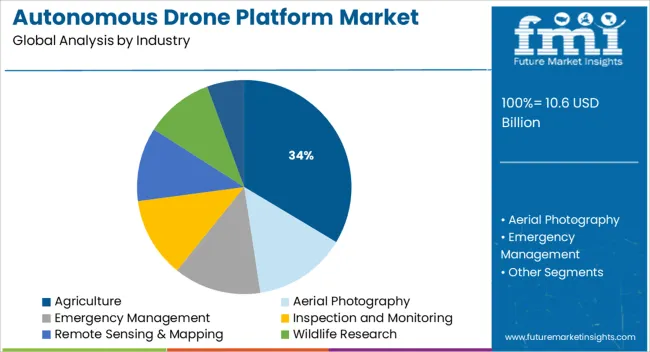
Agriculture Industry dominated the market with a share of 20.1% in 2021. It is expected to have a CAGR of 4.9% during the forecast period.

The increasing demand for drone-assisted agricultural automation and crop monitoring is providing new opportunities to autonomous drone platform manufacturers. They are employed in farming processes like crop scouting, crop mapping, crop spraying, and plant health monitoring, among others.

Increasing investments in agricultural technology, rising demand for precision farming, and government programs to encourage the use of autonomous drones are some of the major market growth drivers.

The availability of cutting-edge technologies like artificial intelligence, machine learning, and computer vision, as well as the increasing demand for crop monitoring and the need to lower the cost of farming operations, are all contributing to the autonomous drone platform market share.

Need for UAVs- Future of Military & Defense

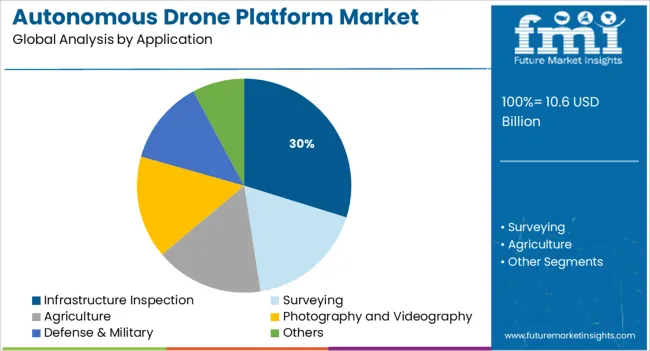
Defense and military, where the adoption of autonomous drone platforms is at its highest, with a market share of 25.8% in 2021.

The need for autonomous drone systems in military and defense applications has considerably increased in recent years. Unmanned aerial vehicles (UAVs) that can complete missions with little to no human intervention are popular in this sector.

Additionally, the growing demand for unmanned aerial systems (UASs) for lengthy flights and the expanding use of UAVs for border surveillance, search and rescue missions, and military activities are anticipated to propel market growth.
Regional Analysis

Government Actions Directly Impact the Adoption Trends of Autonomous Drone Platforms

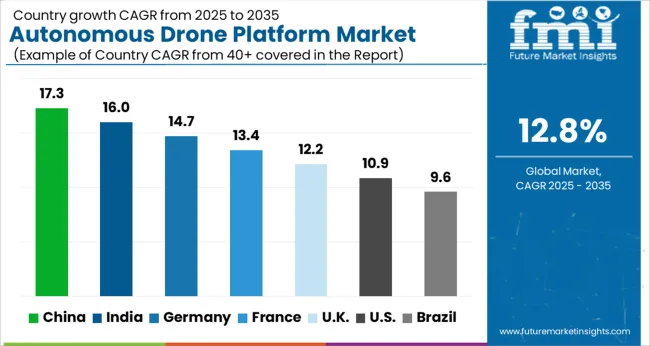
The USA dominated the North American autonomous drone platform market with a share of 13.4% in 2021.

Over the projected period, it is anticipated that the United States would employ a more autonomous drone platform. This is brought on by the rise in demand for autonomous drone platforms for industrial, commercial, and government uses.

Additionally, the USA government has taken action to encourage the use of autonomous drone platforms for a range of tasks, including monitoring and surveillance, package delivery, and search and rescue operations. It is anticipated that rising research and development efforts in the area of autonomous drone platforms further fuel market expansion.

For example, the USA Air Force launched a project in 2020 that was centered on the creation of autonomous drone systems. The project's objective was to create a drone platform that could be utilized for surveillance and reconnaissance missions.

In addition, rising investments in the commercial and defense sectors are anticipated to fuel market expansion in North America.

Well-known Leaders in Germany Add up to Adequate Investment in the Market

The demand for autonomous drone platform has grown in Germany, with a share of 10.3% in 2021. This is attributed to the developments in drone technology, including obstacle avoidance systems and autonomous navigation capabilities.

In addition, the growing need for commercial drone services from the government and other public and private entities is anticipated to propel market expansion in Germany. DJI, Yuneec, senseFly, Parrot, and Autel Robotics are the market leaders in Germany for autonomous drone platform. To meet the needs of different consumers, these businesses provide a wide range of goods, including fixed-wing and multirotor platform.
Drone Fund Assist the Production of Autonomous Drone Platform in Japan

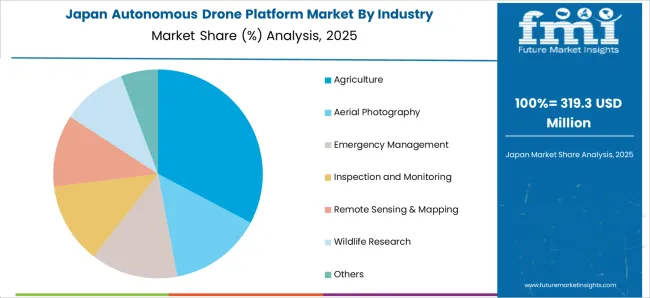
The demand for inspection, monitoring, and delivery services using drones is likely to grow, which would help the Japanese market for autonomous drone platform expand. The industry is also expanding, with a share of 5.5% as a result of the military and defense industries' increasing desire for drones.

Moreover, the Japanese government has also made steps to encourage drone use in the nation. The U-space project, started by the government, proposes to use of drones in the logistics and transportation industries.

In order to aid in the development of drone-related goods and services in Japan, the government has also established the Drone Fund. SoftBank, NEC Corporation, Skycatch, Autel Robotics, and DJI are the leading companies active in the Japanese market for autonomous drone platform.
Competitive Landscape

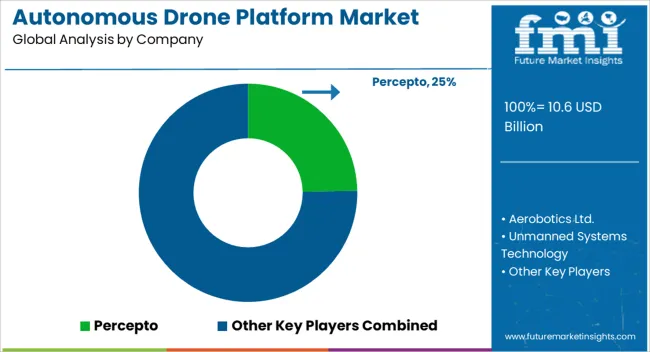
Major Corporate Ventures Primarily Support the Market Share and Encourage Start-Ups to Enter Into the Industry.

Most investments have not yet resulted in the anticipated exits or IPOs, as the industry is still relatively new. There have been 34 exits and IPOs since 2012, and more are anticipated in the following years.

With more than two-thirds of corporate deals during the previous five quarters occurring at the seed or series A level, the financings have likewise tended to favor early-stage businesses.

Moreover, corporate initiatives are seeking to penetrate particular markets or to gain expertise in particular fields, such as detect-and-avoid capabilities, which would give drones the "sense" to avoid collisions and safely complete their missions.

A few enterprises competing for market share become de facto standards, while the remaining businesses are squeezed out as a result of consolidation.

Companies Ventures
Qualcomm Ventures The most active venture capitalist, having invested in six businesses thus far, including those involved in mapping, pipe inspection, distribution, 3D mapping, autonomous solutions, and business solutions. In order to advance their cellular technology inside drone operations and introduce their own robotics business solutions, Qualcomm also bought Kmel Robotics.
Google Venture Google Venture has also made significant investments in 3D mapping, end-to-end commercial solutions, and long-range delivery. 63 drone-related patents from Google Ventures have been created, covering a range of drone capabilities.
Intel Venture It has made investments in a hardware firm, an analytics solution, and an entire end-to-end commercial solution. Additionally, they bought two businesses: Ascending Technologies, which creates "sense and avoid" algorithms, and MaVinci, which creates flight planning software. These investments and acquisitions have helped Intel build its own commercial drone application solutions.

To create more sophisticated features and capabilities, autonomous drone platform manufacturers work with software creators, hardware manufacturers, and other drone industry partners. By doing so, they are able to outperform the competition and provide their clients with better value.

Active Collaborations in the Market

  • Companies like Amazon, DJI, and Microsoft are working together to develop more powerful and accessible autonomous drone systems.
    • These partnerships are promoting the creation of cutting-edge hardware and software elements that allow drones to fly on their own.
    • The businesses involved in these partnerships are collaborating to make drones more effective, safe, and less expensive to operate.
  • Other partnerships, like the Dronecode Project, are assisting in bringing together a wide range of stakeholders to investigate how drones can be used responsibly and safely.
    • These partnerships are assisting in the development of a more regulated and safe market for autonomous drone platforms.

Key players

  • DroneDeploy
  • 3D Robotics
  • Airware
  • AeroVironment
  • Parrot SA
  • PrecisionHawk
  • SkyWard
  • Cyphy Works
  • Yuneec International Co. Ltd
  • DJI

Key segments

By Industry:

  • Agriculture
  • Aerial Photography
  • Emergency Management
  • Inspection and Monitoring
  • Remote Sensing & Mapping
  • Wildlife Research
  • Others

By Application:

  • Infrastructure Inspection
  • Surveying
  • Agriculture
  • Photography and Videography
  • Defense & Military
  • Others

By Enterprise Size:

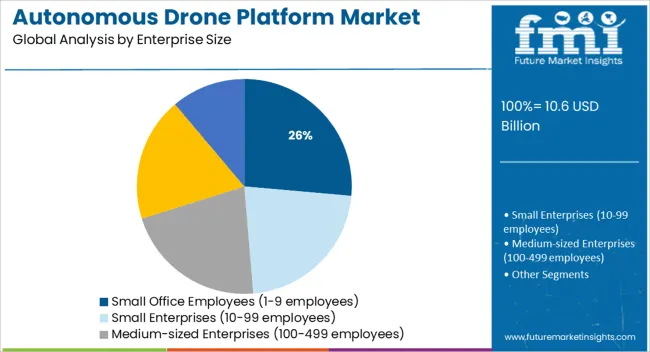
  • Small Office Employees (1-9 employees)
  • Small Enterprises (10-99 employees)
  • Medium-sized Enterprises (100-499 employees)
  • Large Enterprises (500-999)
  • Very Large Enterprises (1000+ employees)

By Region:

  • North America
  • Latin America
  • Europe
  • East Asia
  • South Asia and the Pacific
  • Middle East & Africa

Frequently Asked Questions

What is the Growth Outlook of the Autonomous Drone Platform Market?

The autonomous drone platform market is estimated to record a CAGR of 12.8% during the forecast period.

What is the Projected Value of the Autonomous Drone Platform Market By 2033?

The autonomous drone platform market size is predicted to be valued at US$ 24.9 billion by 2033.

What is the Present Size of the Autonomous Drone Platform Market?

The autonomous drone platform market share is valued at US$ 8.3 billion in 2023.

Which is the Leading Region in the Autonomous Drone Platform Market?

North America is anticipated to hold the largest autonomous drone platform market share of 21.2% in 2021.

Which is the Leading Segment in the Autonomous Drone Platform Market, Based on Industry?

The agriculture industry is likely to dominate the autonomous drone platform market, with a share of 20.1% in 2021.

Table of Content

1. Executive Summary | Autonomous Drone Platform Market

    1.1. Global Market Outlook

    1.2. Demand-side Trends

    1.3. Supply-side Trends

    1.4. Technology Roadmap Analysis

    1.5. Analysis and Recommendations

2. Market Overview

    2.1. Market Coverage / Taxonomy

    2.2. Market Definition / Scope / Limitations

3. Market Background

    3.1. Market Dynamics

        3.1.1. Drivers

        3.1.2. Restraints

        3.1.3. Opportunity 

        3.1.4. Trends

    3.2. Scenario Forecast

        3.2.1. Demand in Optimistic Scenario

        3.2.2. Demand in Likely Scenario

        3.2.3. Demand in Conservative Scenario

    3.3. Opportunity Map Analysis

    3.4. Product Life Cycle Analysis

    3.5. Supply Chain Analysis

        3.5.1. Supply Side Participants and their Roles

            3.5.1.1. Producers

            3.5.1.2. Mid-Level Participants (Traders/ Agents/ Brokers)

            3.5.1.3. Wholesalers and Distributors

        3.5.2. Value Added and Value Created at Node in the Supply Chain

        3.5.3. List of Raw Material Suppliers

        3.5.4. List of Existing and Potential Buyers

    3.6. Investment Feasibility Matrix

    3.7. Value Chain Analysis

        3.7.1. Profit Margin Analysis

        3.7.2. Wholesalers and Distributors

        3.7.3. Retailers

    3.8. PESTLE and Porter’s Analysis

    3.9. Regulatory Landscape

        3.9.1. By Key Regions

        3.9.2. By Key Countries

    3.10. Regional Parent Market Outlook

    3.11. Production and Consumption Statistics

    3.12. Import and Export Statistics

4. Global Market Analysis 2017 to 2021 and Forecast, 2022 to 2032

    4.1. Historical Market Size Value (US$ Million) & Volume (Units) Analysis, 2017 to 2021

    4.2. Current and Future Market Size Value (US$ Million) & Volume (Units) Projections, 2022 to 2032

        4.2.1. Y-o-Y Growth Trend Analysis

        4.2.2. Absolute $ Opportunity Analysis

5. Global Market Analysis 2017 to 2021 and Forecast 2022 to 2032, By Platform Type

    5.1. Introduction / Key Findings

    5.2. Historical Market Size Value (US$ Million) & Volume (Units) Analysis By Platform Type, 2017 to 2021

    5.3. Current and Future Market Size Value (US$ Million) & Volume (Units) Analysis and Forecast By Platform Type, 2022 to 2032

        5.3.1. Containarized Landing Platform

        5.3.2. In-Box Landing Platform

    5.4. Y-o-Y Growth Trend Analysis By Platform Type, 2017 to 2021

    5.5. Absolute $ Opportunity Analysis By Platform Type, 2022 to 2032

6. Global Market Analysis 2017 to 2021 and Forecast 2022 to 2032, By Application

    6.1. Introduction / Key Findings

    6.2. Historical Market Size Value (US$ Million) & Volume (Units) Analysis By Application, 2017 to 2021

    6.3. Current and Future Market Size Value (US$ Million) & Volume (Units) Analysis and Forecast By Application, 2022 to 2032

        6.3.1. Landing Pad

        6.3.2. Recharging Station

        6.3.3. Shelter & Maintenance

        6.3.4. Data Storage

    6.4. Y-o-Y Growth Trend Analysis By Application, 2017 to 2021

    6.5. Absolute $ Opportunity Analysis By Application, 2022 to 2032

7. Global Market Analysis 2017 to 2021 and Forecast 2022 to 2032, By End Use

    7.1. Introduction / Key Findings

    7.2. Historical Market Size Value (US$ Million) & Volume (Units) Analysis By End Use, 2017 to 2021

    7.3. Current and Future Market Size Value (US$ Million) & Volume (Units) Analysis and Forecast By End Use, 2022 to 2032

        7.3.1. Military & Defense

        7.3.2. Commercial

        7.3.3. Government

    7.4. Y-o-Y Growth Trend Analysis By End Use, 2017 to 2021

    7.5. Absolute $ Opportunity Analysis By End Use, 2022 to 2032

8. Global Market Analysis 2017 to 2021 and Forecast 2022 to 2032, By Region

    8.1. Introduction

    8.2. Historical Market Size Value (US$ Million) & Volume (Units) Analysis By Region, 2017 to 2021

    8.3. Current Market Size Value (US$ Million) & Volume (Units) Analysis and Forecast By Region, 2022 to 2032

        8.3.1. North America

        8.3.2. Latin America

        8.3.3. Europe

        8.3.4. Asia Pacific

        8.3.5. Middle East and Africa(MEA)

    8.4. Market Attractiveness Analysis By Region

9. North America Market Analysis 2017 to 2021 and Forecast 2022 to 2032, By Country

    9.1. Historical Market Size Value (US$ Million) & Volume (Units) Trend Analysis By Market Taxonomy, 2017 to 2021

    9.2. Market Size Value (US$ Million) & Volume (Units) Forecast By Market Taxonomy, 2022 to 2032

        9.2.1. By Country

            9.2.1.1. USA

            9.2.1.2. Canada

        9.2.2. By Platform Type

        9.2.3. By Application

        9.2.4. By End Use

    9.3. Market Attractiveness Analysis

        9.3.1. By Country

        9.3.2. By Platform Type

        9.3.3. By Application

        9.3.4. By End Use

    9.4. Key Takeaways

10. Latin America Market Analysis 2017 to 2021 and Forecast 2022 to 2032, By Country

    10.1. Historical Market Size Value (US$ Million) & Volume (Units) Trend Analysis By Market Taxonomy, 2017 to 2021

    10.2. Market Size Value (US$ Million) & Volume (Units) Forecast By Market Taxonomy, 2022 to 2032

        10.2.1. By Country

            10.2.1.1. Brazil

            10.2.1.2. Mexico

            10.2.1.3. Rest of Latin America

        10.2.2. By Platform Type

        10.2.3. By Application

        10.2.4. By End Use

    10.3. Market Attractiveness Analysis

        10.3.1. By Country

        10.3.2. By Platform Type

        10.3.3. By Application

        10.3.4. By End Use

    10.4. Key Takeaways

11. Europe Market Analysis 2017 to 2021 and Forecast 2022 to 2032, By Country

    11.1. Historical Market Size Value (US$ Million) & Volume (Units) Trend Analysis By Market Taxonomy, 2017 to 2021

    11.2. Market Size Value (US$ Million) & Volume (Units) Forecast By Market Taxonomy, 2022 to 2032

        11.2.1. By Country

            11.2.1.1. Germany

            11.2.1.2. United Kingdom

            11.2.1.3. France

            11.2.1.4. Spain

            11.2.1.5. Italy

            11.2.1.6. Rest of Europe

        11.2.2. By Platform Type

        11.2.3. By Application

        11.2.4. By End Use

    11.3. Market Attractiveness Analysis

        11.3.1. By Country

        11.3.2. By Platform Type

        11.3.3. By Application

        11.3.4. By End Use

    11.4. Key Takeaways

12. Asia Pacific Market Analysis 2017 to 2021 and Forecast 2022 to 2032, By Country

    12.1. Historical Market Size Value (US$ Million) & Volume (Units) Trend Analysis By Market Taxonomy, 2017 to 2021

    12.2. Market Size Value (US$ Million) & Volume (Units) Forecast By Market Taxonomy, 2022 to 2032

        12.2.1. By Country

            12.2.1.1. China

            12.2.1.2. Japan

            12.2.1.3. South Korea

            12.2.1.4. Singapore

            12.2.1.5. Thailand

            12.2.1.6. Indonesia

            12.2.1.7. Australia

            12.2.1.8. New Zealand

            12.2.1.9. Rest of Asia Pacific

        12.2.2. By Platform Type

        12.2.3. By Application

        12.2.4. By End Use

    12.3. Market Attractiveness Analysis

        12.3.1. By Country

        12.3.2. By Platform Type

        12.3.3. By Application

        12.3.4. By End Use

    12.4. Key Takeaways

13. MEA Market Analysis 2017 to 2021 and Forecast 2022 to 2032, By Country

    13.1. Historical Market Size Value (US$ Million) & Volume (Units) Trend Analysis By Market Taxonomy, 2017 to 2021

    13.2. Market Size Value (US$ Million) & Volume (Units) Forecast By Market Taxonomy, 2022 to 2032

        13.2.1. By Country

            13.2.1.1. GCC Countries

            13.2.1.2. South Africa

            13.2.1.3. Israel

            13.2.1.4. Rest of Middle East and Africa(MEA)

        13.2.2. By Platform Type

        13.2.3. By Application

        13.2.4. By End Use

    13.3. Market Attractiveness Analysis

        13.3.1. By Country

        13.3.2. By Platform Type

        13.3.3. By Application

        13.3.4. By End Use

    13.4. Key Takeaways

14. Key Countries Market Analysis

    14.1. USA

        14.1.1. Pricing Analysis

        14.1.2. Market Share Analysis, 2021

            14.1.2.1. By Platform Type

            14.1.2.2. By Application

            14.1.2.3. By End Use

    14.2. Canada

        14.2.1. Pricing Analysis

        14.2.2. Market Share Analysis, 2021

            14.2.2.1. By Platform Type

            14.2.2.2. By Application

            14.2.2.3. By End Use

    14.3. Brazil

        14.3.1. Pricing Analysis

        14.3.2. Market Share Analysis, 2021

            14.3.2.1. By Platform Type

            14.3.2.2. By Application

            14.3.2.3. By End Use

    14.4. Mexico

        14.4.1. Pricing Analysis

        14.4.2. Market Share Analysis, 2021

            14.4.2.1. By Platform Type

            14.4.2.2. By Application

            14.4.2.3. By End Use

    14.5. Germany

        14.5.1. Pricing Analysis

        14.5.2. Market Share Analysis, 2021

            14.5.2.1. By Platform Type

            14.5.2.2. By Application

            14.5.2.3. By End Use

    14.6. United Kingdom

        14.6.1. Pricing Analysis

        14.6.2. Market Share Analysis, 2021

            14.6.2.1. By Platform Type

            14.6.2.2. By Application

            14.6.2.3. By End Use

    14.7. France

        14.7.1. Pricing Analysis

        14.7.2. Market Share Analysis, 2021

            14.7.2.1. By Platform Type

            14.7.2.2. By Application

            14.7.2.3. By End Use

    14.8. Spain

        14.8.1. Pricing Analysis

        14.8.2. Market Share Analysis, 2021

            14.8.2.1. By Platform Type

            14.8.2.2. By Application

            14.8.2.3. By End Use

    14.9. Italy

        14.9.1. Pricing Analysis

        14.9.2. Market Share Analysis, 2021

            14.9.2.1. By Platform Type

            14.9.2.2. By Application

            14.9.2.3. By End Use

    14.10. China

        14.10.1. Pricing Analysis

        14.10.2. Market Share Analysis, 2021

            14.10.2.1. By Platform Type

            14.10.2.2. By Application

            14.10.2.3. By End Use

    14.11. Japan

        14.11.1. Pricing Analysis

        14.11.2. Market Share Analysis, 2021

            14.11.2.1. By Platform Type

            14.11.2.2. By Application

            14.11.2.3. By End Use

    14.12. South Korea

        14.12.1. Pricing Analysis

        14.12.2. Market Share Analysis, 2021

            14.12.2.1. By Platform Type

            14.12.2.2. By Application

            14.12.2.3. By End Use

    14.13. Singapore

        14.13.1. Pricing Analysis

        14.13.2. Market Share Analysis, 2021

            14.13.2.1. By Platform Type

            14.13.2.2. By Application

            14.13.2.3. By End Use

    14.14. Thailand

        14.14.1. Pricing Analysis

        14.14.2. Market Share Analysis, 2021

            14.14.2.1. By Platform Type

            14.14.2.2. By Application

            14.14.2.3. By End Use

    14.15. Indonesia

        14.15.1. Pricing Analysis

        14.15.2. Market Share Analysis, 2021

            14.15.2.1. By Platform Type

            14.15.2.2. By Application

            14.15.2.3. By End Use

    14.16. Australia

        14.16.1. Pricing Analysis

        14.16.2. Market Share Analysis, 2021

            14.16.2.1. By Platform Type

            14.16.2.2. By Application

            14.16.2.3. By End Use

    14.17. New Zealand

        14.17.1. Pricing Analysis

        14.17.2. Market Share Analysis, 2021

            14.17.2.1. By Platform Type

            14.17.2.2. By Application

            14.17.2.3. By End Use

    14.18. GCC Countries

        14.18.1. Pricing Analysis

        14.18.2. Market Share Analysis, 2021

            14.18.2.1. By Platform Type

            14.18.2.2. By Application

            14.18.2.3. By End Use

    14.19. South Africa

        14.19.1. Pricing Analysis

        14.19.2. Market Share Analysis, 2021

            14.19.2.1. By Platform Type

            14.19.2.2. By Application

            14.19.2.3. By End Use

    14.20. Israel

        14.20.1. Pricing Analysis

        14.20.2. Market Share Analysis, 2021

            14.20.2.1. By Platform Type

            14.20.2.2. By Application

            14.20.2.3. By End Use

15. Market Structure Analysis

    15.1. Competition Dashboard

    15.2. Competition Benchmarking

    15.3. Market Share Analysis of Top Players

        15.3.1. By Regional

        15.3.2. By Platform Type

        15.3.3. By Application

        15.3.4. By End Use

16. Competition Analysis

    16.1. Competition Deep Dive

        16.1.1. Percepto

            16.1.1.1. Overview

            16.1.1.2. Product Portfolio

            16.1.1.3. Profitability by Market Segments

            16.1.1.4. Sales Footprint

            16.1.1.5. Strategy Overview

                16.1.1.5.1. Marketing Strategy

                16.1.1.5.2. Product Strategy

                16.1.1.5.3. Channel Strategy

        16.1.2. Aerobotics Ltd.

            16.1.2.1. Overview

            16.1.2.2. Product Portfolio

            16.1.2.3. Profitability by Market Segments

            16.1.2.4. Sales Footprint

            16.1.2.5. Strategy Overview

                16.1.2.5.1. Marketing Strategy

                16.1.2.5.2. Product Strategy

                16.1.2.5.3. Channel Strategy

        16.1.3. Unmanned Systems Technology

            16.1.3.1. Overview

            16.1.3.2. Product Portfolio

            16.1.3.3. Profitability by Market Segments

            16.1.3.4. Sales Footprint

            16.1.3.5. Strategy Overview

                16.1.3.5.1. Marketing Strategy

                16.1.3.5.2. Product Strategy

                16.1.3.5.3. Channel Strategy

        16.1.4. Skylark Drones

            16.1.4.1. Overview

            16.1.4.2. Product Portfolio

            16.1.4.3. Profitability by Market Segments

            16.1.4.4. Sales Footprint

            16.1.4.5. Strategy Overview

                16.1.4.5.1. Marketing Strategy

                16.1.4.5.2. Product Strategy

                16.1.4.5.3. Channel Strategy

        16.1.5. ModalAI

            16.1.5.1. Overview

            16.1.5.2. Product Portfolio

            16.1.5.3. Profitability by Market Segments

            16.1.5.4. Sales Footprint

            16.1.5.5. Strategy Overview

                16.1.5.5.1. Marketing Strategy

                16.1.5.5.2. Product Strategy

                16.1.5.5.3. Channel Strategy

        16.1.6. H3 Dynamics

            16.1.6.1. Overview

            16.1.6.2. Product Portfolio

            16.1.6.3. Profitability by Market Segments

            16.1.6.4. Sales Footprint

            16.1.6.5. Strategy Overview

                16.1.6.5.1. Marketing Strategy

                16.1.6.5.2. Product Strategy

                16.1.6.5.3. Channel Strategy

        16.1.7. Azur Drones

            16.1.7.1. Overview

            16.1.7.2. Product Portfolio

            16.1.7.3. Profitability by Market Segments

            16.1.7.4. Sales Footprint

            16.1.7.5. Strategy Overview

                16.1.7.5.1. Marketing Strategy

                16.1.7.5.2. Product Strategy

                16.1.7.5.3. Channel Strategy

        16.1.8. Plymouth Rock Technologies

            16.1.8.1. Overview

            16.1.8.2. Product Portfolio

            16.1.8.3. Profitability by Market Segments

            16.1.8.4. Sales Footprint

            16.1.8.5. Strategy Overview

                16.1.8.5.1. Marketing Strategy

                16.1.8.5.2. Product Strategy

                16.1.8.5.3. Channel Strategy

        16.1.9. Action Drone Inc.

            16.1.9.1. Overview

            16.1.9.2. Product Portfolio

            16.1.9.3. Profitability by Market Segments

            16.1.9.4. Sales Footprint

            16.1.9.5. Strategy Overview

                16.1.9.5.1. Marketing Strategy

                16.1.9.5.2. Product Strategy

                16.1.9.5.3. Channel Strategy

        16.1.10. Advanced Aircraft Company

            16.1.10.1. Overview

            16.1.10.2. Product Portfolio

            16.1.10.3. Profitability by Market Segments

            16.1.10.4. Sales Footprint

            16.1.10.5. Strategy Overview

                16.1.10.5.1. Marketing Strategy

                16.1.10.5.2. Product Strategy

                16.1.10.5.3. Channel Strategy

17. Assumptions & Acronyms Used

18. Research Methodology

Don't pay for what you don't need

Customize your report by selecting specific countries or regions and save 30%!

List of Tables

Table 1: Global Market Value (US$ Million) Forecast by Region, 2017 to 2032

Table 2: Global Market Volume (Units) Forecast by Region, 2017 to 2032

Table 3: Global Market Value (US$ Million) Forecast by Platform Type, 2017 to 2032

Table 4: Global Market Volume (Units) Forecast by Platform Type, 2017 to 2032

Table 5: Global Market Value (US$ Million) Forecast by Application, 2017 to 2032

Table 6: Global Market Volume (Units) Forecast by Application, 2017 to 2032

Table 7: Global Market Value (US$ Million) Forecast by End Use, 2017 to 2032

Table 8: Global Market Volume (Units) Forecast by End Use, 2017 to 2032

Table 9: North America Market Value (US$ Million) Forecast by Country, 2017 to 2032

Table 10: North America Market Volume (Units) Forecast by Country, 2017 to 2032

Table 11: North America Market Value (US$ Million) Forecast by Platform Type, 2017 to 2032

Table 12: North America Market Volume (Units) Forecast by Platform Type, 2017 to 2032

Table 13: North America Market Value (US$ Million) Forecast by Application, 2017 to 2032

Table 14: North America Market Volume (Units) Forecast by Application, 2017 to 2032

Table 15: North America Market Value (US$ Million) Forecast by End Use, 2017 to 2032

Table 16: North America Market Volume (Units) Forecast by End Use, 2017 to 2032

Table 17: Latin America Market Value (US$ Million) Forecast by Country, 2017 to 2032

Table 18: Latin America Market Volume (Units) Forecast by Country, 2017 to 2032

Table 19: Latin America Market Value (US$ Million) Forecast by Platform Type, 2017 to 2032

Table 20: Latin America Market Volume (Units) Forecast by Platform Type, 2017 to 2032

Table 21: Latin America Market Value (US$ Million) Forecast by Application, 2017 to 2032

Table 22: Latin America Market Volume (Units) Forecast by Application, 2017 to 2032

Table 23: Latin America Market Value (US$ Million) Forecast by End Use, 2017 to 2032

Table 24: Latin America Market Volume (Units) Forecast by End Use, 2017 to 2032

Table 25: Europe Market Value (US$ Million) Forecast by Country, 2017 to 2032

Table 26: Europe Market Volume (Units) Forecast by Country, 2017 to 2032

Table 27: Europe Market Value (US$ Million) Forecast by Platform Type, 2017 to 2032

Table 28: Europe Market Volume (Units) Forecast by Platform Type, 2017 to 2032

Table 29: Europe Market Value (US$ Million) Forecast by Application, 2017 to 2032

Table 30: Europe Market Volume (Units) Forecast by Application, 2017 to 2032

Table 31: Europe Market Value (US$ Million) Forecast by End Use, 2017 to 2032

Table 32: Europe Market Volume (Units) Forecast by End Use, 2017 to 2032

Table 33: Asia Pacific Market Value (US$ Million) Forecast by Country, 2017 to 2032

Table 34: Asia Pacific Market Volume (Units) Forecast by Country, 2017 to 2032

Table 35: Asia Pacific Market Value (US$ Million) Forecast by Platform Type, 2017 to 2032

Table 36: Asia Pacific Market Volume (Units) Forecast by Platform Type, 2017 to 2032

Table 37: Asia Pacific Market Value (US$ Million) Forecast by Application, 2017 to 2032

Table 38: Asia Pacific Market Volume (Units) Forecast by Application, 2017 to 2032

Table 39: Asia Pacific Market Value (US$ Million) Forecast by End Use, 2017 to 2032

Table 40: Asia Pacific Market Volume (Units) Forecast by End Use, 2017 to 2032

Table 41: MEA Market Value (US$ Million) Forecast by Country, 2017 to 2032

Table 42: MEA Market Volume (Units) Forecast by Country, 2017 to 2032

Table 43: MEA Market Value (US$ Million) Forecast by Platform Type, 2017 to 2032

Table 44: MEA Market Volume (Units) Forecast by Platform Type, 2017 to 2032

Table 45: MEA Market Value (US$ Million) Forecast by Application, 2017 to 2032

Table 46: MEA Market Volume (Units) Forecast by Application, 2017 to 2032

Table 47: MEA Market Value (US$ Million) Forecast by End Use, 2017 to 2032

Table 48: MEA Market Volume (Units) Forecast by End Use, 2017 to 2032
Sudip Saha
Sudip Saha

Principal Consultant

Talk to Analyst

Find your sweet spots for generating winning opportunities in this market.

List of Charts

Figure 1: Global Market Value (US$ Million) by Platform Type, 2022 to 2032

Figure 2: Global Market Value (US$ Million) by Application, 2022 to 2032

Figure 3: Global Market Value (US$ Million) by End Use, 2022 to 2032

Figure 4: Global Market Value (US$ Million) by Region, 2022 to 2032

Figure 5: Global Market Value (US$ Million) Analysis by Region, 2017 to 2032

Figure 6: Global Market Volume (Units) Analysis by Region, 2017 to 2032

Figure 7: Global Market Value Share (%) and BPS Analysis by Region, 2022 to 2032

Figure 8: Global Market Y-o-Y Growth (%) Projections by Region, 2022 to 2032

Figure 9: Global Market Value (US$ Million) Analysis by Platform Type, 2017 to 2032

Figure 10: Global Market Volume (Units) Analysis by Platform Type, 2017 to 2032

Figure 11: Global Market Value Share (%) and BPS Analysis by Platform Type, 2022 to 2032

Figure 12: Global Market Y-o-Y Growth (%) Projections by Platform Type, 2022 to 2032

Figure 13: Global Market Value (US$ Million) Analysis by Application, 2017 to 2032

Figure 14: Global Market Volume (Units) Analysis by Application, 2017 to 2032

Figure 15: Global Market Value Share (%) and BPS Analysis by Application, 2022 to 2032

Figure 16: Global Market Y-o-Y Growth (%) Projections by Application, 2022 to 2032

Figure 17: Global Market Value (US$ Million) Analysis by End Use, 2017 to 2032

Figure 18: Global Market Volume (Units) Analysis by End Use, 2017 to 2032

Figure 19: Global Market Value Share (%) and BPS Analysis by End Use, 2022 to 2032

Figure 20: Global Market Y-o-Y Growth (%) Projections by End Use, 2022 to 2032

Figure 21: Global Market Attractiveness by Platform Type, 2022 to 2032

Figure 22: Global Market Attractiveness by Application, 2022 to 2032

Figure 23: Global Market Attractiveness by End Use, 2022 to 2032

Figure 24: Global Market Attractiveness by Region, 2022 to 2032

Figure 25: North America Market Value (US$ Million) by Platform Type, 2022 to 2032

Figure 26: North America Market Value (US$ Million) by Application, 2022 to 2032

Figure 27: North America Market Value (US$ Million) by End Use, 2022 to 2032

Figure 28: North America Market Value (US$ Million) by Country, 2022 to 2032

Figure 29: North America Market Value (US$ Million) Analysis by Country, 2017 to 2032

Figure 30: North America Market Volume (Units) Analysis by Country, 2017 to 2032

Figure 31: North America Market Value Share (%) and BPS Analysis by Country, 2022 to 2032

Figure 32: North America Market Y-o-Y Growth (%) Projections by Country, 2022 to 2032

Figure 33: North America Market Value (US$ Million) Analysis by Platform Type, 2017 to 2032

Figure 34: North America Market Volume (Units) Analysis by Platform Type, 2017 to 2032

Figure 35: North America Market Value Share (%) and BPS Analysis by Platform Type, 2022 to 2032

Figure 36: North America Market Y-o-Y Growth (%) Projections by Platform Type, 2022 to 2032

Figure 37: North America Market Value (US$ Million) Analysis by Application, 2017 to 2032

Figure 38: North America Market Volume (Units) Analysis by Application, 2017 to 2032

Figure 39: North America Market Value Share (%) and BPS Analysis by Application, 2022 to 2032

Figure 40: North America Market Y-o-Y Growth (%) Projections by Application, 2022 to 2032

Figure 41: North America Market Value (US$ Million) Analysis by End Use, 2017 to 2032

Figure 42: North America Market Volume (Units) Analysis by End Use, 2017 to 2032

Figure 43: North America Market Value Share (%) and BPS Analysis by End Use, 2022 to 2032

Figure 44: North America Market Y-o-Y Growth (%) Projections by End Use, 2022 to 2032

Figure 45: North America Market Attractiveness by Platform Type, 2022 to 2032

Figure 46: North America Market Attractiveness by Application, 2022 to 2032

Figure 47: North America Market Attractiveness by End Use, 2022 to 2032

Figure 48: North America Market Attractiveness by Country, 2022 to 2032

Figure 49: Latin America Market Value (US$ Million) by Platform Type, 2022 to 2032

Figure 50: Latin America Market Value (US$ Million) by Application, 2022 to 2032

Figure 51: Latin America Market Value (US$ Million) by End Use, 2022 to 2032

Figure 52: Latin America Market Value (US$ Million) by Country, 2022 to 2032

Figure 53: Latin America Market Value (US$ Million) Analysis by Country, 2017 to 2032

Figure 54: Latin America Market Volume (Units) Analysis by Country, 2017 to 2032

Figure 55: Latin America Market Value Share (%) and BPS Analysis by Country, 2022 to 2032

Figure 56: Latin America Market Y-o-Y Growth (%) Projections by Country, 2022 to 2032

Figure 57: Latin America Market Value (US$ Million) Analysis by Platform Type, 2017 to 2032

Figure 58: Latin America Market Volume (Units) Analysis by Platform Type, 2017 to 2032

Figure 59: Latin America Market Value Share (%) and BPS Analysis by Platform Type, 2022 to 2032

Figure 60: Latin America Market Y-o-Y Growth (%) Projections by Platform Type, 2022 to 2032

Figure 61: Latin America Market Value (US$ Million) Analysis by Application, 2017 to 2032

Figure 62: Latin America Market Volume (Units) Analysis by Application, 2017 to 2032

Figure 63: Latin America Market Value Share (%) and BPS Analysis by Application, 2022 to 2032

Figure 64: Latin America Market Y-o-Y Growth (%) Projections by Application, 2022 to 2032

Figure 65: Latin America Market Value (US$ Million) Analysis by End Use, 2017 to 2032

Figure 66: Latin America Market Volume (Units) Analysis by End Use, 2017 to 2032

Figure 67: Latin America Market Value Share (%) and BPS Analysis by End Use, 2022 to 2032

Figure 68: Latin America Market Y-o-Y Growth (%) Projections by End Use, 2022 to 2032

Figure 69: Latin America Market Attractiveness by Platform Type, 2022 to 2032

Figure 70: Latin America Market Attractiveness by Application, 2022 to 2032

Figure 71: Latin America Market Attractiveness by End Use, 2022 to 2032

Figure 72: Latin America Market Attractiveness by Country, 2022 to 2032

Figure 73: Europe Market Value (US$ Million) by Platform Type, 2022 to 2032

Figure 74: Europe Market Value (US$ Million) by Application, 2022 to 2032

Figure 75: Europe Market Value (US$ Million) by End Use, 2022 to 2032

Figure 76: Europe Market Value (US$ Million) by Country, 2022 to 2032

Figure 77: Europe Market Value (US$ Million) Analysis by Country, 2017 to 2032

Figure 78: Europe Market Volume (Units) Analysis by Country, 2017 to 2032

Figure 79: Europe Market Value Share (%) and BPS Analysis by Country, 2022 to 2032

Figure 80: Europe Market Y-o-Y Growth (%) Projections by Country, 2022 to 2032

Figure 81: Europe Market Value (US$ Million) Analysis by Platform Type, 2017 to 2032

Figure 82: Europe Market Volume (Units) Analysis by Platform Type, 2017 to 2032

Figure 83: Europe Market Value Share (%) and BPS Analysis by Platform Type, 2022 to 2032

Figure 84: Europe Market Y-o-Y Growth (%) Projections by Platform Type, 2022 to 2032

Figure 85: Europe Market Value (US$ Million) Analysis by Application, 2017 to 2032

Figure 86: Europe Market Volume (Units) Analysis by Application, 2017 to 2032

Figure 87: Europe Market Value Share (%) and BPS Analysis by Application, 2022 to 2032

Figure 88: Europe Market Y-o-Y Growth (%) Projections by Application, 2022 to 2032

Figure 89: Europe Market Value (US$ Million) Analysis by End Use, 2017 to 2032

Figure 90: Europe Market Volume (Units) Analysis by End Use, 2017 to 2032

Figure 91: Europe Market Value Share (%) and BPS Analysis by End Use, 2022 to 2032

Figure 92: Europe Market Y-o-Y Growth (%) Projections by End Use, 2022 to 2032

Figure 93: Europe Market Attractiveness by Platform Type, 2022 to 2032

Figure 94: Europe Market Attractiveness by Application, 2022 to 2032

Figure 95: Europe Market Attractiveness by End Use, 2022 to 2032

Figure 96: Europe Market Attractiveness by Country, 2022 to 2032

Figure 97: Asia Pacific Market Value (US$ Million) by Platform Type, 2022 to 2032

Figure 98: Asia Pacific Market Value (US$ Million) by Application, 2022 to 2032

Figure 99: Asia Pacific Market Value (US$ Million) by End Use, 2022 to 2032

Figure 100: Asia Pacific Market Value (US$ Million) by Country, 2022 to 2032

Figure 101: Asia Pacific Market Value (US$ Million) Analysis by Country, 2017 to 2032

Figure 102: Asia Pacific Market Volume (Units) Analysis by Country, 2017 to 2032

Figure 103: Asia Pacific Market Value Share (%) and BPS Analysis by Country, 2022 to 2032

Figure 104: Asia Pacific Market Y-o-Y Growth (%) Projections by Country, 2022 to 2032

Figure 105: Asia Pacific Market Value (US$ Million) Analysis by Platform Type, 2017 to 2032

Figure 106: Asia Pacific Market Volume (Units) Analysis by Platform Type, 2017 to 2032

Figure 107: Asia Pacific Market Value Share (%) and BPS Analysis by Platform Type, 2022 to 2032

Figure 108: Asia Pacific Market Y-o-Y Growth (%) Projections by Platform Type, 2022 to 2032

Figure 109: Asia Pacific Market Value (US$ Million) Analysis by Application, 2017 to 2032

Figure 110: Asia Pacific Market Volume (Units) Analysis by Application, 2017 to 2032

Figure 111: Asia Pacific Market Value Share (%) and BPS Analysis by Application, 2022 to 2032

Figure 112: Asia Pacific Market Y-o-Y Growth (%) Projections by Application, 2022 to 2032

Figure 113: Asia Pacific Market Value (US$ Million) Analysis by End Use, 2017 to 2032

Figure 114: Asia Pacific Market Volume (Units) Analysis by End Use, 2017 to 2032

Figure 115: Asia Pacific Market Value Share (%) and BPS Analysis by End Use, 2022 to 2032

Figure 116: Asia Pacific Market Y-o-Y Growth (%) Projections by End Use, 2022 to 2032

Figure 117: Asia Pacific Market Attractiveness by Platform Type, 2022 to 2032

Figure 118: Asia Pacific Market Attractiveness by Application, 2022 to 2032

Figure 119: Asia Pacific Market Attractiveness by End Use, 2022 to 2032

Figure 120: Asia Pacific Market Attractiveness by Country, 2022 to 2032

Figure 121: MEA Market Value (US$ Million) by Platform Type, 2022 to 2032

Figure 122: MEA Market Value (US$ Million) by Application, 2022 to 2032

Figure 123: MEA Market Value (US$ Million) by End Use, 2022 to 2032

Figure 124: MEA Market Value (US$ Million) by Country, 2022 to 2032

Figure 125: MEA Market Value (US$ Million) Analysis by Country, 2017 to 2032

Figure 126: MEA Market Volume (Units) Analysis by Country, 2017 to 2032

Figure 127: MEA Market Value Share (%) and BPS Analysis by Country, 2022 to 2032

Figure 128: MEA Market Y-o-Y Growth (%) Projections by Country, 2022 to 2032

Figure 129: MEA Market Value (US$ Million) Analysis by Platform Type, 2017 to 2032

Figure 130: MEA Market Volume (Units) Analysis by Platform Type, 2017 to 2032

Figure 131: MEA Market Value Share (%) and BPS Analysis by Platform Type, 2022 to 2032

Figure 132: MEA Market Y-o-Y Growth (%) Projections by Platform Type, 2022 to 2032

Figure 133: MEA Market Value (US$ Million) Analysis by Application, 2017 to 2032

Figure 134: MEA Market Volume (Units) Analysis by Application, 2017 to 2032

Figure 135: MEA Market Value Share (%) and BPS Analysis by Application, 2022 to 2032

Figure 136: MEA Market Y-o-Y Growth (%) Projections by Application, 2022 to 2032

Figure 137: MEA Market Value (US$ Million) Analysis by End Use, 2017 to 2032

Figure 138: MEA Market Volume (Units) Analysis by End Use, 2017 to 2032

Figure 139: MEA Market Value Share (%) and BPS Analysis by End Use, 2022 to 2032

Figure 140: MEA Market Y-o-Y Growth (%) Projections by End Use, 2022 to 2032

Figure 141: MEA Market Attractiveness by Platform Type, 2022 to 2032

Figure 142: MEA Market Attractiveness by Application, 2022 to 2032

Figure 143: MEA Market Attractiveness by End Use, 2022 to 2032

Figure 144: MEA Market Attractiveness by Country, 2022 to 2032

Recommendations

Technology

Autonomous Parking Market

Published : July 2023

Automotive

Autonomous Vehicles Market

Published : June 2023

Explore Technology Insights

View Reports

Autonomous Drone Platform Market