Methodology

AI-Based Data Observability Software Market Forecast and Outlook (2025-2035)

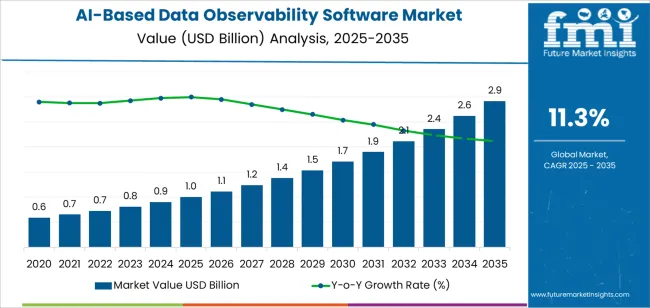
The AI-based data observability software market expands from USD 1.0 billion in 2025 to USD 3.0 billion by 2035 at a CAGR of 11.3%, shaped by regional advances in digital modernization, cloud adoption, and enterprise analytics maturity. Asia Pacific leads global growth, driven by strong adoption in China and India, where expanding data-engineering teams, rapid cloud migration, and AI-enabled analytics ecosystems generate sustained demand for automated observability. China grows at 15.3% as enterprises adopt AI-powered data-reliability tools for large-scale fintech, telecom, and e-commerce datasets. India follows at 14.1%, supported by IT-services integration, cloud-native transformation across BFSI and healthcare, and a fast-maturing digital-operations landscape. Japan and South Korea maintain steady adoption due to precision-driven operational requirements and increased use of AI in industrial and financial systems.

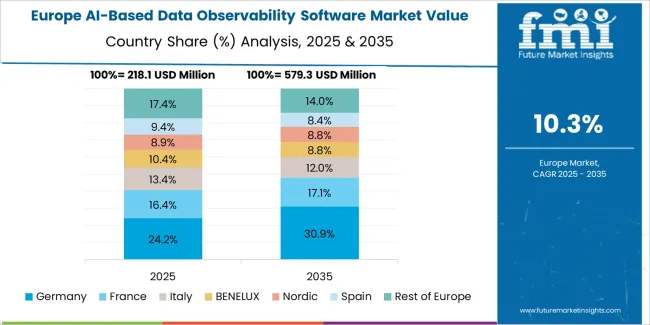
Europe contributes robust growth, led by Germany at 13.0% as enterprises enforce strict data-governance and lineage-traceability mandates aligned with regulatory frameworks. The U.K. and France strengthen adoption through cloud-native modernisation, enhanced compliance structures, and growing use of observability tools in financial services, logistics, and public-sector applications. The region benefits from mature governance ecosystems that prioritize documentation accuracy and automated anomaly detection. North America remains a core market with the United States advancing at 10.7%, supported by mature multi-cloud architectures, strong R&D in AI-driven monitoring, and heavy adoption across healthcare, retail, and high-volume digital services. Brazil anchors Latin America with 11.9% growth as cloud migration accelerates and fintech ecosystems expand. Across all regions, adoption accelerates as enterprises shift to continuous monitoring of distributed data pipelines, embed lineage mapping into governance frameworks, and rely on predictive diagnostics to stabilize analytics, AI, and operational systems.
Quick Stats for AI-Based Data Observability Software Market

  • AI-Based Data Observability Software Market Value (2025): USD 1.0 billion
  • AI-Based Data Observability Software Market Forecast Value (2035): USD 3.0 billion
  • AI-Based Data Observability Software Market Forecast CAGR: 11.3%
  • Leading Type in AI-Based Data Observability Software Market: Cloud Based
  • Key Growth Regions in AI-Based Data Observability Software Market: Asia Pacific, Europe, and North America
  • Top Players in AI-Based Data Observability Software Market: Telmai, Sifflet, Acceldata, Monte Carlo, Arize AI, Logz.io, WhyLabs, iceDQ, Decube, ScienceLogic, New Relic, Informatica, IBM

Ai Based Data Observability Software Market Market Value Analysis

Asia Pacific leads market expansion, supported by digital modernization in China, India, and Southeast Asian economies. Europe and North America maintain strong adoption through established enterprise analytics ecosystems and investment in AI governance frameworks. Key participants include Telmai, Sifflet, Acceldata, Monte Carlo, Arize AI, Logz.io, and WhyLabs, focusing on automated monitoring, pipeline resilience, and integration with cloud-native data platforms.

What is the Growth Forecast for the AI-Based Data Observability Software Market through 2035?

Growth rate volatility analysis indicates a moderate volatility index during the early years, followed by gradual stabilization as observability platforms become embedded in enterprise data operations. Between 2025 and 2028, volatility will remain higher due to rapid adoption cycles, shifting cloud-migration strategies, and variations in AI deployment budgets. Market dynamics during this phase will be influenced by differing enterprise readiness levels and uneven modernization across industries.

From 2029 to 2035, the volatility index is expected to decline as observability tools mature and integration with data pipelines, governance frameworks, and automated quality monitoring becomes standardized. Wider use of anomaly detection, lineage tracking, and predictive diagnostics will support predictable, subscription-based demand. Regulatory pressure for reliable data controls will also reduce fluctuations by making observability a recurring operational requirement rather than a discretionary investment. The long-term volatility profile reflects a technology-driven market transitioning from early expansion driven by modernization projects to a stable phase supported by continuous monitoring needs and structured enterprise data-management practices.

AI-Based Data Observability Software Market Key Takeaways

Metric Value
Market Value (2025) USD 1.0 billion
Market Forecast Value (2035) USD 3.0 billion
Forecast CAGR (2025 to 2035) 11.3%

Why is the AI-Based Data Observability Software Market Growing?

The market for AI-based data observability software is growing as organisations face increasing volumes and complexity of data pipelines, analytics environments and hybrid cloud architectures. Software platforms that apply artificial intelligence to monitor dataflows, detect anomalies, identify root causes and ensure data integrity provide higher visibility and reliability across data operations. Growth is driven by rising demand for real-time insights, the prevalence of advanced analytics and machine learning workflows, and the need to govern data quality in large-scale enterprise systems. Toolsets incorporating ML-based anomaly detection, lineage tracing, automated notification and self-healing capabilities are gaining wide adoption.

Regulatory requirements for data governance, auditability and controls in sectors such as finance, healthcare and retail amplify need for observability solutions. On the supply side, vendors leverage AI-native architectures and cloud-based delivery models to scale globally and accelerate deployment. Constraints include high initial implementation and licence costs, complexity in integrating with legacy data stacks, and a shortage of skilled professionals able to configure and interpret AI-driven observability insights effectively.

Which Product Type and Application Segments Lead the AI-Based Data Observability Software Market?

The AI-based data observability software market is segmented by product type and application. By product type, the market includes cloud-based and on-premises platforms. Based on application, it is categorized into large enterprises and SMEs. Regionally, the market is divided into Asia Pacific, Europe, North America, and other key regions.
By Product Type, the Cloud-Based Segment Accounts for the Largest Market Share

Ai Based Data Observability Software Market Analysis By Product Type

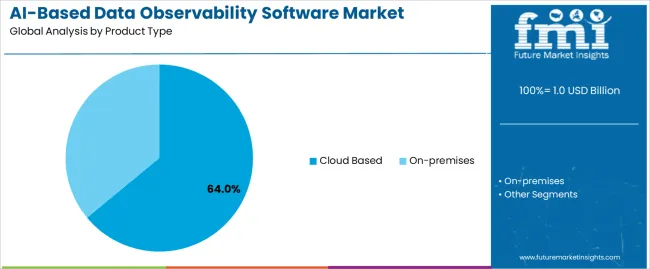
The cloud-based segment holds the leading position in the AI-based data observability software market, representing an estimated 64.0% of total market share in 2025. Cloud deployments support real-time anomaly detection, automated data quality monitoring, and scalable pipeline analysis across distributed data environments. These platforms benefit from elastic computing resources, enabling rapid model updates, continuous data scanning, and integration with modern cloud data warehouses.

Demand is reinforced by organizations transitioning to cloud-native architectures and relying on AI-driven observability to identify schema drift, data degradation, lineage issues, and pipeline failures. The on-premises segment, estimated at 36.0%, remains essential in industries with strict data governance requirements, including finance, healthcare, and public sector operations where data residency and compliance obligations restrict cloud adoption.

Key factors supporting the cloud-based segment include:
  • Scalability suited for complex, high-volume enterprise data ecosystems.
  • Integration with cloud data lakes, warehouses, and ETL/ELT orchestration tools.
  • Lower upfront infrastructure costs and continuous feature deployment.
  • Increased adoption of AI-driven monitoring for real-time data reliability.

By Application, the Large Enterprises Segment Represents the Dominant Market Category

Ai Based Data Observability Software Market Analysis By Application

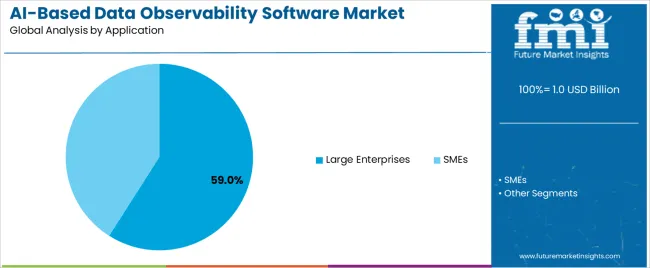
The large enterprises segment accounts for approximately 59.0% of the AI-based data observability software market in 2025. Large organizations manage extensive, diverse data pipelines and require automated monitoring systems to maintain data accuracy, detect anomalies, and ensure reliability across analytics, machine learning models, and operational systems.

Enterprises adopt AI-based observability tools to reduce operational risks associated with data drift, system downtime, and corrupted datasets, particularly in environments with high regulatory oversight and complex data governance structures. The SMEs segment, representing roughly 41.0%, is expanding as smaller organizations adopt cloud-native analytics stacks and rely on automated observability to reduce manual monitoring and engineering overhead.

Primary dynamics driving demand from the large enterprises segment include:

  • Increased reliance on data-driven decision-making and machine learning models.
  • Growing need for automated systems to monitor data quality at scale.
  • Adoption of governance frameworks requiring traceable data lineage and reliability metrics.
  • Expansion of distributed data architectures across multiple business units.

What are the Drivers, Restraints, and Key Trends of the AI-Based Data Observability Software Market?

Rising data complexity, growing reliance on real-time analytics, and increased adoption of automated monitoring are driving market growth.

The AI-Based Data Observability Software Market is expanding as organisations manage larger, more complex data pipelines across cloud, hybrid, and multi-platform environments. Businesses depend on accurate, timely data for analytics, machine learning, and operational decision-making, which increases the need for tools that detect anomalies, lineage issues, and quality degradation without manual oversight. AI-driven observability platforms automate root-cause analysis, pattern detection, and anomaly prediction, reducing downtime and improving data reliability. Growth in digital transformation across finance, e-commerce, telecom, and healthcare strengthens adoption, as these sectors require high-trust data to support compliance, customer experience, and mission-critical workloads.

High implementation cost, integration challenges, and limited in-house expertise are restraining adoption.

AI-based observability tools often require substantial investment in platform licensing, cloud resources, and configuration, which slows uptake in smaller organisations. Integrating observability systems with diverse data stacks, legacy architectures, and siloed applications can be technically complex and may lengthen deployment timelines. Many enterprises lack in-house data reliability specialists or AI operations expertise, which increases dependence on external support and raises overall cost. Concerns about false positives, over-alerting, or lack of transparency in AI-driven recommendations also limit adoption among businesses seeking predictable, interpretable monitoring systems.

Growth in autonomous data quality management, expansion of cloud-native observability features, and rising adoption in emerging digital economies are shaping market trends.

Vendors are introducing autonomous data-quality modules that continuously learn from pipeline behavior to improve accuracy and reduce manual tuning. Cloud providers are embedding native observability tools within data warehouses, lakehouses, and integration platforms, enabling easier deployment for cloud-first organisations. Emerging markets in Asia Pacific, Eastern Europe, and Latin America are adopting AI-based observability as digital-service sectors expand and data governance requirements strengthen. Enhanced focus on lineage visualisation, multi-cloud interoperability, and predictive reliability analytics supports the market’s shift toward fully automated, scalable data observability ecosystems.

Analysis of the AI-Based Data Observability Software Market by Key Country

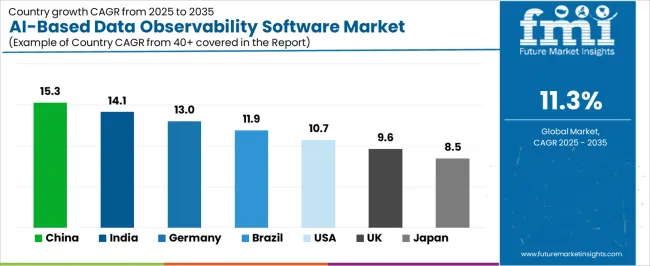
The global AI-based data observability software market is expanding rapidly through 2035, supported by increased data-pipeline complexity, wider adoption of cloud-native architectures, and the rising need for automated monitoring of data quality, lineage, and operational stability. China leads with a 15.3% CAGR, followed by India at 14.1%, reflecting strong digital-infrastructure growth and enterprise adoption of AI-enabled data-monitoring tools. Germany grows at 13.0%, supported by regulated data-governance standards and industrial digitalization. Brazil records 11.9%, driven by cloud modernization and analytics expansion. The United States grows at 10.7%, supported by mature enterprise data ecosystems, while the United Kingdom (9.6%) and Japan (8.5%) sustain stable adoption through structured IT-governance systems and precision-driven data-operations practices.
Ai Based Data Observability Software Market Cagr Analysis By Country

Country CAGR (%)
China 15.3
India 14.1
Germany 13.0
Brazil 11.9
USA 10.7
UK 9.6
Japan 8.5

How is China leading the AI-Based Data Observability Software Market?

China’s market grows at 15.3% CAGR, supported by rapid enterprise digitization, expansion of AI-driven analytics platforms, and increased use of automated monitoring tools in large-scale data environments. Companies adopt AI-based observability software to track data lineage, detect pipeline anomalies, and maintain accuracy across high-volume transactional systems. Cloud providers and domestic software vendors offer integrated observability modules designed for distributed architectures, enabling real-time quality scoring and drift detection. Growth in manufacturing, fintech, telecommunications, and e-commerce strengthens use of AI-based data monitoring to ensure operational continuity. National initiatives promoting digital modernization broaden adoption across state-linked and private enterprises.

Key Market Factors:

  • Widespread adoption across fintech, e-commerce, telecom, and manufacturing.
  • Expansion of AI-driven data-quality scoring and drift-detection tools.
  • Growth in cloud-native architectures requiring real-time observability.
  • Increased enterprise investment in large-scale data-governance systems.

How is India advancing the AI-Based Data Observability Software Market?

India’s market grows at 14.1% CAGR, supported by expanding data-engineering activity, growth in IT services, and rising demand for automated data-quality safeguards within cloud and hybrid environments. Enterprises adopt AI-based observability platforms to detect anomalies, monitor schema changes, and maintain pipeline consistency across large transactional datasets. IT-services firms integrate observability solutions into digital-transformation projects for BFSI, healthcare, and e-commerce clients. Domestic cloud adoption accelerates use of AI-enabled data-monitoring tools among SMEs and digital-native companies. Increased focus on governance, auditability, and operational reliability strengthens platform adoption across emerging business hubs.

Market Development Factors:
  • High adoption among IT-services providers and cloud-native enterprises.
  • Increased use of anomaly detection and schema-change monitoring.
  • Rising demand from BFSI, healthcare, and e-commerce.
  • Broader cloud adoption supporting observability deployment at scale.

How is Germany advancing the AI-Based Data Observability Software Market?

Ai Based Data Observability Software Market Europe Country Market Share Analysis, 2025 & 2035

Germany’s market grows at 13.0% CAGR, supported by strict data-governance requirements, industrial digitalization, and strong enterprise use of automated monitoring tools. Manufacturers, financial institutions, and logistics firms integrate observability software to ensure high-quality operational data across regulated environments. Providers develop platforms emphasizing traceability, drift detection, and automated lineage mapping aligned with European compliance standards. Growth in Industry 4.0 programs increases the volume of sensor-driven datasets requiring continuous monitoring. German enterprises prioritize reliability and documentation accuracy, encouraging widespread use of AI-based observability solutions in production environments.

Key Market Characteristics:

  • Strong alignment with European data-compliance and governance requirements.
  • High adoption in manufacturing, finance, and logistics.
  • Use of lineage mapping, drift detection, and quality auditing tools.
  • Increased need for monitoring sensor-driven industrial data flows.

How is Brazil developing the AI-Based Data Observability Software Market?

Brazil’s market grows at 11.9% CAGR, driven by cloud migration, expansion of digital-service platforms, and increased need for reliable data pipelines across e-commerce, finance, and telecom sectors. Companies use observability tools to monitor data transformations, identify operational inconsistencies, and maintain accuracy across integrated analytics environments. Fintech growth strengthens demand for continuous data-health monitoring to support compliance-driven operations. Domestic enterprises adopt observability modules bundled within cloud services, enabling standardized quality assessments with minimal configuration. Broader digitalization across public and private sectors increases platform deployment.

Market Development Factors:
  • Rising demand from fintech, telecom, and digital-services ecosystems.
  • Increased use of data-transformation monitoring and anomaly detection.
  • Growth in cloud-migrated workloads requiring automated observability.
  • Expansion of enterprise analytics boosting adoption of AI-enabled monitoring.

How is the United States progressing in the AI-Based Data Observability Software Market?

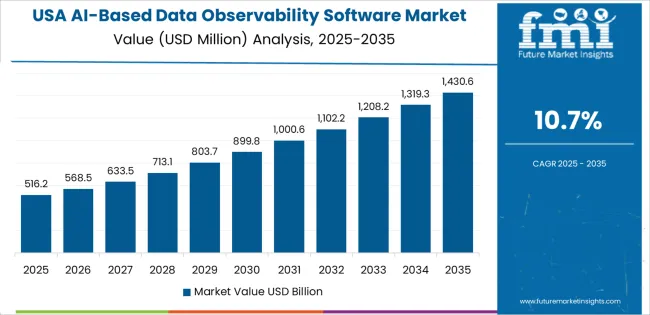
Ai Based Data Observability Software Market Country Value Analysis

The United States grows at 10.7% CAGR, supported by mature enterprise data ecosystems, growth in real-time analytics platforms, and strong R&D activity in AI-enabled monitoring. Large corporations deploy observability tools to manage complex data pipelines across hybrid and multi-cloud environments. Software providers focus on automated anomaly detection, lineage reconstruction, and data-reliability scoring. Increased adoption of AI-assisted decision systems strengthens the need for continuous data-quality oversight. Growth in high-volume sectors such as healthcare, retail, and digital services accelerates platform usage across distributed data environments.

Key Market Factors:

  • Broad adoption across enterprises managing complex, multi-cloud pipelines.
  • Strong product development in AI-enabled detection and lineage tools.
  • High demand from real-time analytics and data-science operations.
  • Growth in regulated industries requiring auditable data quality controls.

How is the United Kingdom developing the AI-Based Data Observability Software Market?

The United Kingdom’s market grows at 9.6% CAGR, supported by strong financial-services activity, expansion of cloud-native platforms, and increased focus on data quality within regulated environments. Companies adopt observability software to maintain reliable data pipelines for reporting, analytics, and automated operations. Platforms offer compliance-aligned monitoring tools, including drift alerts, lineage tracking, and quality scoring. Growth in professional services, digital-first enterprises, and public-sector modernization initiatives supports use of standardized observability frameworks. Integration with governance platforms reinforces enterprise adoption.

Market Development Factors:
  • High usage in finance, professional services, and government IT.
  • Increased demand for compliance-aligned observability tools.
  • Growth in cloud-native transformation supporting platform integration.
  • Rising emphasis on traceability and automated data-quality audits.

How is Japan maintaining the AI-Based Data Observability Software Market?

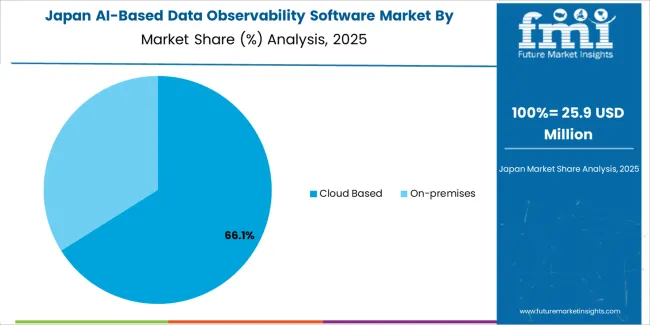
Ai Based Data Observability Software Market Japan Market Share Analysis By Product Type

Japan’s market grows at 8.5% CAGR, supported by precision-driven data-operations requirements, modernization of enterprise systems, and rising adoption of automated monitoring across manufacturing, financial services, and technology sectors. Organizations deploy observability software to track pipeline reliability, monitor schema stability, and detect deviations affecting analytical output. Domestic enterprises value documentation accuracy and high reliability, reinforcing demand for AI-enabled anomaly detection and lineage mapping. Increased integration of cloud services and IoT-driven workflows supports broader adoption in industrial contexts.

Key Market Characteristics:
  • Strong demand in manufacturing, finance, and technology enterprises.
  • Adoption of AI-based anomaly detection and lineage reconstruction tools.
  • Increased need for stable, auditable data pipelines across regulated sectors.
  • Growth in IoT and cloud-supported workflows driving continuous monitoring.

What is the competitive landscape of the AI-Based Data Observability Software Market?

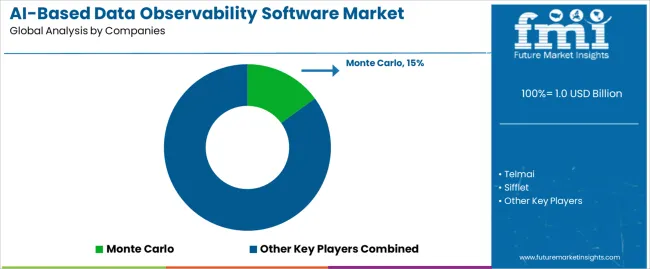
Ai Based Data Observability Software Market Analysis By Company

The AI-based data observability software market is moderately consolidated, with about twenty providers supplying monitoring and quality assurance tools for modern data pipelines. Monte Carlo leads the market with an estimated 15.0% global share, supported by its structured approach to data incident detection, coverage across warehouse and lake environments, and adoption among technology-driven enterprises. Its position is reinforced by automated lineage, anomaly detection, and integration with major cloud platforms.

Acceldata, Sifflet, Telmai, and Arize AI follow as key competitors, offering AI-assisted monitoring for data quality, reliability, and model performance. Their competitive strengths include metric-based alerting, pipeline-wide visibility, and compatibility with distributed processing systems. WhyLabs and Logz.io hold mid-tier positions, focusing on scalable monitoring for ML workflows and log-based anomaly identification. iceDQ, Decube, and Soda.io contribute to quality verification through rule-based and machine-learning-supported validation frameworks designed for operational teams.

Large enterprise vendors such as Informatica, IBM, Cisco, New Relic, Datadog, Splunk, Dynatrace, and ScienceLogic expand market reach by integrating observability modules into existing AIOps, application monitoring, and data management platforms. Their advantage lies in established customer bases and broad monitoring ecosystems. Emerging participants including Greptime address specialized use cases in real-time data infrastructure.

Competition in this market centers on anomaly detection accuracy, lineage completeness, integration depth, and operational scalability. Growth is driven by increased reliance on distributed data systems, rising volumes of structured and unstructured data, and the need for continuous reliability monitoring across analytics, governance, and machine learning environments.

Key Players in the AI-Based Data Observability Software Market

  • Telmai
  • Sifflet
  • Acceldata
  • Monte Carlo
  • Arize AI
  • Logz.io
  • WhyLabs
  • iceDQ
  • Decube
  • ScienceLogic
  • New Relic
  • Informatica
  • IBM
  • Soda.io
  • Lightup
  • Cisco
  • Datadog
  • Dynatrace
  • Splunk
  • Greptime

Scope of the Report

Items Values
Quantitative Units USD billion
Product Type Cloud Based, On-premises
Application Large Enterprises, SMEs
Regions Covered Asia Pacific, Europe, North America, Latin America, Middle East & Africa
Countries Covered India, China, USA, Germany, South Korea, Japan, Italy, and 40+ countries
Key Companies Profiled Telmai, Sifflet, Acceldata, Monte Carlo, Arize AI, Logz.io, WhyLabs, iceDQ, Decube, ScienceLogic, New Relic, Informatica, IBM, Soda.io, Lightup, Cisco, Datadog, Dynatrace, Splunk, Greptime
Additional Attributes Dollar sales by product type and application categories; regional adoption trends across Asia Pacific, Europe, and North America; competitive landscape of AI-driven data quality, monitoring, and observability platforms; advancements in anomaly detection, lineage tracing, and automated data reliability tooling; integration with cloud data warehouses, data lakes, real-time analytics systems, and enterprise AI pipelines.

AI-Based Data Observability Software Market by Segment

Product Type:

  • Cloud Based
  • On-premises

Application:

  • Large Enterprises
  • SMEs

Region:

  • Asia Pacific
    • China
    • Japan
    • South Korea
    • India
    • Australia & New Zealand
    • ASEAN
    • Rest of Asia Pacific
  • Europe
    • Germany
    • United Kingdom
    • France
    • Italy
    • Spain
    • Nordic
    • BENELUX
    • Rest of Europe
  • North America
    • United States
    • Canada
    • Mexico
  • Latin America
    • Brazil
    • Chile
    • Rest of Latin America
  • Middle East & Africa
    • Kingdom of Saudi Arabia
    • Other GCC Countries
    • Turkey
    • South Africa
    • Other African Union
    • Rest of Middle East & Africa

Frequently Asked Questions

How big is the ai-based data observability software market in 2025?

The global ai-based data observability software market is estimated to be valued at USD 1.0 billion in 2025.

What will be the size of ai-based data observability software market in 2035?

The market size for the ai-based data observability software market is projected to reach USD 2.9 billion by 2035.

How much will be the ai-based data observability software market growth between 2025 and 2035?

The ai-based data observability software market is expected to grow at a 11.3% CAGR between 2025 and 2035.

What are the key product types in the ai-based data observability software market?

The key product types in ai-based data observability software market are cloud based and on-premises.

Which application segment to contribute significant share in the ai-based data observability software market in 2025?

In terms of application, large enterprises segment to command 59.0% share in the ai-based data observability software market in 2025.

Table of Content

  1. Executive Summary
    • Global Market Outlook
    • Demand to side Trends
    • Supply to side Trends
    • Technology Roadmap Analysis
    • Analysis and Recommendations
  2. Market Overview
    • Market Coverage / Taxonomy
    • Market Definition / Scope / Limitations
  3. Market Background
    • Market Dynamics
      • Drivers
      • Restraints
      • Opportunity
      • Trends
    • Scenario Forecast
      • Demand in Optimistic Scenario
      • Demand in Likely Scenario
      • Demand in Conservative Scenario
    • Opportunity Map Analysis
    • Product Life Cycle Analysis
    • Supply Chain Analysis
    • Investment Feasibility Matrix
    • Value Chain Analysis
    • PESTLE and Porter’s Analysis
    • Regulatory Landscape
    • Regional Parent Market Outlook
    • Production and Consumption Statistics
    • Import and Export Statistics
  4. Global Market Analysis 2020 to 2024 and Forecast, 2025 to 2035
    • Historical Market Size Value (USD Million) Analysis, 2020 to 2024
    • Current and Future Market Size Value (USD Million) Projections, 2025 to 2035
      • Y to o to Y Growth Trend Analysis
      • Absolute $ Opportunity Analysis
  5. Global Market Pricing Analysis 2020 to 2024 and Forecast 2025 to 2035
  6. Global Market Analysis 2020 to 2024 and Forecast 2025 to 2035, By Product Type
    • Introduction / Key Findings
    • Historical Market Size Value (USD Million) Analysis By Product Type , 2020 to 2024
    • Current and Future Market Size Value (USD Million) Analysis and Forecast By Product Type , 2025 to 2035
      • Cloud Based
      • On-premises
    • Y to o to Y Growth Trend Analysis By Product Type , 2020 to 2024
    • Absolute $ Opportunity Analysis By Product Type , 2025 to 2035
  7. Global Market Analysis 2020 to 2024 and Forecast 2025 to 2035, By Application
    • Introduction / Key Findings
    • Historical Market Size Value (USD Million) Analysis By Application, 2020 to 2024
    • Current and Future Market Size Value (USD Million) Analysis and Forecast By Application, 2025 to 2035
      • Large Enterprises
      • SMEs
    • Y to o to Y Growth Trend Analysis By Application, 2020 to 2024
    • Absolute $ Opportunity Analysis By Application, 2025 to 2035
  8. Global Market Analysis 2020 to 2024 and Forecast 2025 to 2035, By Region
    • Introduction
    • Historical Market Size Value (USD Million) Analysis By Region, 2020 to 2024
    • Current Market Size Value (USD Million) Analysis and Forecast By Region, 2025 to 2035
      • North America
      • Latin America
      • Western Europe
      • Eastern Europe
      • East Asia
      • South Asia and Pacific
      • Middle East & Africa
    • Market Attractiveness Analysis By Region
  9. North America Market Analysis 2020 to 2024 and Forecast 2025 to 2035, By Country
    • Historical Market Size Value (USD Million) Trend Analysis By Market Taxonomy, 2020 to 2024
    • Market Size Value (USD Million) Forecast By Market Taxonomy, 2025 to 2035
      • By Country
        • USA
        • Canada
        • Mexico
      • By Product Type
      • By Application
    • Market Attractiveness Analysis
      • By Country
      • By Product Type
      • By Application
    • Key Takeaways
  10. Latin America Market Analysis 2020 to 2024 and Forecast 2025 to 2035, By Country
    • Historical Market Size Value (USD Million) Trend Analysis By Market Taxonomy, 2020 to 2024
    • Market Size Value (USD Million) Forecast By Market Taxonomy, 2025 to 2035
      • By Country
        • Brazil
        • Chile
        • Rest of Latin America
      • By Product Type
      • By Application
    • Market Attractiveness Analysis
      • By Country
      • By Product Type
      • By Application
    • Key Takeaways
  11. Western Europe Market Analysis 2020 to 2024 and Forecast 2025 to 2035, By Country
    • Historical Market Size Value (USD Million) Trend Analysis By Market Taxonomy, 2020 to 2024
    • Market Size Value (USD Million) Forecast By Market Taxonomy, 2025 to 2035
      • By Country
        • Germany
        • UK
        • Italy
        • Spain
        • France
        • Nordic
        • BENELUX
        • Rest of Western Europe
      • By Product Type
      • By Application
    • Market Attractiveness Analysis
      • By Country
      • By Product Type
      • By Application
    • Key Takeaways
  12. Eastern Europe Market Analysis 2020 to 2024 and Forecast 2025 to 2035, By Country
    • Historical Market Size Value (USD Million) Trend Analysis By Market Taxonomy, 2020 to 2024
    • Market Size Value (USD Million) Forecast By Market Taxonomy, 2025 to 2035
      • By Country
        • Russia
        • Poland
        • Hungary
        • Balkan & Baltic
        • Rest of Eastern Europe
      • By Product Type
      • By Application
    • Market Attractiveness Analysis
      • By Country
      • By Product Type
      • By Application
    • Key Takeaways
  13. East Asia Market Analysis 2020 to 2024 and Forecast 2025 to 2035, By Country
    • Historical Market Size Value (USD Million) Trend Analysis By Market Taxonomy, 2020 to 2024
    • Market Size Value (USD Million) Forecast By Market Taxonomy, 2025 to 2035
      • By Country
        • China
        • Japan
        • South Korea
      • By Product Type
      • By Application
    • Market Attractiveness Analysis
      • By Country
      • By Product Type
      • By Application
    • Key Takeaways
  14. South Asia and Pacific Market Analysis 2020 to 2024 and Forecast 2025 to 2035, By Country
    • Historical Market Size Value (USD Million) Trend Analysis By Market Taxonomy, 2020 to 2024
    • Market Size Value (USD Million) Forecast By Market Taxonomy, 2025 to 2035
      • By Country
        • India
        • ASEAN
        • Australia & New Zealand
        • Rest of South Asia and Pacific
      • By Product Type
      • By Application
    • Market Attractiveness Analysis
      • By Country
      • By Product Type
      • By Application
    • Key Takeaways
  15. Middle East & Africa Market Analysis 2020 to 2024 and Forecast 2025 to 2035, By Country
    • Historical Market Size Value (USD Million) Trend Analysis By Market Taxonomy, 2020 to 2024
    • Market Size Value (USD Million) Forecast By Market Taxonomy, 2025 to 2035
      • By Country
        • Kingdom of Saudi Arabia
        • Other GCC Countries
        • Turkiye
        • South Africa
        • Other African Union
        • Rest of Middle East & Africa
      • By Product Type
      • By Application
    • Market Attractiveness Analysis
      • By Country
      • By Product Type
      • By Application
    • Key Takeaways
  16. Key Countries Market Analysis
    • USA
      • Pricing Analysis
      • Market Share Analysis, 2024
        • By Product Type
        • By Application
    • Canada
      • Pricing Analysis
      • Market Share Analysis, 2024
        • By Product Type
        • By Application
    • Mexico
      • Pricing Analysis
      • Market Share Analysis, 2024
        • By Product Type
        • By Application
    • Brazil
      • Pricing Analysis
      • Market Share Analysis, 2024
        • By Product Type
        • By Application
    • Chile
      • Pricing Analysis
      • Market Share Analysis, 2024
        • By Product Type
        • By Application
    • Germany
      • Pricing Analysis
      • Market Share Analysis, 2024
        • By Product Type
        • By Application
    • UK
      • Pricing Analysis
      • Market Share Analysis, 2024
        • By Product Type
        • By Application
    • Italy
      • Pricing Analysis
      • Market Share Analysis, 2024
        • By Product Type
        • By Application
    • Spain
      • Pricing Analysis
      • Market Share Analysis, 2024
        • By Product Type
        • By Application
    • France
      • Pricing Analysis
      • Market Share Analysis, 2024
        • By Product Type
        • By Application
    • India
      • Pricing Analysis
      • Market Share Analysis, 2024
        • By Product Type
        • By Application
    • ASEAN
      • Pricing Analysis
      • Market Share Analysis, 2024
        • By Product Type
        • By Application
    • Australia & New Zealand
      • Pricing Analysis
      • Market Share Analysis, 2024
        • By Product Type
        • By Application
    • China
      • Pricing Analysis
      • Market Share Analysis, 2024
        • By Product Type
        • By Application
    • Japan
      • Pricing Analysis
      • Market Share Analysis, 2024
        • By Product Type
        • By Application
    • South Korea
      • Pricing Analysis
      • Market Share Analysis, 2024
        • By Product Type
        • By Application
    • Russia
      • Pricing Analysis
      • Market Share Analysis, 2024
        • By Product Type
        • By Application
    • Poland
      • Pricing Analysis
      • Market Share Analysis, 2024
        • By Product Type
        • By Application
    • Hungary
      • Pricing Analysis
      • Market Share Analysis, 2024
        • By Product Type
        • By Application
    • Kingdom of Saudi Arabia
      • Pricing Analysis
      • Market Share Analysis, 2024
        • By Product Type
        • By Application
    • Turkiye
      • Pricing Analysis
      • Market Share Analysis, 2024
        • By Product Type
        • By Application
    • South Africa
      • Pricing Analysis
      • Market Share Analysis, 2024
        • By Product Type
        • By Application
  17. Market Structure Analysis
    • Competition Dashboard
    • Competition Benchmarking
    • Market Share Analysis of Top Players
      • By Regional
      • By Product Type
      • By Application
  18. Competition Analysis
    • Competition Deep Dive
      • Monte Carlo
        • Overview
        • Product Portfolio
        • Profitability by Market Segments (Product/Age /Sales Channel/Region)
        • Sales Footprint
        • Strategy Overview
          • Marketing Strategy
          • Product Strategy
          • Channel Strategy
      • Telmai
      • Sifflet
      • Acceldata
      • Arize AI
      • Logz.io
      • WhyLabs
      • iceDQ
      • Decube
      • ScienceLogic
      • New Relic
      • Informatica
      • IBM
      • Soda.io
      • Lightup
      • Cisco
      • Datadog
      • Dynatrace
      • Splunk
      • Greptime
  19. Assumptions & Acronyms Used
  20. Research Methodology

List of Tables

  • Table 1: Global Market Value (USD Million) Forecast by Region, 2020 to 2035
  • Table 2: Global Market Value (USD Million) Forecast by Product Type , 2020 to 2035
  • Table 3: Global Market Value (USD Million) Forecast by Application, 2020 to 2035
  • Table 4: North America Market Value (USD Million) Forecast by Country, 2020 to 2035
  • Table 5: North America Market Value (USD Million) Forecast by Product Type , 2020 to 2035
  • Table 6: North America Market Value (USD Million) Forecast by Application, 2020 to 2035
  • Table 7: Latin America Market Value (USD Million) Forecast by Country, 2020 to 2035
  • Table 8: Latin America Market Value (USD Million) Forecast by Product Type , 2020 to 2035
  • Table 9: Latin America Market Value (USD Million) Forecast by Application, 2020 to 2035
  • Table 10: Western Europe Market Value (USD Million) Forecast by Country, 2020 to 2035
  • Table 11: Western Europe Market Value (USD Million) Forecast by Product Type , 2020 to 2035
  • Table 12: Western Europe Market Value (USD Million) Forecast by Application, 2020 to 2035
  • Table 13: Eastern Europe Market Value (USD Million) Forecast by Country, 2020 to 2035
  • Table 14: Eastern Europe Market Value (USD Million) Forecast by Product Type , 2020 to 2035
  • Table 15: Eastern Europe Market Value (USD Million) Forecast by Application, 2020 to 2035
  • Table 16: East Asia Market Value (USD Million) Forecast by Country, 2020 to 2035
  • Table 17: East Asia Market Value (USD Million) Forecast by Product Type , 2020 to 2035
  • Table 18: East Asia Market Value (USD Million) Forecast by Application, 2020 to 2035
  • Table 19: South Asia and Pacific Market Value (USD Million) Forecast by Country, 2020 to 2035
  • Table 20: South Asia and Pacific Market Value (USD Million) Forecast by Product Type , 2020 to 2035
  • Table 21: South Asia and Pacific Market Value (USD Million) Forecast by Application, 2020 to 2035
  • Table 22: Middle East & Africa Market Value (USD Million) Forecast by Country, 2020 to 2035
  • Table 23: Middle East & Africa Market Value (USD Million) Forecast by Product Type , 2020 to 2035
  • Table 24: Middle East & Africa Market Value (USD Million) Forecast by Application, 2020 to 2035

List of Figures

  • Figure 1: Global Market Pricing Analysis
  • Figure 2: Global Market Value (USD Million) Forecast 2020-2035
  • Figure 3: Global Market Value Share and BPS Analysis by Product Type , 2025 and 2035
  • Figure 4: Global Market Y-o-Y Growth Comparison by Product Type , 2025-2035
  • Figure 5: Global Market Attractiveness Analysis by Product Type
  • Figure 6: Global Market Value Share and BPS Analysis by Application, 2025 and 2035
  • Figure 7: Global Market Y-o-Y Growth Comparison by Application, 2025-2035
  • Figure 8: Global Market Attractiveness Analysis by Application
  • Figure 9: Global Market Value (USD Million) Share and BPS Analysis by Region, 2025 and 2035
  • Figure 10: Global Market Y-o-Y Growth Comparison by Region, 2025-2035
  • Figure 11: Global Market Attractiveness Analysis by Region
  • Figure 12: North America Market Incremental Dollar Opportunity, 2025-2035
  • Figure 13: Latin America Market Incremental Dollar Opportunity, 2025-2035
  • Figure 14: Western Europe Market Incremental Dollar Opportunity, 2025-2035
  • Figure 15: Eastern Europe Market Incremental Dollar Opportunity, 2025-2035
  • Figure 16: East Asia Market Incremental Dollar Opportunity, 2025-2035
  • Figure 17: South Asia and Pacific Market Incremental Dollar Opportunity, 2025-2035
  • Figure 18: Middle East & Africa Market Incremental Dollar Opportunity, 2025-2035
  • Figure 19: North America Market Value Share and BPS Analysis by Country, 2025 and 2035
  • Figure 20: North America Market Value Share and BPS Analysis by Product Type , 2025 and 2035
  • Figure 21: North America Market Y-o-Y Growth Comparison by Product Type , 2025-2035
  • Figure 22: North America Market Attractiveness Analysis by Product Type
  • Figure 23: North America Market Value Share and BPS Analysis by Application, 2025 and 2035
  • Figure 24: North America Market Y-o-Y Growth Comparison by Application, 2025-2035
  • Figure 25: North America Market Attractiveness Analysis by Application
  • Figure 26: Latin America Market Value Share and BPS Analysis by Country, 2025 and 2035
  • Figure 27: Latin America Market Value Share and BPS Analysis by Product Type , 2025 and 2035
  • Figure 28: Latin America Market Y-o-Y Growth Comparison by Product Type , 2025-2035
  • Figure 29: Latin America Market Attractiveness Analysis by Product Type
  • Figure 30: Latin America Market Value Share and BPS Analysis by Application, 2025 and 2035
  • Figure 31: Latin America Market Y-o-Y Growth Comparison by Application, 2025-2035
  • Figure 32: Latin America Market Attractiveness Analysis by Application
  • Figure 33: Western Europe Market Value Share and BPS Analysis by Country, 2025 and 2035
  • Figure 34: Western Europe Market Value Share and BPS Analysis by Product Type , 2025 and 2035
  • Figure 35: Western Europe Market Y-o-Y Growth Comparison by Product Type , 2025-2035
  • Figure 36: Western Europe Market Attractiveness Analysis by Product Type
  • Figure 37: Western Europe Market Value Share and BPS Analysis by Application, 2025 and 2035
  • Figure 38: Western Europe Market Y-o-Y Growth Comparison by Application, 2025-2035
  • Figure 39: Western Europe Market Attractiveness Analysis by Application
  • Figure 40: Eastern Europe Market Value Share and BPS Analysis by Country, 2025 and 2035
  • Figure 41: Eastern Europe Market Value Share and BPS Analysis by Product Type , 2025 and 2035
  • Figure 42: Eastern Europe Market Y-o-Y Growth Comparison by Product Type , 2025-2035
  • Figure 43: Eastern Europe Market Attractiveness Analysis by Product Type
  • Figure 44: Eastern Europe Market Value Share and BPS Analysis by Application, 2025 and 2035
  • Figure 45: Eastern Europe Market Y-o-Y Growth Comparison by Application, 2025-2035
  • Figure 46: Eastern Europe Market Attractiveness Analysis by Application
  • Figure 47: East Asia Market Value Share and BPS Analysis by Country, 2025 and 2035
  • Figure 48: East Asia Market Value Share and BPS Analysis by Product Type , 2025 and 2035
  • Figure 49: East Asia Market Y-o-Y Growth Comparison by Product Type , 2025-2035
  • Figure 50: East Asia Market Attractiveness Analysis by Product Type
  • Figure 51: East Asia Market Value Share and BPS Analysis by Application, 2025 and 2035
  • Figure 52: East Asia Market Y-o-Y Growth Comparison by Application, 2025-2035
  • Figure 53: East Asia Market Attractiveness Analysis by Application
  • Figure 54: South Asia and Pacific Market Value Share and BPS Analysis by Country, 2025 and 2035
  • Figure 55: South Asia and Pacific Market Value Share and BPS Analysis by Product Type , 2025 and 2035
  • Figure 56: South Asia and Pacific Market Y-o-Y Growth Comparison by Product Type , 2025-2035
  • Figure 57: South Asia and Pacific Market Attractiveness Analysis by Product Type
  • Figure 58: South Asia and Pacific Market Value Share and BPS Analysis by Application, 2025 and 2035
  • Figure 59: South Asia and Pacific Market Y-o-Y Growth Comparison by Application, 2025-2035
  • Figure 60: South Asia and Pacific Market Attractiveness Analysis by Application
  • Figure 61: Middle East & Africa Market Value Share and BPS Analysis by Country, 2025 and 2035
  • Figure 62: Middle East & Africa Market Value Share and BPS Analysis by Product Type , 2025 and 2035
  • Figure 63: Middle East & Africa Market Y-o-Y Growth Comparison by Product Type , 2025-2035
  • Figure 64: Middle East & Africa Market Attractiveness Analysis by Product Type
  • Figure 65: Middle East & Africa Market Value Share and BPS Analysis by Application, 2025 and 2035
  • Figure 66: Middle East & Africa Market Y-o-Y Growth Comparison by Application, 2025-2035
  • Figure 67: Middle East & Africa Market Attractiveness Analysis by Application
  • Figure 68: Global Market - Tier Structure Analysis
  • Figure 69: Global Market - Company Share Analysis
Dashboard
Dashboard
Dashboard
Dashboard
Dashboard
Dashboard

Our Research Products

Full Research Suite

The "Full Research Suite" delivers actionable market intel, deep dives on markets or technologies, so clients act faster, cut risk, and unlock growth.

Competitor Leaderboard Report

The Leaderboard benchmarks and ranks top vendors, classifying them as Established Leaders, Leading Challengers, or Disruptors & Challengers.

Future Leaders Index

Locates where complements amplify value and substitutes erode it, forecasting net impact by horizon

Market Data & Forecasts

We deliver granular, decision-grade intel: market sizing, 5-year forecasts, pricing, adoption, usage, revenue, and operational KPIs—plus competitor tracking, regulation, and value chains—across 60 countries broadly.

Market Focus Report

Spot the shifts before they hit your P&L. We track inflection points, adoption curves, pricing moves, and ecosystem plays to show where demand is heading, why it is changing, and what to do next across high-growth markets and disruptive tech

Survey Report

Real-time reads of user behavior. We track shifting priorities, perceptions of today’s and next-gen services, and provider experience, then pace how fast tech moves from trial to adoption, blending buyer, consumer, and channel inputs with social signals (#WhySwitch, #UX).

Bespoke Reports

Partner with our analyst team to build a custom report designed around your business priorities. From analysing market trends to assessing competitors or crafting bespoke datasets, we tailor insights to your needs.

Supplier Intelligence

Discovery & Profiling

Capacity & Footprint

Performance & Risk

Compliance & Governance

Commercial Readiness

Who Supplies Whom

Scorecards & Shortlists

Playbooks & Docs

Category Intelligence

Definition & Scope

Demand & Use Cases

Cost Drivers

Market Structure

Supply Chain Map

Trade & Policy

Operating Norms

Deliverables

Buyer Intelligence

Account Basics

Spend & Scope

Procurement Model

Vendor Requirements

Terms & Policies

Entry Strategy

Pain Points & Triggers

Outputs

Pricing Analysis

Benchmarks

Trends

Should-Cost

Indexation

Landed Cost

Commercial Terms

Deliverables

Brand Analysis

Positioning & Value Prop

Share & Presence

Customer Evidence

Go-to-Market

Digital & Reputation

Compliance & Trust

KPIs & Gaps

Outputs

Full Research Suite comprises of:

Market outlook & trends analysis

Market outlook & trends analysis

Interviews & case studies

Interviews & case studies

Strategic recommendations

Strategic recommendations

Vendor profiles & capabilities analysis

Vendor profiles & capabilities analysis

5-year forecasts

5-year forecasts

8 regions and 60+ country-level data splits

8 regions and 60+ country-level data splits

Market segment data splits

Market segment data splits

12 months of continuous data updates

12 months of continuous data updates

DELIVERED AS:

PDF EXCEL ONLINE

Full Research Suite


$5000

$7500

$10000

Buy Report Now
Similar Industry Reports

Similar Industry Reports

Data Security Posture Management (DSPM) Solutions Market

Data Security Posture Management (DSPM) Solutions Market Size and Share Forecast Outlook 2025 to 2035

Data Loss Prevention (DLP) Services Market

Data Loss Prevention (DLP) Services Market Size and Share Forecast Outlook 2025 to 2035

Data Center Market
Data Center Market

Data Center Market Forecast and Outlook 2025 to 2035

DataOps Platform Market

DataOps Platform Market Size and Share Forecast Outlook 2025 to 2035

Datacenter Infrastructure Services Market

Datacenter Infrastructure Services Market Size and Share Forecast Outlook 2025 to 2035

Data Acquisition Hardware Market

Data Acquisition Hardware Market Size and Share Forecast Outlook 2025 to 2035

Data Center Automatic Transfer Switches and Switchgears Market

Data Center Automatic Transfer Switches and Switchgears Market Size and Share Forecast Outlook 2025 to 2035

Data Discovery Market

Data Discovery Market Size and Share Forecast Outlook 2025 to 2035

Data Masking Technology Market

Data Masking Technology Market Size and Share Forecast Outlook 2025 to 2035

Data Centre Rack Server Market

Data Centre Rack Server Market Size and Share Forecast Outlook 2025 to 2035

Data Center Power Management Industry Analysis in Western Europe

Data Center Power Management Industry Analysis in Western Europe Size and Share Forecast Outlook 2025 to 2035

Data Center Power Management Industry Analysis in Korea

Data Center Power Management Industry Analysis in Korea Size and Share Forecast Outlook 2025 to 2035

Data Center Liquid Cooling Market

Data Center Liquid Cooling Market Size and Share Forecast Outlook 2025 to 2035

Data Business in Oil & Gas Market

Data Business in Oil & Gas Market Size and Share Forecast Outlook 2025 to 2035

Data Centre Colocation Market

Data Centre Colocation Market Size and Share Forecast Outlook 2025 to 2035

Data Lake Market
Data Lake Market

Data Lake Market Size and Share Forecast Outlook 2025 to 2035

Data Center RFID Market

Data Center RFID Market Size and Share Forecast Outlook 2025 to 2035

Data Center Accelerator Market

Data Center Accelerator Market Size and Share Forecast Outlook 2025 to 2035

Data Lakehouse Market

Data Lakehouse Market Size and Share Forecast Outlook 2025 to 2035

Data Center Outsourcing Market

Data Center Outsourcing Market Size and Share Forecast Outlook 2025 to 2035

Future Market Insights

AI-Based Data Observability Software Market

Chat With MaRIA

Chat With

MaRIA

Hi There, I am MaRIA, Your Market Research Intelligence Assistant. How may I help you?