Data Center Power Management Industry Analysis in Korea Size and Share Forecast Outlook 2025 to 2035

The Data Center Power Management Industry Analysis in Korea is estimated to be valued at USD 495.2 million in 2025 and is projected to reach USD 904.7 million by 2035, registering a compound annual growth rate (CAGR) of 6.2% over the forecast period.
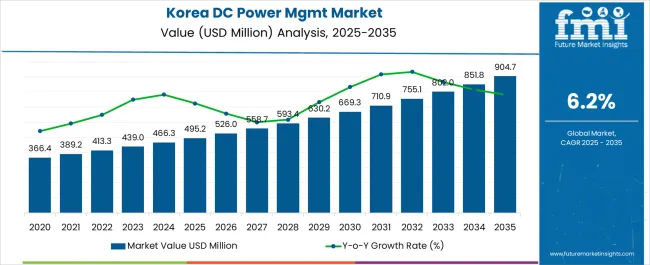
Quick Stats for Data Center Power Management Industry Analysis in Korea

  • Data Center Power Management Industry Analysis in Korea Industry Value (2025): USD 495.2 million
  • Data Center Power Management Industry Analysis in Korea Forecast Value (2035): USD 904.7 million
  • Data Center Power Management Industry Analysis in Korea Forecast CAGR: 6.2%
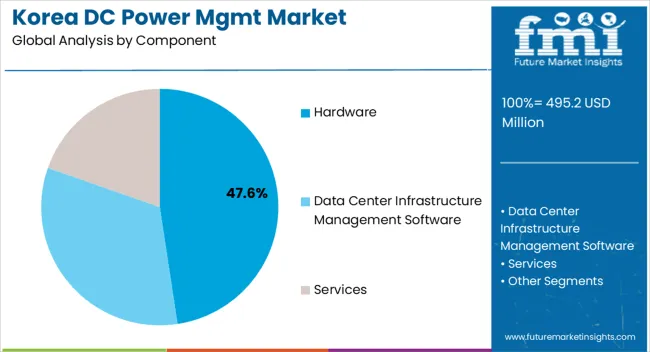
  • Leading Segment in Data Center Power Management Industry Analysis in Korea in 2025: Hardware (47.6%)
  • Key Growth Region in Data Center Power Management Industry Analysis in Korea: North America, Asia-Pacific, Europe
  • Top Key Players in Data Center Power Management Industry Analysis in Korea: Schneider Electric, LG CNS, Samsung C&T, KT Corporation, SK Telecom, Korea Electric Power Corporation, NHN Corporation, Naver Corporation, Kakao Corporation, Celltrion Corporation, Eaton Corporation, Emerson Electric

Korea Dc Power Mgmt Market Market Value Analysis

Metric Value
Data Center Power Management Industry Analysis in Korea Estimated Value in (2025 E) USD 495.2 million
Data Center Power Management Industry Analysis in Korea Forecast Value in (2035 F) USD 904.7 million
Forecast CAGR (2025 to 2035) 6.2%

Rationale for Segmental Growth in the Data Center Power Management Industry in Korea

The data center power management industry in Korea is experiencing steady expansion driven by the rapid adoption of digital services, cloud computing, and big data analytics. Rising electricity demand, coupled with increasing concerns over energy efficiency and sustainability, is shaping the market trajectory.

Operators are investing in advanced power management solutions to optimize energy consumption, reduce operational costs, and ensure regulatory compliance. Current dynamics highlight a surge in demand for scalable infrastructure and reliable backup systems, as downtime risks have become critical considerations for enterprises and service providers.

The future outlook is characterized by continuous investments in green technologies, integration of AI and IoT for predictive maintenance, and growing deployment of renewable energy sources in data center facilities Growth rationale is supported by the need to balance energy efficiency with high availability, technological innovation in power systems, and the expansion of large-scale colocation and hyperscale facilities, all of which are expected to sustain momentum and drive long-term market development in Korea.
Segmental Analysis

Insights into the Component Segment

Korea Dc Power Mgmt Market Analysis By Component

The hardware segment, accounting for 47.60% of the component category, has remained dominant due to its critical role in ensuring uninterrupted energy distribution and operational stability within data centers. Its leadership is supported by demand for advanced uninterruptible power supply systems, power distribution units, and generators that enable high-performance computing environments to function without disruption.

The segment’s strength is reinforced by the rapid expansion of data-intensive applications requiring reliable and scalable infrastructure. Continuous improvements in hardware design, including energy-efficient systems and modular configurations, have elevated adoption.

Compliance with safety and efficiency standards has bolstered trust among operators, while investments in innovative hardware technologies are positioning the segment as an indispensable foundation for effective power management across diverse data center facilities in Korea.
Insights into the Data Center Type Segment

Korea Dc Power Mgmt Market Analysis By Data Center Type

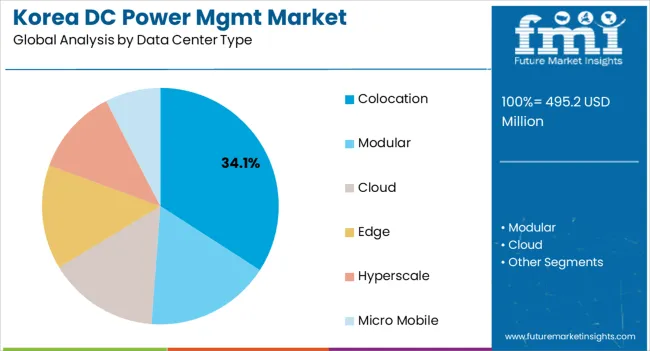
The colocation segment, holding 34.10% of the data center type category, has established itself as the leading model due to increasing demand from enterprises seeking cost-efficient, scalable, and secure facilities. Market strength is driven by the preference of businesses to outsource infrastructure management while maintaining access to advanced technologies and reliable connectivity.

Growth has been reinforced by rising digital transformation initiatives among small and medium enterprises, as well as the expansion of international cloud service providers entering the Korean market. Power management within colocation centers has been enhanced by adopting intelligent monitoring systems and energy optimization strategies.

The segment’s share is expected to remain robust as enterprises prioritize flexibility, regulatory compliance, and cost optimization in their data center strategies.
Insights into the Data Center Tier Segment

Korea Dc Power Mgmt Market Analysis By Data Center Tier

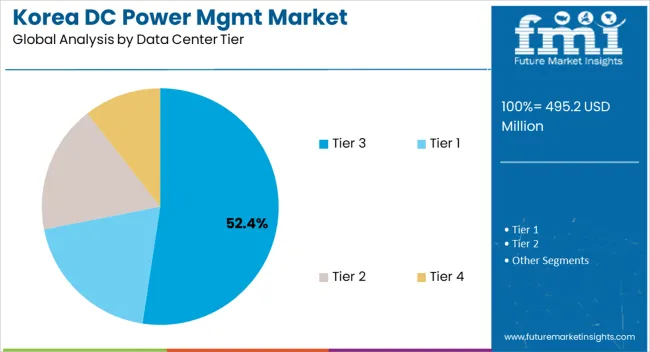
The tier 3 segment, representing 52.40% of the data center tier category, has emerged as the leading standard owing to its balance between high reliability and cost efficiency. Its dominance has been supported by the ability to provide concurrent maintainability, ensuring that facilities can undergo maintenance without downtime.

This tier level has become the preferred choice for enterprises requiring strong operational resilience without the cost intensity of higher-tier facilities. Market adoption has been strengthened by the rapid growth of e-commerce, financial services, and cloud-driven applications in Korea, all of which rely on consistent availability.

Investment in tier 3 facilities has been increasing as operators pursue scalable designs, energy-efficient technologies, and compliance with international standards, ensuring the segment’s continued leadership in the country’s evolving data center power management industry.

Top Data Center Power Management Market Dynamics and Industry Trends

  • The growth of cloud services in Korea, driven by businesses and consumers alike, necessitates robust data center infrastructure and power management solutions to support cloud computing operations.
  • Remote monitoring and management solutions are gaining importance, with the increased significance of remote work and the need for data center administrators to manage infrastructure from afar.
  • The rise of edge computing, driven by the Internet of Things and low-latency applications, is leading to the deployment of smaller data centers at the edge.

Data Center Power Management Industry Analysis by Top Investment Segments

Businesses are Turning to Modular Data Centers for Quick Deployments in Korea

Modular data centers allow organizations to quickly scale their IT infrastructure to meet changing demands. Businesses in Korea, especially those experiencing rapid growth or seasonal variations in data processing needs, can benefit from this scalability.

Data Center Power Management in Korea based on Data Center Type Modular Data Centers
Share in % in 2025 25.1%

In terms of data center type, the modular segment is expected to account for an industry share of 25.1% in 2025. Modular data centers often offer cost savings through economies of scale, efficient resource usage, and reduced construction and operational costs. Given the competitiveness of the business landscape in Korea, cost efficiency is a significant driver.

Modular data centers can be deployed more quickly than traditional data centers, which is crucial in an environment where time to industry is a key factor. Businesses in Korea can rapidly respond to industry demands by using modular solutions.

Tier 4 Data Centers Gain Traction in Korea's Finance and Healthcare Sectors

Tier 4 data centers are designed to ensure near 100% uptime and are suitable for organizations with mission-critical applications. Businesses in Korea that require uninterrupted operations, such as financial institutions, healthcare providers, and government agencies, are drawn to Tier 4 data centers.

Based on data center tier, the Tier 4 segment is expected to account for an industry share of 34.6% in 2025. Certain industries in Korea, such as finance and healthcare, are subject to strict regulatory requirements regarding data security and availability. Tier 4 data centers are often better equipped to meet these compliance standards, driving their adoption.

The heightened level of reliability and redundancy in Tier 4 data centers ensures data security and robust disaster recovery capabilities. Organizations in Korea prioritize data security and the ability to recover quickly from any service interruptions.

Data Center Power Management in Korea based on Data Center Tier Tier 4
Share in % in 2025 34.6%

Analysis of Top Provinces Producing,Formulating,Packaging,Distributing,and Consuming Data Center Power Management

Manufacturing Facilities to Boost the Industry in the South Gyeongsang

South Gyeongsang is renowned for its industrial and economic development, housing a concentration of manufacturing and technology companies. With a growing demand for efficient power management solutions, these industries heavily rely on data centers for their operations.

The region boasts various manufacturing facilities, and many of these industries necessitate data centers for production, quality control, and supply chain management. Power management solutions play a vital role in ensuring the smooth operation of these data centers.

Food Processing Industry in North Jeolla to Enhance the Data Center Power Management Landscape

North Jeolla is known for its agricultural and food processing industries. The sectors increasingly rely on data centers for supply chain management, quality control, and data analysis. Efficient power management is vital for supporting these operations.

North Jeolla hosts educational and research institutions that require data centers for research, data storage, and collaborative projects. These organizations contribute to the demand for advanced power management solutions.

Data Intensive Applications in Jeju to Accelerate the Ecosystem

The data centers in the region may support data-intensive applications related to meteorological data, environmental monitoring, and tourism analytics. Power management is essential for these data centers to maintain reliable operations.

Organizations in Jeju are aiming to pursue digital transformation initiatives to modernize their operations. Data centers play a crucial role in these efforts and require effective power management to ensure reliability and performance.
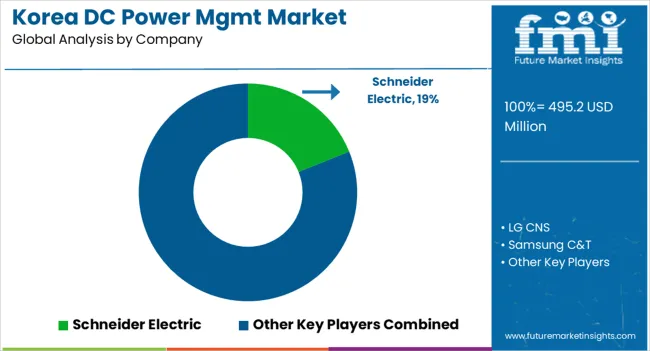
Leading Suppliers of Data Center Power Management

Korea Dc Power Mgmt Market Analysis By Company

The competitive landscape of the data center power management industry in Korea is marked by innovation and a pursuit of sustainable solutions. Power management has become a critical aspect of maintaining operational efficiency and reducing environmental impact as the demand for data center services continues to surge in the digital age.

Several key players and emerging companies are actively contributing to this dynamic landscape, shaping the trajectory of the industry in Korea.

Recent Developments Observed in Data Center Power Management in Korea

  • In 2025, LG CNS announced a partnership with Schneider Electric to develop and deploy intelligent data center power management solutions in Korea. The partnership is expected to focus on developing solutions that can help data center operators improve energy efficiency, reduce costs, and increase reliability.
  • In 2025, Samsung C&T announced plans to invest USD 7.6 billion in the construction of a new data center campus in Jeollanam-do Province, Korea. The data center campus will be powered by renewable energy and will use the latest data center power management technologies.

Key Data Center Power Management Market Players and Concentration

  • LG CNS
  • Samsung C&T
  • KT Corporation
  • SK Telecom
  • Korea Electric Power Corporation
  • NHN Corporation
  • Naver Corporation
  • Kakao Corporation
  • Celltrion Corporation
  • Schneider Electric
  • Eaton Corporation
  • Emerson Electric

Key Shifting Preferences Covered in Data Center Power Management Market Report

Attribute Details
Estimated Industry Size in 2025 USD 495.2 million
Projected Industry Size by 2035 USD 904.7 million
Anticipated CAGR from 2025 to 2035 6.2% CAGR
Historical Analysis of Demand for Data Center Power Management in Korea 2020 to 2025
Demand Forecast for Data Center Power Management in Korea 2025 to 2035
Report Coverage Industry Size, Industry Trends, Analysis of key factors influencing the adoption of Data Center Power Management in Korea, Insights on Global Players and their Industry Strategy in Korea, Ecosystem Analysis of Providers in Korea
Key Provinces Analyzed while Studying Opportunities in Data Center Power Management in Korea South Gyeongsang, North Jeolla, South Jeolla, Jeju
Key Companies Profiled LG CNS; Samsung C&T; KT Corporation; SK Telecom; Korea Electric Power Corporation; NHN Corporation; Naver Corporation; Kakao Corporation; Celltrion Corporation; Schneider Electric; Eaton Corporation; Emerson Electric

Top Segments Studied in the Data Center Power Management Market Report

By Component:

  • Hardware
  • Data Center Infrastructure Management Software
  • Services

By Data Center Type:

  • Modular
  • Colocation
  • Cloud
  • Edge
  • Hyperscale
  • Micro Mobile

By Data Center Tier:

  • Tier 1
  • Tier 2
  • Tier 3
  • Tier 4

By Installation Type:

  • New Installation
  • Retrofit/Upgrade

By End User:

  • Cloud Providers
  • Colocation Providers
  • Enterprise Data Centers
  • Hyperscale Data Centers

By Industry:

  • BFSI
  • Healthcare
  • Manufacturing
  • IT & Telecom
  • Media & Entertainment
  • Retail
  • Government
  • Others

By Province/City:

  • South Gyeongsang
  • North Jeolla
  • South Jeolla
  • Jeju

Frequently Asked Questions

How big is the data center power management industry analysis in Korea in 2025?

The global data center power management industry analysis in Korea is estimated to be valued at USD 495.2 million in 2025.

What will be the size of data center power management industry analysis in Korea in 2035?

The market size for the data center power management industry analysis in Korea is projected to reach USD 904.7 million by 2035.

How much will be the data center power management industry analysis in Korea growth between 2025 and 2035?

The data center power management industry analysis in Korea is expected to grow at a 6.2% CAGR between 2025 and 2035.

What are the key product types in the data center power management industry analysis in korea?

The key product types in data center power management industry analysis in Korea are hardware, data center infrastructure management software and services.

Which data center type segment to contribute significant share in the data center power management industry analysis in Korea in 2025?

In terms of data center type, colocation segment to command 34.1% share in the data center power management industry analysis in Korea in 2025.

Table of Content

  1. Executive Summary
    • Global Market Outlook
    • Demand-side Trends
    • Supply-side Trends
    • Technology Roadmap Analysis
    • Analysis and Recommendations
  2. Market Overview
    • Market Coverage / Taxonomy
    • Market Definition / Scope / Limitations
  3. Market Background
    • Market Dynamics
      • Drivers
      • Restraints
      • Opportunity
      • Trends
    • Scenario Forecast
      • Demand in Optimistic Scenario
      • Demand in Likely Scenario
      • Demand in Conservative Scenario
    • Opportunity Map Analysis
    • Product Life Cycle Analysis
    • Supply Chain Analysis
    • Investment Feasibility Matrix
    • Value Chain Analysis
    • PESTLE and Porter’s Analysis
    • Regulatory Landscape
    • Regional Parent Market Outlook
    • Production and Consumption Statistics
    • Import and Export Statistics
  4. Global Analysis 2020 to 2024 and Forecast, 2025 to 2035
    • Historical Market Size Value (USD Million) Analysis, 2020 to 2024
    • Current and Future Market Size Value (USD Million) Projections, 2025 to 2035
      • Y-o-Y Growth Trend Analysis
      • Absolute $ Opportunity Analysis
  5. Global Pricing Analysis 2020 to 2024 and Forecast 2025 to 2035
  6. Global Analysis 2020 to 2024 and Forecast 2025 to 2035, By Component
    • Introduction / Key Findings
    • Historical Market Size Value (USD Million) Analysis By Component , 2020 to 2024
    • Current and Future Market Size Value (USD Million) Analysis and Forecast By Component , 2025 to 2035
      • Hardware
      • Data Center Infrastructure Management Software
      • Services
    • Y-o-Y Growth Trend Analysis By Component , 2020 to 2024
    • Absolute $ Opportunity Analysis By Component , 2025 to 2035
  7. Global Analysis 2020 to 2024 and Forecast 2025 to 2035, By Data Center Type
    • Introduction / Key Findings
    • Historical Market Size Value (USD Million) Analysis By Data Center Type, 2020 to 2024
    • Current and Future Market Size Value (USD Million) Analysis and Forecast By Data Center Type, 2025 to 2035
      • Colocation
      • Modular
      • Cloud
      • Edge
      • Hyperscale
      • Micro Mobile
    • Y-o-Y Growth Trend Analysis By Data Center Type, 2020 to 2024
    • Absolute $ Opportunity Analysis By Data Center Type, 2025 to 2035
  8. Global Analysis 2020 to 2024 and Forecast 2025 to 2035, By Data Center Tier
    • Introduction / Key Findings
    • Historical Market Size Value (USD Million) Analysis By Data Center Tier, 2020 to 2024
    • Current and Future Market Size Value (USD Million) Analysis and Forecast By Data Center Tier, 2025 to 2035
      • Tier 3
      • Tier 1
      • Tier 2
      • Tier 4
    • Y-o-Y Growth Trend Analysis By Data Center Tier, 2020 to 2024
    • Absolute $ Opportunity Analysis By Data Center Tier, 2025 to 2035
  9. Global Analysis 2020 to 2024 and Forecast 2025 to 2035, By Installation Type
    • Introduction / Key Findings
    • Historical Market Size Value (USD Million) Analysis By Installation Type, 2020 to 2024
    • Current and Future Market Size Value (USD Million) Analysis and Forecast By Installation Type, 2025 to 2035
      • Retrofit/Upgrade
      • New Installation
    • Y-o-Y Growth Trend Analysis By Installation Type, 2020 to 2024
    • Absolute $ Opportunity Analysis By Installation Type, 2025 to 2035
  10. Global Analysis 2020 to 2024 and Forecast 2025 to 2035, By End User
    • Introduction / Key Findings
    • Historical Market Size Value (USD Million) Analysis By End User, 2020 to 2024
    • Current and Future Market Size Value (USD Million) Analysis and Forecast By End User, 2025 to 2035
      • Cloud Providers
      • Colocation Providers
      • Enterprise Data Centers
      • Hyperscale Data Centers
    • Y-o-Y Growth Trend Analysis By End User, 2020 to 2024
    • Absolute $ Opportunity Analysis By End User, 2025 to 2035
  11. Global Analysis 2020 to 2024 and Forecast 2025 to 2035, By Industry
    • Introduction / Key Findings
    • Historical Market Size Value (USD Million) Analysis By Industry, 2020 to 2024
    • Current and Future Market Size Value (USD Million) Analysis and Forecast By Industry, 2025 to 2035
      • IT & Telecom
      • BFSI
      • Healthcare
      • Manufacturing
      • Media & Entertainment
      • Retail
      • Government
      • Others
    • Y-o-Y Growth Trend Analysis By Industry, 2020 to 2024
    • Absolute $ Opportunity Analysis By Industry, 2025 to 2035
  12. Global Analysis 2020 to 2024 and Forecast 2025 to 2035, By Region
    • Introduction
    • Historical Market Size Value (USD Million) Analysis By Region, 2020 to 2024
    • Current Market Size Value (USD Million) Analysis and Forecast By Region, 2025 to 2035
      • North America
      • Latin America
      • Western Europe
      • Eastern Europe
      • East Asia
      • South Asia and Pacific
      • Middle East & Africa
    • Market Attractiveness Analysis By Region
  13. North America Analysis 2020 to 2024 and Forecast 2025 to 2035, By Country
    • Historical Market Size Value (USD Million) Trend Analysis By Market Taxonomy, 2020 to 2024
    • Market Size Value (USD Million) Forecast By Market Taxonomy, 2025 to 2035
      • By Country
        • USA
        • Canada
        • Mexico
      • By Component
      • By Data Center Type
      • By Data Center Tier
      • By Installation Type
      • By End User
      • By Industry
    • Market Attractiveness Analysis
      • By Country
      • By Component
      • By Data Center Type
      • By Data Center Tier
      • By Installation Type
      • By End User
      • By Industry
    • Key Takeaways
  14. Latin America Analysis 2020 to 2024 and Forecast 2025 to 2035, By Country
    • Historical Market Size Value (USD Million) Trend Analysis By Market Taxonomy, 2020 to 2024
    • Market Size Value (USD Million) Forecast By Market Taxonomy, 2025 to 2035
      • By Country
        • Brazil
        • Chile
        • Rest of Latin America
      • By Component
      • By Data Center Type
      • By Data Center Tier
      • By Installation Type
      • By End User
      • By Industry
    • Market Attractiveness Analysis
      • By Country
      • By Component
      • By Data Center Type
      • By Data Center Tier
      • By Installation Type
      • By End User
      • By Industry
    • Key Takeaways
  15. Western Europe Analysis 2020 to 2024 and Forecast 2025 to 2035, By Country
    • Historical Market Size Value (USD Million) Trend Analysis By Market Taxonomy, 2020 to 2024
    • Market Size Value (USD Million) Forecast By Market Taxonomy, 2025 to 2035
      • By Country
        • Germany
        • UK
        • Italy
        • Spain
        • France
        • Nordic
        • BENELUX
        • Rest of Western Europe
      • By Component
      • By Data Center Type
      • By Data Center Tier
      • By Installation Type
      • By End User
      • By Industry
    • Market Attractiveness Analysis
      • By Country
      • By Component
      • By Data Center Type
      • By Data Center Tier
      • By Installation Type
      • By End User
      • By Industry
    • Key Takeaways
  16. Eastern Europe Analysis 2020 to 2024 and Forecast 2025 to 2035, By Country
    • Historical Market Size Value (USD Million) Trend Analysis By Market Taxonomy, 2020 to 2024
    • Market Size Value (USD Million) Forecast By Market Taxonomy, 2025 to 2035
      • By Country
        • Russia
        • Poland
        • Hungary
        • Balkan & Baltic
        • Rest of Eastern Europe
      • By Component
      • By Data Center Type
      • By Data Center Tier
      • By Installation Type
      • By End User
      • By Industry
    • Market Attractiveness Analysis
      • By Country
      • By Component
      • By Data Center Type
      • By Data Center Tier
      • By Installation Type
      • By End User
      • By Industry
    • Key Takeaways
  17. East Asia Analysis 2020 to 2024 and Forecast 2025 to 2035, By Country
    • Historical Market Size Value (USD Million) Trend Analysis By Market Taxonomy, 2020 to 2024
    • Market Size Value (USD Million) Forecast By Market Taxonomy, 2025 to 2035
      • By Country
        • China
        • Japan
        • South Korea
      • By Component
      • By Data Center Type
      • By Data Center Tier
      • By Installation Type
      • By End User
      • By Industry
    • Market Attractiveness Analysis
      • By Country
      • By Component
      • By Data Center Type
      • By Data Center Tier
      • By Installation Type
      • By End User
      • By Industry
    • Key Takeaways
  18. South Asia and Pacific Analysis 2020 to 2024 and Forecast 2025 to 2035, By Country
    • Historical Market Size Value (USD Million) Trend Analysis By Market Taxonomy, 2020 to 2024
    • Market Size Value (USD Million) Forecast By Market Taxonomy, 2025 to 2035
      • By Country
        • India
        • ASEAN
        • Australia & New Zealand
        • Rest of South Asia and Pacific
      • By Component
      • By Data Center Type
      • By Data Center Tier
      • By Installation Type
      • By End User
      • By Industry
    • Market Attractiveness Analysis
      • By Country
      • By Component
      • By Data Center Type
      • By Data Center Tier
      • By Installation Type
      • By End User
      • By Industry
    • Key Takeaways
  19. Middle East & Africa Analysis 2020 to 2024 and Forecast 2025 to 2035, By Country
    • Historical Market Size Value (USD Million) Trend Analysis By Market Taxonomy, 2020 to 2024
    • Market Size Value (USD Million) Forecast By Market Taxonomy, 2025 to 2035
      • By Country
        • Kingdom of Saudi Arabia
        • Other GCC Countries
        • Turkiye
        • South Africa
        • Other African Union
        • Rest of Middle East & Africa
      • By Component
      • By Data Center Type
      • By Data Center Tier
      • By Installation Type
      • By End User
      • By Industry
    • Market Attractiveness Analysis
      • By Country
      • By Component
      • By Data Center Type
      • By Data Center Tier
      • By Installation Type
      • By End User
      • By Industry
    • Key Takeaways
  20. Key Countries Analysis
    • USA
      • Pricing Analysis
      • Market Share Analysis, 2024
        • By Component
        • By Data Center Type
        • By Data Center Tier
        • By Installation Type
        • By End User
        • By Industry
    • Canada
      • Pricing Analysis
      • Market Share Analysis, 2024
        • By Component
        • By Data Center Type
        • By Data Center Tier
        • By Installation Type
        • By End User
        • By Industry
    • Mexico
      • Pricing Analysis
      • Market Share Analysis, 2024
        • By Component
        • By Data Center Type
        • By Data Center Tier
        • By Installation Type
        • By End User
        • By Industry
    • Brazil
      • Pricing Analysis
      • Market Share Analysis, 2024
        • By Component
        • By Data Center Type
        • By Data Center Tier
        • By Installation Type
        • By End User
        • By Industry
    • Chile
      • Pricing Analysis
      • Market Share Analysis, 2024
        • By Component
        • By Data Center Type
        • By Data Center Tier
        • By Installation Type
        • By End User
        • By Industry
    • Germany
      • Pricing Analysis
      • Market Share Analysis, 2024
        • By Component
        • By Data Center Type
        • By Data Center Tier
        • By Installation Type
        • By End User
        • By Industry
    • UK
      • Pricing Analysis
      • Market Share Analysis, 2024
        • By Component
        • By Data Center Type
        • By Data Center Tier
        • By Installation Type
        • By End User
        • By Industry
    • Italy
      • Pricing Analysis
      • Market Share Analysis, 2024
        • By Component
        • By Data Center Type
        • By Data Center Tier
        • By Installation Type
        • By End User
        • By Industry
    • Spain
      • Pricing Analysis
      • Market Share Analysis, 2024
        • By Component
        • By Data Center Type
        • By Data Center Tier
        • By Installation Type
        • By End User
        • By Industry
    • France
      • Pricing Analysis
      • Market Share Analysis, 2024
        • By Component
        • By Data Center Type
        • By Data Center Tier
        • By Installation Type
        • By End User
        • By Industry
    • India
      • Pricing Analysis
      • Market Share Analysis, 2024
        • By Component
        • By Data Center Type
        • By Data Center Tier
        • By Installation Type
        • By End User
        • By Industry
    • ASEAN
      • Pricing Analysis
      • Market Share Analysis, 2024
        • By Component
        • By Data Center Type
        • By Data Center Tier
        • By Installation Type
        • By End User
        • By Industry
    • Australia & New Zealand
      • Pricing Analysis
      • Market Share Analysis, 2024
        • By Component
        • By Data Center Type
        • By Data Center Tier
        • By Installation Type
        • By End User
        • By Industry
    • China
      • Pricing Analysis
      • Market Share Analysis, 2024
        • By Component
        • By Data Center Type
        • By Data Center Tier
        • By Installation Type
        • By End User
        • By Industry
    • Japan
      • Pricing Analysis
      • Market Share Analysis, 2024
        • By Component
        • By Data Center Type
        • By Data Center Tier
        • By Installation Type
        • By End User
        • By Industry
    • South Korea
      • Pricing Analysis
      • Market Share Analysis, 2024
        • By Component
        • By Data Center Type
        • By Data Center Tier
        • By Installation Type
        • By End User
        • By Industry
    • Russia
      • Pricing Analysis
      • Market Share Analysis, 2024
        • By Component
        • By Data Center Type
        • By Data Center Tier
        • By Installation Type
        • By End User
        • By Industry
    • Poland
      • Pricing Analysis
      • Market Share Analysis, 2024
        • By Component
        • By Data Center Type
        • By Data Center Tier
        • By Installation Type
        • By End User
        • By Industry
    • Hungary
      • Pricing Analysis
      • Market Share Analysis, 2024
        • By Component
        • By Data Center Type
        • By Data Center Tier
        • By Installation Type
        • By End User
        • By Industry
    • Kingdom of Saudi Arabia
      • Pricing Analysis
      • Market Share Analysis, 2024
        • By Component
        • By Data Center Type
        • By Data Center Tier
        • By Installation Type
        • By End User
        • By Industry
    • Turkiye
      • Pricing Analysis
      • Market Share Analysis, 2024
        • By Component
        • By Data Center Type
        • By Data Center Tier
        • By Installation Type
        • By End User
        • By Industry
    • South Africa
      • Pricing Analysis
      • Market Share Analysis, 2024
        • By Component
        • By Data Center Type
        • By Data Center Tier
        • By Installation Type
        • By End User
        • By Industry
  21. Market Structure Analysis
    • Competition Dashboard
    • Competition Benchmarking
    • Market Share Analysis of Top Players
      • By Regional
      • By Component
      • By Data Center Type
      • By Data Center Tier
      • By Installation Type
      • By End User
      • By Industry
  22. Competition Analysis
    • Competition Deep Dive
      • Schneider Electric
        • Overview
        • Product Portfolio
        • Profitability by Market Segments (Product/Age /Sales Channel/Region)
        • Sales Footprint
        • Strategy Overview
          • Marketing Strategy
          • Product Strategy
          • Channel Strategy
      • LG CNS
      • Samsung C&T
      • KT Corporation
      • SK Telecom
      • Korea Electric Power Corporation
      • NHN Corporation
      • Naver Corporation
      • Kakao Corporation
      • Celltrion Corporation
      • Eaton Corporation
      • Emerson Electric
  23. Assumptions & Acronyms Used
  24. Research Methodology

List of Tables

  • Table 1: Global Value (USD Million) Forecast by Region, 2020-2035
  • Table 2: Global Value (USD Million) Forecast by Component , 2020-2035
  • Table 3: Global Value (USD Million) Forecast by Data Center Type, 2020-2035
  • Table 4: Global Value (USD Million) Forecast by Data Center Tier, 2020-2035
  • Table 5: Global Value (USD Million) Forecast by Installation Type, 2020-2035
  • Table 6: Global Value (USD Million) Forecast by End User, 2020-2035
  • Table 7: Global Value (USD Million) Forecast by Industry, 2020-2035
  • Table 8: North America Value (USD Million) Forecast by Country, 2020-2035
  • Table 9: North America Value (USD Million) Forecast by Component , 2020-2035
  • Table 10: North America Value (USD Million) Forecast by Data Center Type, 2020-2035
  • Table 11: North America Value (USD Million) Forecast by Data Center Tier, 2020-2035
  • Table 12: North America Value (USD Million) Forecast by Installation Type, 2020-2035
  • Table 13: North America Value (USD Million) Forecast by End User, 2020-2035
  • Table 14: North America Value (USD Million) Forecast by Industry, 2020-2035
  • Table 15: Latin America Value (USD Million) Forecast by Country, 2020-2035
  • Table 16: Latin America Value (USD Million) Forecast by Component , 2020-2035
  • Table 17: Latin America Value (USD Million) Forecast by Data Center Type, 2020-2035
  • Table 18: Latin America Value (USD Million) Forecast by Data Center Tier, 2020-2035
  • Table 19: Latin America Value (USD Million) Forecast by Installation Type, 2020-2035
  • Table 20: Latin America Value (USD Million) Forecast by End User, 2020-2035
  • Table 21: Latin America Value (USD Million) Forecast by Industry, 2020-2035
  • Table 22: Western Europe Value (USD Million) Forecast by Country, 2020-2035
  • Table 23: Western Europe Value (USD Million) Forecast by Component , 2020-2035
  • Table 24: Western Europe Value (USD Million) Forecast by Data Center Type, 2020-2035
  • Table 25: Western Europe Value (USD Million) Forecast by Data Center Tier, 2020-2035
  • Table 26: Western Europe Value (USD Million) Forecast by Installation Type, 2020-2035
  • Table 27: Western Europe Value (USD Million) Forecast by End User, 2020-2035
  • Table 28: Western Europe Value (USD Million) Forecast by Industry, 2020-2035
  • Table 29: Eastern Europe Value (USD Million) Forecast by Country, 2020-2035
  • Table 30: Eastern Europe Value (USD Million) Forecast by Component , 2020-2035
  • Table 31: Eastern Europe Value (USD Million) Forecast by Data Center Type, 2020-2035
  • Table 32: Eastern Europe Value (USD Million) Forecast by Data Center Tier, 2020-2035
  • Table 33: Eastern Europe Value (USD Million) Forecast by Installation Type, 2020-2035
  • Table 34: Eastern Europe Value (USD Million) Forecast by End User, 2020-2035
  • Table 35: Eastern Europe Value (USD Million) Forecast by Industry, 2020-2035
  • Table 36: East Asia Value (USD Million) Forecast by Country, 2020-2035
  • Table 37: East Asia Value (USD Million) Forecast by Component , 2020-2035
  • Table 38: East Asia Value (USD Million) Forecast by Data Center Type, 2020-2035
  • Table 39: East Asia Value (USD Million) Forecast by Data Center Tier, 2020-2035
  • Table 40: East Asia Value (USD Million) Forecast by Installation Type, 2020-2035
  • Table 41: East Asia Value (USD Million) Forecast by End User, 2020-2035
  • Table 42: East Asia Value (USD Million) Forecast by Industry, 2020-2035
  • Table 43: South Asia and Pacific Value (USD Million) Forecast by Country, 2020-2035
  • Table 44: South Asia and Pacific Value (USD Million) Forecast by Component , 2020-2035
  • Table 45: South Asia and Pacific Value (USD Million) Forecast by Data Center Type, 2020-2035
  • Table 46: South Asia and Pacific Value (USD Million) Forecast by Data Center Tier, 2020-2035
  • Table 47: South Asia and Pacific Value (USD Million) Forecast by Installation Type, 2020-2035
  • Table 48: South Asia and Pacific Value (USD Million) Forecast by End User, 2020-2035
  • Table 49: South Asia and Pacific Value (USD Million) Forecast by Industry, 2020-2035
  • Table 50: Middle East & Africa Value (USD Million) Forecast by Country, 2020-2035
  • Table 51: Middle East & Africa Value (USD Million) Forecast by Component , 2020-2035
  • Table 52: Middle East & Africa Value (USD Million) Forecast by Data Center Type, 2020-2035
  • Table 53: Middle East & Africa Value (USD Million) Forecast by Data Center Tier, 2020-2035
  • Table 54: Middle East & Africa Value (USD Million) Forecast by Installation Type, 2020-2035
  • Table 55: Middle East & Africa Value (USD Million) Forecast by End User, 2020-2035
  • Table 56: Middle East & Africa Value (USD Million) Forecast by Industry, 2020-2035

List of Figures

  • Figure 1: Global Pricing Analysis
  • Figure 2: Global Value (USD Million) Forecast 2020-2035
  • Figure 3: Global Value Share and BPS Analysis by Component , 2025 and 2035
  • Figure 4: Global Y-o-Y Growth Comparison by Component , 2025-2035
  • Figure 5: Global Attractiveness Analysis by Component
  • Figure 6: Global Value Share and BPS Analysis by Data Center Type, 2025 and 2035
  • Figure 7: Global Y-o-Y Growth Comparison by Data Center Type, 2025-2035
  • Figure 8: Global Attractiveness Analysis by Data Center Type
  • Figure 9: Global Value Share and BPS Analysis by Data Center Tier, 2025 and 2035
  • Figure 10: Global Y-o-Y Growth Comparison by Data Center Tier, 2025-2035
  • Figure 11: Global Attractiveness Analysis by Data Center Tier
  • Figure 12: Global Value Share and BPS Analysis by Installation Type, 2025 and 2035
  • Figure 13: Global Y-o-Y Growth Comparison by Installation Type, 2025-2035
  • Figure 14: Global Attractiveness Analysis by Installation Type
  • Figure 15: Global Value Share and BPS Analysis by End User, 2025 and 2035
  • Figure 16: Global Y-o-Y Growth Comparison by End User, 2025-2035
  • Figure 17: Global Attractiveness Analysis by End User
  • Figure 18: Global Value Share and BPS Analysis by Industry, 2025 and 2035
  • Figure 19: Global Y-o-Y Growth Comparison by Industry, 2025-2035
  • Figure 20: Global Attractiveness Analysis by Industry
  • Figure 21: Global Value (USD Million) Share and BPS Analysis by Region, 2025 and 2035
  • Figure 22: Global Y-o-Y Growth Comparison by Region, 2025-2035
  • Figure 23: Global Attractiveness Analysis by Region
  • Figure 24: North America Incremental Dollar Opportunity, 2025-2035
  • Figure 25: Latin America Incremental Dollar Opportunity, 2025-2035
  • Figure 26: Western Europe Incremental Dollar Opportunity, 2025-2035
  • Figure 27: Eastern Europe Incremental Dollar Opportunity, 2025-2035
  • Figure 28: East Asia Incremental Dollar Opportunity, 2025-2035
  • Figure 29: South Asia and Pacific Incremental Dollar Opportunity, 2025-2035
  • Figure 30: Middle East & Africa Incremental Dollar Opportunity, 2025-2035
  • Figure 31: North America Value Share and BPS Analysis by Country, 2025 and 2035
  • Figure 32: North America Value Share and BPS Analysis by Component , 2025 and 2035
  • Figure 33: North America Y-o-Y Growth Comparison by Component , 2025-2035
  • Figure 34: North America Attractiveness Analysis by Component
  • Figure 35: North America Value Share and BPS Analysis by Data Center Type, 2025 and 2035
  • Figure 36: North America Y-o-Y Growth Comparison by Data Center Type, 2025-2035
  • Figure 37: North America Attractiveness Analysis by Data Center Type
  • Figure 38: North America Value Share and BPS Analysis by Data Center Tier, 2025 and 2035
  • Figure 39: North America Y-o-Y Growth Comparison by Data Center Tier, 2025-2035
  • Figure 40: North America Attractiveness Analysis by Data Center Tier
  • Figure 41: North America Value Share and BPS Analysis by Installation Type, 2025 and 2035
  • Figure 42: North America Y-o-Y Growth Comparison by Installation Type, 2025-2035
  • Figure 43: North America Attractiveness Analysis by Installation Type
  • Figure 44: North America Value Share and BPS Analysis by End User, 2025 and 2035
  • Figure 45: North America Y-o-Y Growth Comparison by End User, 2025-2035
  • Figure 46: North America Attractiveness Analysis by End User
  • Figure 47: North America Value Share and BPS Analysis by Industry, 2025 and 2035
  • Figure 48: North America Y-o-Y Growth Comparison by Industry, 2025-2035
  • Figure 49: North America Attractiveness Analysis by Industry
  • Figure 50: Latin America Value Share and BPS Analysis by Country, 2025 and 2035
  • Figure 51: Latin America Value Share and BPS Analysis by Component , 2025 and 2035
  • Figure 52: Latin America Y-o-Y Growth Comparison by Component , 2025-2035
  • Figure 53: Latin America Attractiveness Analysis by Component
  • Figure 54: Latin America Value Share and BPS Analysis by Data Center Type, 2025 and 2035
  • Figure 55: Latin America Y-o-Y Growth Comparison by Data Center Type, 2025-2035
  • Figure 56: Latin America Attractiveness Analysis by Data Center Type
  • Figure 57: Latin America Value Share and BPS Analysis by Data Center Tier, 2025 and 2035
  • Figure 58: Latin America Y-o-Y Growth Comparison by Data Center Tier, 2025-2035
  • Figure 59: Latin America Attractiveness Analysis by Data Center Tier
  • Figure 60: Latin America Value Share and BPS Analysis by Installation Type, 2025 and 2035
  • Figure 61: Latin America Y-o-Y Growth Comparison by Installation Type, 2025-2035
  • Figure 62: Latin America Attractiveness Analysis by Installation Type
  • Figure 63: Latin America Value Share and BPS Analysis by End User, 2025 and 2035
  • Figure 64: Latin America Y-o-Y Growth Comparison by End User, 2025-2035
  • Figure 65: Latin America Attractiveness Analysis by End User
  • Figure 66: Latin America Value Share and BPS Analysis by Industry, 2025 and 2035
  • Figure 67: Latin America Y-o-Y Growth Comparison by Industry, 2025-2035
  • Figure 68: Latin America Attractiveness Analysis by Industry
  • Figure 69: Western Europe Value Share and BPS Analysis by Country, 2025 and 2035
  • Figure 70: Western Europe Value Share and BPS Analysis by Component , 2025 and 2035
  • Figure 71: Western Europe Y-o-Y Growth Comparison by Component , 2025-2035
  • Figure 72: Western Europe Attractiveness Analysis by Component
  • Figure 73: Western Europe Value Share and BPS Analysis by Data Center Type, 2025 and 2035
  • Figure 74: Western Europe Y-o-Y Growth Comparison by Data Center Type, 2025-2035
  • Figure 75: Western Europe Attractiveness Analysis by Data Center Type
  • Figure 76: Western Europe Value Share and BPS Analysis by Data Center Tier, 2025 and 2035
  • Figure 77: Western Europe Y-o-Y Growth Comparison by Data Center Tier, 2025-2035
  • Figure 78: Western Europe Attractiveness Analysis by Data Center Tier
  • Figure 79: Western Europe Value Share and BPS Analysis by Installation Type, 2025 and 2035
  • Figure 80: Western Europe Y-o-Y Growth Comparison by Installation Type, 2025-2035
  • Figure 81: Western Europe Attractiveness Analysis by Installation Type
  • Figure 82: Western Europe Value Share and BPS Analysis by End User, 2025 and 2035
  • Figure 83: Western Europe Y-o-Y Growth Comparison by End User, 2025-2035
  • Figure 84: Western Europe Attractiveness Analysis by End User
  • Figure 85: Western Europe Value Share and BPS Analysis by Industry, 2025 and 2035
  • Figure 86: Western Europe Y-o-Y Growth Comparison by Industry, 2025-2035
  • Figure 87: Western Europe Attractiveness Analysis by Industry
  • Figure 88: Eastern Europe Value Share and BPS Analysis by Country, 2025 and 2035
  • Figure 89: Eastern Europe Value Share and BPS Analysis by Component , 2025 and 2035
  • Figure 90: Eastern Europe Y-o-Y Growth Comparison by Component , 2025-2035
  • Figure 91: Eastern Europe Attractiveness Analysis by Component
  • Figure 92: Eastern Europe Value Share and BPS Analysis by Data Center Type, 2025 and 2035
  • Figure 93: Eastern Europe Y-o-Y Growth Comparison by Data Center Type, 2025-2035
  • Figure 94: Eastern Europe Attractiveness Analysis by Data Center Type
  • Figure 95: Eastern Europe Value Share and BPS Analysis by Data Center Tier, 2025 and 2035
  • Figure 96: Eastern Europe Y-o-Y Growth Comparison by Data Center Tier, 2025-2035
  • Figure 97: Eastern Europe Attractiveness Analysis by Data Center Tier
  • Figure 98: Eastern Europe Value Share and BPS Analysis by Installation Type, 2025 and 2035
  • Figure 99: Eastern Europe Y-o-Y Growth Comparison by Installation Type, 2025-2035
  • Figure 100: Eastern Europe Attractiveness Analysis by Installation Type
  • Figure 101: Eastern Europe Value Share and BPS Analysis by End User, 2025 and 2035
  • Figure 102: Eastern Europe Y-o-Y Growth Comparison by End User, 2025-2035
  • Figure 103: Eastern Europe Attractiveness Analysis by End User
  • Figure 104: Eastern Europe Value Share and BPS Analysis by Industry, 2025 and 2035
  • Figure 105: Eastern Europe Y-o-Y Growth Comparison by Industry, 2025-2035
  • Figure 106: Eastern Europe Attractiveness Analysis by Industry
  • Figure 107: East Asia Value Share and BPS Analysis by Country, 2025 and 2035
  • Figure 108: East Asia Value Share and BPS Analysis by Component , 2025 and 2035
  • Figure 109: East Asia Y-o-Y Growth Comparison by Component , 2025-2035
  • Figure 110: East Asia Attractiveness Analysis by Component
  • Figure 111: East Asia Value Share and BPS Analysis by Data Center Type, 2025 and 2035
  • Figure 112: East Asia Y-o-Y Growth Comparison by Data Center Type, 2025-2035
  • Figure 113: East Asia Attractiveness Analysis by Data Center Type
  • Figure 114: East Asia Value Share and BPS Analysis by Data Center Tier, 2025 and 2035
  • Figure 115: East Asia Y-o-Y Growth Comparison by Data Center Tier, 2025-2035
  • Figure 116: East Asia Attractiveness Analysis by Data Center Tier
  • Figure 117: East Asia Value Share and BPS Analysis by Installation Type, 2025 and 2035
  • Figure 118: East Asia Y-o-Y Growth Comparison by Installation Type, 2025-2035
  • Figure 119: East Asia Attractiveness Analysis by Installation Type
  • Figure 120: East Asia Value Share and BPS Analysis by End User, 2025 and 2035
  • Figure 121: East Asia Y-o-Y Growth Comparison by End User, 2025-2035
  • Figure 122: East Asia Attractiveness Analysis by End User
  • Figure 123: East Asia Value Share and BPS Analysis by Industry, 2025 and 2035
  • Figure 124: East Asia Y-o-Y Growth Comparison by Industry, 2025-2035
  • Figure 125: East Asia Attractiveness Analysis by Industry
  • Figure 126: South Asia and Pacific Value Share and BPS Analysis by Country, 2025 and 2035
  • Figure 127: South Asia and Pacific Value Share and BPS Analysis by Component , 2025 and 2035
  • Figure 128: South Asia and Pacific Y-o-Y Growth Comparison by Component , 2025-2035
  • Figure 129: South Asia and Pacific Attractiveness Analysis by Component
  • Figure 130: South Asia and Pacific Value Share and BPS Analysis by Data Center Type, 2025 and 2035
  • Figure 131: South Asia and Pacific Y-o-Y Growth Comparison by Data Center Type, 2025-2035
  • Figure 132: South Asia and Pacific Attractiveness Analysis by Data Center Type
  • Figure 133: South Asia and Pacific Value Share and BPS Analysis by Data Center Tier, 2025 and 2035
  • Figure 134: South Asia and Pacific Y-o-Y Growth Comparison by Data Center Tier, 2025-2035
  • Figure 135: South Asia and Pacific Attractiveness Analysis by Data Center Tier
  • Figure 136: South Asia and Pacific Value Share and BPS Analysis by Installation Type, 2025 and 2035
  • Figure 137: South Asia and Pacific Y-o-Y Growth Comparison by Installation Type, 2025-2035
  • Figure 138: South Asia and Pacific Attractiveness Analysis by Installation Type
  • Figure 139: South Asia and Pacific Value Share and BPS Analysis by End User, 2025 and 2035
  • Figure 140: South Asia and Pacific Y-o-Y Growth Comparison by End User, 2025-2035
  • Figure 141: South Asia and Pacific Attractiveness Analysis by End User
  • Figure 142: South Asia and Pacific Value Share and BPS Analysis by Industry, 2025 and 2035
  • Figure 143: South Asia and Pacific Y-o-Y Growth Comparison by Industry, 2025-2035
  • Figure 144: South Asia and Pacific Attractiveness Analysis by Industry
  • Figure 145: Middle East & Africa Value Share and BPS Analysis by Country, 2025 and 2035
  • Figure 146: Middle East & Africa Value Share and BPS Analysis by Component , 2025 and 2035
  • Figure 147: Middle East & Africa Y-o-Y Growth Comparison by Component , 2025-2035
  • Figure 148: Middle East & Africa Attractiveness Analysis by Component
  • Figure 149: Middle East & Africa Value Share and BPS Analysis by Data Center Type, 2025 and 2035
  • Figure 150: Middle East & Africa Y-o-Y Growth Comparison by Data Center Type, 2025-2035
  • Figure 151: Middle East & Africa Attractiveness Analysis by Data Center Type
  • Figure 152: Middle East & Africa Value Share and BPS Analysis by Data Center Tier, 2025 and 2035
  • Figure 153: Middle East & Africa Y-o-Y Growth Comparison by Data Center Tier, 2025-2035
  • Figure 154: Middle East & Africa Attractiveness Analysis by Data Center Tier
  • Figure 155: Middle East & Africa Value Share and BPS Analysis by Installation Type, 2025 and 2035
  • Figure 156: Middle East & Africa Y-o-Y Growth Comparison by Installation Type, 2025-2035
  • Figure 157: Middle East & Africa Attractiveness Analysis by Installation Type
  • Figure 158: Middle East & Africa Value Share and BPS Analysis by End User, 2025 and 2035
  • Figure 159: Middle East & Africa Y-o-Y Growth Comparison by End User, 2025-2035
  • Figure 160: Middle East & Africa Attractiveness Analysis by End User
  • Figure 161: Middle East & Africa Value Share and BPS Analysis by Industry, 2025 and 2035
  • Figure 162: Middle East & Africa Y-o-Y Growth Comparison by Industry, 2025-2035
  • Figure 163: Middle East & Africa Attractiveness Analysis by Industry
  • Figure 164: Global - Tier Structure Analysis
  • Figure 165: Global - Company Share Analysis
Dashboard
Dashboard
Dashboard
Dashboard
Dashboard
Dashboard

Full Research Suite comprises of:

Market outlook & trends analysis

Market outlook & trends analysis

Interviews & case studies

Interviews & case studies

Strategic recommendations

Strategic recommendations

Vendor profiles & capabilities analysis

Vendor profiles & capabilities analysis

5-year forecasts

5-year forecasts

8 regions and 60+ country-level data splits

8 regions and 60+ country-level data splits

Market segment data splits

Market segment data splits

12 months of continuous data updates

12 months of continuous data updates

DELIVERED AS:

PDF EXCEL ONLINE

Full Research Suite


$5000

$7500

$10000

Buy Report Now
Similar Industry Reports

Similar Industry Reports

Data Acquisition Hardware Market

Data Acquisition Hardware Market Size and Share Forecast Outlook 2025 to 2035

Data Discovery Market

Data Discovery Market Size and Share Forecast Outlook 2025 to 2035

Data Centre Rack Server Market

Data Centre Rack Server Market Size and Share Forecast Outlook 2025 to 2035

Data Centre Colocation Market

Data Centre Colocation Market Size and Share Forecast Outlook 2025 to 2035

Data Lake Market
Data Lake Market

Data Lake Market Size and Share Forecast Outlook 2025 to 2035

Data Lakehouse Market

Data Lakehouse Market Size and Share Forecast Outlook 2025 to 2035

Data Centre UPS Market

Data Centre UPS Market Size and Share Forecast Outlook 2025 to 2035

Data-Driven Retail Solution Market

Data-Driven Retail Solution Market Size and Share Forecast Outlook 2025 to 2035

Data Science Platform Market

Data Science Platform Market Size and Share Forecast Outlook 2025 to 2035

Data Monetization Platform Market

Data Monetization Platform Market Size and Share Forecast Outlook 2025 to 2035

Data Conversion Services Market

Data Conversion Services Market Size and Share Forecast Outlook 2025 to 2035

Data Exfiltration Market

Data Exfiltration Market Size and Share Forecast Outlook 2025 to 2035

Data Virtualization Cloud Market

Data Virtualization Cloud Market Analysis – Growth & Forecast 2025 to 2035

Data Fabric Market
Data Fabric Market

Data Fabric Market Analysis - Trends, Size & Forecast 2025 to 2035

Data Warehouse as a Service (DWaaS) Market

Data Warehouse as a Service Market - Cloud Trends & Forecast 2025 to 2035

Data Catalog Market
Data Catalog Market

Data Catalog Market Trends - Growth & Forecast 2025 to 2035

Data As A Service (DaaS) Market

Data as a Service (DaaS) Market Analysis by Pricing Model, Deployment Type, End User, and Region Through 2035

Data Governance Market

Data Governance – AI-Driven Compliance & Security

Data Orchestration Tool Market

Cloud-Based Data Orchestration – AI for Smarter Insights

DataOps Platform Market

DataOps Platform Market Trends – Growth & Forecast 2024-2034

Future Market Insights

Data Center Power Management Industry Analysis in Korea

Chat With MaRIA

Chat With

MaRIA

Hi There, I am MaRIA, Your Market Research Intelligence Assistant. How may I help you?