Reports

- Global Locations -

Headquarters

Future Market Insights, Inc.

Christiana Corporate, 200
Continental Drive, Suite 401,
Newark, Delaware - 19713,
United States

T: +1-845-579-5705

Americas

Future Market Insights, Inc.

616 Corporate Way, Suite 2-9018,
Valley Cottage, NY 10989, United States

T: +1-347-918-3531

MEA

Future Market Insights

1602-6 Jumeirah Bay X2 Tower, Plot No: JLT-PH2-X2A,
Jumeirah Lakes Towers, Dubai,
United Arab Emirates

Europe

Future Market Insights

3rd Floor, 207 Regent Street,
W1B 3HH London
United Kingdom

T: + 44 (0) 20 8123 9659
D: +44 (0) 20 3287 4268

Asia Pacific

Future Market Insights

IndiaLand Global Tech Park, Unit UG-1, Behind Grand HighStreet, Phase 1, Hinjawadi, MH, Pune – 411057, India

Data Science Platform Market Outlook

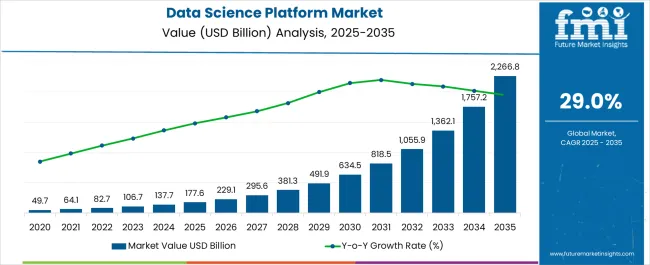
A prodigious CAGR of 29% is predicted for the sector by 2033. According to FMI, the revenue share of the data science platform market is anticipated to increase from US$ 106.74 billion in 2023 to US$ 1,362.09 billion by 2033.

The growing application of machine learning in these systems satisfies demands in model construction, scalability, and deployment. Data management and data science are being advanced by artificial intelligence and machine learning. Additionally, it is anticipated that the market share is likely to increase due to the advancement of Big Data technology and the significance of data collection.

Don't pay for what you don't need

Customize your report by selecting specific countries or regions and save 30%!

Organizations and Data Science Platforms Work Together to Improve Market Share

Data science platforms are being used by organizations including banks and financial institutions, healthcare providers, retail and e-commerce businesses, and even government and public organizations. Different organizations have come a long way to gather insights, make better decisions, and improve customer experiences.

Businesses are making significant investments in data science platforms to enhance consumer experiences, develop cutting-edge goods and services, and gain a competitive edge in the market. Companies are also investing in data science platforms to generate individualized customer experiences, understand customer behavior and trends, and increase customer loyalty.

To improve the companies' end-to-end data management and evaluation process, the players included new technology in their product offerings. For instance

  • Mathworks Inc. purchased VetcorZero in April 2020. VetcorZero is a software-based business that sells roadrunner software. This program offers a visual presentation while modeling road maps.
  • Aigenpulse debuted a data intelligence platform in June 2020 to speed up drug research and discovery. The Aigenpulse platform enhances analytics and supports scientific decision-making by utilizing the most recent Machine Learning (ML) and Artificial Intelligence (AI) tools.

The telecommunications sector is growing due to the active application of data science and machine learning. Telecom businesses utilize extensive communication networks and infrastructures to run with the full data flow. One of the most useful solutions is using data science tools to analyze and handle this data.

Attributes Details
Data Science Platform Market CAGR (2023 to 2033) 29%
Data Science Platform Market Size (2023) US$ 106.74 billion
Data Science Platform Market Size (2033) US$ 1,362.09 billion

Analysis of the Data Science Platform Market Transformation: 2016 to 2022 vs. 2023 to 2033

When compared to the 25.2% CAGR recorded between 2016 and 2022, the data science platform business is predicted to expand at a 29.0% CAGR between 2023 and 2033. The average growth of the market is expected to be around 1.29x between 2022 and 2023.

Year Market Value
2016 US$ 17.95 billion
2016 US$ 64.14 billion
2022 US$ 82.74 billion

Short-term Growth (2023 to 2026): Due to the adoption of cloud-based products and services, as well as the targeting of developing and untapped areas for data science platforms, the market is predicted to rise rapidly.

Medium-term Growth (2027 to 2029): During this period, it is projected that the development of Big Data technology would be promising for the market.

Long-term Growth (2030 to 2033): Data science is no longer an optional expense for businesses undergoing digital transformation. Many businesses are being assessed to be using a data-driven approach in their operational environment, which encourages global demand.

The companies have publicly said that they want to regularly undertake model-driven campaigns in a number of their functional areas, including sales, operations, manufacturing, and human resources.

Sudip Saha
Sudip Saha

Principal Consultant

Talk to Analyst

Find your sweet spots for generating winning opportunities in this market.

Machine-Generated Data Surpassed Industry-Wide Commercial Data

The pace of technological advancement has been hastened by more research and development spending. As a result, as there are more businesses, there is an increasing need for technology that boosts production and efficiency.

For corporate growth, modern data handling methods and solutions are crucial, and there is a high need for data science platforms, which makes it easier to train, create, scale, and deploy ML models.

There is a growing flow of data in both organized and unstructured formats as a result of the Internet of Things (IoT), social media, and multimedia. Data generated by humans and machines is expanding 10x faster than data generated by businesses.

Lack of Technical and Analytical Thinking Limits Demand for Data Science Platform

Advanced analytics techniques are used by organizations, such as machine learning, streaming analytics, and predictive analytics. To create a machine learning model, technical proficiency and analytical thinking skills are required.

Many end users lack the workforce with the necessary technical knowledge and abilities, which impedes the market's expansion. Significant barriers to the industry's expansion include a lack of technology dependability, data security, and privacy issues, strict government rules and regulations, and high investment needs.

This technology's users need to upgrade their platforms frequently to keep up with new technologies and data resources, which is another issue limiting the market's expansion. The proliferation of data, a lack of analytical skills, and a lack of domain expertise are a few barriers in this sector.

Get the data you need at a Fraction of the cost

Personalize your report by choosing insights you need
and save 40%!

Comparative View of the Data Science Platform Market

Data Science Platform Market:

Attributes Data Science Platform Market
CAGR (2023 to 2033) 29%
Market Value (2033) US$ 1,362.09 billion
Growth Factor Requirement of modern-data handling system
Opportunity Growing model-driven campaigns
Key Trends Adoption by multiple organizations

Data-driven Retail Solution Market:

Attributes Data-driven Retail Solution Market
CAGR (2023 to 2033) 11.8%
Market Value (2033) US$ 68.9 billion
Growth Factor Demand for a personalized experience
Opportunity Growing smart solutions for retail procedures
Key Trends The growing trend of digitalization

Data Management Platform Market:

Attributes Data Management Platform Market
CAGR (2023 to 2033) 12.1%
Market Value (2033) US$ 6.61 billion
Growth Factor Surging application of AI
Opportunity Heavy investments in data collection and management software
Key Trends The growing use of connected devices

Category-wise Outlook

Businesses Implement Cloud-Based Strategies to Get a Competitive Edge.

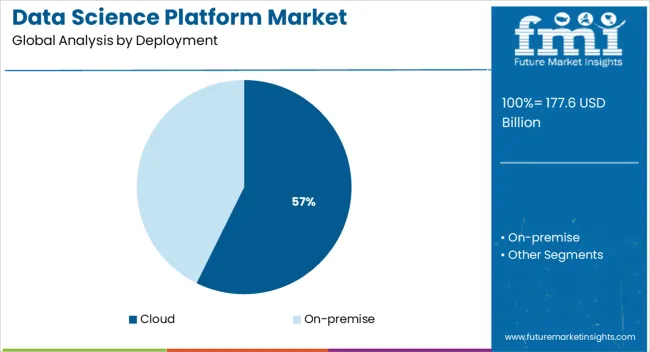
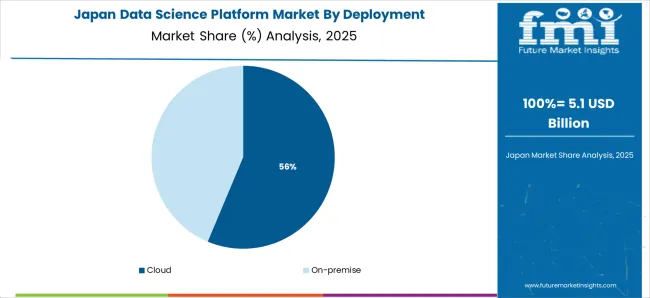
Cloud-based deployment provides real-time data transfer that helps in improving services and business operations. Due to this, the cloud segment currently holds the leading data science platform market share and is anticipated to expand at the leading CAGR during the projection period.

The SAS Institute debuted its "SAS Viya" all-in-one platform on the Microsoft Azure market in September 2022. By enabling the cloud-based deployment of their product, they broadened their business model.

Big IT Budgets Support Large Enterprises to have a Strong Customer Base

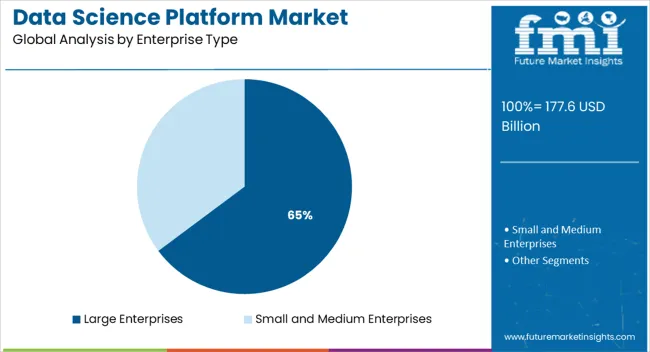
Over the projected period, the large enterprise is anticipated to lead the revenue share. The availability of a high percentage of IT budgets is expected to enhance the need for data science platforms in large enterprises.

The category of small and medium-sized businesses is anticipated to experience a high CAGR over the forecast period due to the growing adoption of digital platforms. SMEs are making investments in this platform to improve their customer support functions, which can aid in business growth.
Region-wise Analysis

Automated Machine Learning Promotes the Adoption of Data Science Platforms in the United States

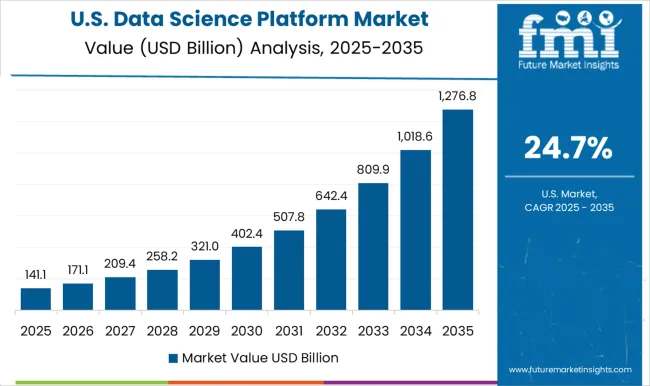
The data science platform sector in the United States was estimated to be worth US$ 2.59 billion in 2018 and is anticipated to rise to US$ 71.87 billion by 2033. The market is expected to see a CAGR of 24.8% by 2033.

This rise is attributable to the rising importance of data-driven decision-making in the sector. The rising number of data science specialists and the rising requirement for data-driven decision-making among companies leads to high demand for data science platforms.

The expanding need for automated machine learning and the availability of open-source and cloud-based platforms are all contributing factors to the market's expansion.

The launch of a cloud-based data science platform was announced by the technology corporation Oracle in February 2020. The new platform's capabilities include shared projects, team security policies, audibility, reproducibility, and model catalogs.

Government Initiatives Prove to be Profitable for the United Kingdom Market

Attributes Statistics
United Kingdom Market Value 2033 US$ 4.66 billion
United Kingdom Market Value 2023 US$ 1.64 billion
United Kingdom Market CAGR (2023-2033) 11%

The need for effective data storage and management solutions, as well as the rising demand for advanced data analytics and AI-driven solutions, are predicted to fuel this expansion. The expansion is also aided by the rise of IoT technologies and the increased use of smart devices.

Through the introduction of several programs, like the Digital Economy Network, which aims to assist businesses in maximizing the potential of data analytics, the United Kingdom government is also supporting the usage of data science platforms.

Asia Pacific to Set New Trends in the Data Science Platform Industry

Country China
Market Value (2022) US$ 4.82 billion
Market Value (2033) US$ 78.65 billion
Market CAGR (2023 to 2033) 28.9%
Country India
Market Value (2022) US$ 1.27 billion
Market Value (2033) US$ 10.26 billion
Market CAGR (2023 to 2033) 20.9%
Country Japan
Market Value (2022) US$ 9.2 billion
Market Value (2033) US$ 22.85 billion
Market CAGR (2023 to 2033) 8.6%

China Market Outlook

This expansion is ascribed to the speedy uptake of data science platforms and technologies by businesses across. The market's expansion is being further fueled by the rising need for big data and predictive analytics technology. The government's attempts to encourage business adoption of AI are also anticipated to accelerate industry expansion.

Initiatives in the Indian Market
  • The National Data and Analytics Platform (NDAP) was established by the Indian government to give various users unified access to data and analytics services. This platform makes it possible to make decisions based on data by giving users access to fast, pertinent, and accurate data and analytics tools.
  • The National Data Science Platform (NDSP), created by the National Informatics Centre (NIC), is a platform for data science that enables data scientists from the public and private sectors to collaborate and create answers to the nation's data-related concerns.

Japan Market Outlook

In terms of AI development and application, Japan is one of the top nations in the world. To help organizations quickly and effectively implement AI solutions and capitalize on the technology, firms like IBM and Microsoft have introduced platforms for AI-as-a-Service.

To improve data accessibility, Japan is also making use of open data platforms. Businesses can now access, analyze, and use data from a variety of sources thanks to platforms that have been launched by companies like Fujitsu and NTT Data.
Competitive Landscape

Startups Provide a Modern Approach to Target a Large Market Share

Due to the rising need for data-driven insights and analytics, startups in the market for data science platforms are also expanding. To extract insights from data, they are using cutting-edge technologies like machine learning and artificial intelligence.

They are also implementing advanced analytics solutions to power the decision-making process. Startups are also concentrating on enhancing the consumer experience by offering sophisticated data-driven solutions. This is helping the data science platform sector develop even further.

Recent Developments

  • The Diamondback tape library, an LTO-formatted product that delivers up to 27 petabytes (PB) of storage in a single server rack, was introduced by IBM Corporation in October 2022.
  • To provide a professional service of integrated risk solutions, particularly around Asset Liability Management (ALM), and support other industries including banking and finance, SAS Institute bought Kamakura Corporation in June 2022.
  • To increase its presence in the Indian market, Dataiku teamed with Polestar Solutions, an APAC firm, in February 2022. Dataiku wants to give Asian Pacific businesses access to an "Everyday AI" platform.
  • A new analytic marketplace, safe data cooperation, and automatic cost optimization are just a few of the innovations and features that Databricks contributed to data sharing in June 2022.

Key Players Making Progress in the Market: Leading Examples

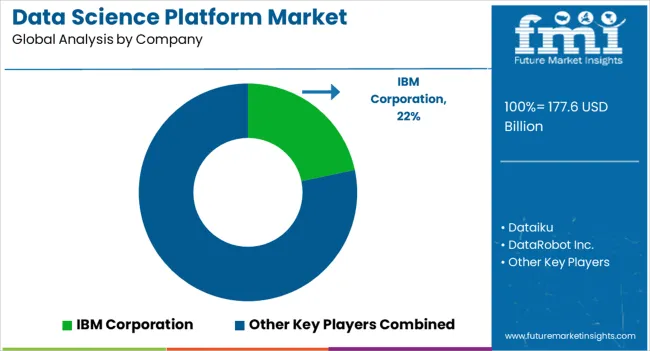
IBM Data scientists can work on a variety of data science projects using an integrated set of tools provided by IBM's complete platform, IBM Watson Studio. Data scientists can work together and examine data from diverse sources using IBM's platform. The platform from IBM offers data scientists a wide range of resources and services to assist them in creating predictive models, visualizing data, and working together with coworkers.
Microsoft The Azure platform from Microsoft offers a broad range of cloud-based services designed with data scientists in mind. For the benefit of data scientists, Azure offers access to a variety of potent tools and services, such as machine learning and artificial intelligence. To aid data scientists in delving further into their data, Azure also gives users access to a variety of big data and analytics capabilities, including HDInsight and Power BI.
Amazon For data scientists, Amazon has created a complete platform known as Amazon Web Services (AWS). Data scientists can leverage a range of cloud-based services from AWS to analyze, display, and create models. To assist data scientists to obtain a great understanding of their data, AWS also gives them access to a variety of big data and analytics services, including Amazon Athena and Amazon Redshift.
Google A complete platform for data scientists called Google Cloud Platform has been created by Google (GCP). Data scientists can access a range of cloud-based services through GCP, including Google BigQuery, Google Data Studio, and Google Cloud ML, to analyze, visualize, and create models. To help data scientists develop a deeper understanding of their data, GCP also gives them access to a variety of big data and analytics technologies, including Google BigQuery and Google Cloud ML.

Key players

  • IBM Corporation
  • Dataiku
  • DataRobot Inc.
  • TIBCO Software Inc.
  • Databricks
  • The Mathworks Inc.
  • SAS Institute Inc.
  • Microsoft Corporation
  • Alteryx Inc.
  • Oracle Corporation

Key segments

By Deployment:

  • Cloud
  • On-premise

By Application:

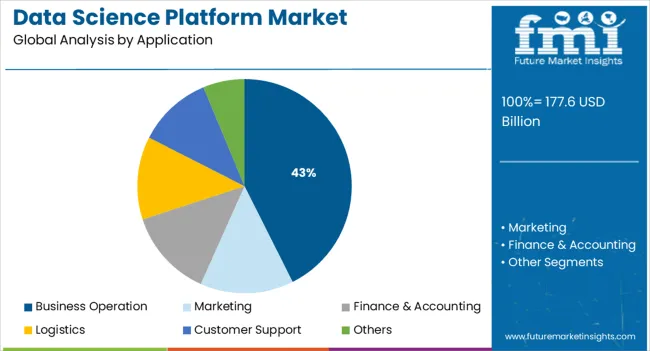
  • Business Operation
  • Marketing
  • Finance & Accounting
  • Logistics
  • Customer Support
  • Others

By Enterprise Type:

  • Large Enterprises
  • Small and Medium Enterprises

By Industry:

  • BFSI
  • IT & Telecom
  • Healthcare
  • Retail
  • Manufacturing
  • Transportation
  • Others

By Region:

  • North America
  • Latin America
  • Europe
  • East Asia
  • South Asia Pacific
  • Middle East and Africa

Frequently Asked Questions

What is the CAGR from 2023 to 2033?

A CAGR of 29% is estimated throughout 2033.

How did the market grow historically?

From 2016 to 2022, the market expanded at a 25.2% CAGR.

What is the average growth from 2022 to 2023?

The market is predicted to grow by 1.29x between 2022 and 2023.

Why is the Demand for Data Science Platform Rising?

Increasing demand for modern data handling systems will drive market growth.

What is the expected value of China?

By 2033, the market is expected to reach a CAGR of 28.9%.

Table of Content

1. Executive Summary | Data Science Platform Market

    1.1. Global Market Outlook

    1.2. Demand-side Trends

    1.3. Supply-side Trends

    1.4. Technology Roadmap Analysis

    1.5. Analysis and Recommendations

2. Market Overview

    2.1. Market Coverage / Taxonomy

    2.2. Market Definition / Scope / Limitations

3. Market Background

    3.1. Market Dynamics

        3.1.1. Drivers

        3.1.2. Restraints

        3.1.3. Opportunity

        3.1.4. Trends

    3.2. Scenario Forecast

        3.2.1. Demand in Optimistic Scenario

        3.2.2. Demand in Likely Scenario

        3.2.3. Demand in Conservative Scenario

    3.3. Opportunity Map Analysis

    3.4. Investment Feasibility Matrix

    3.5. PESTLE and Porter’s Analysis

    3.6. Regulatory Landscape

        3.6.1. By Key Regions

        3.6.2. By Key Countries

    3.7. Regional Parent Market Outlook

4. Global Market Analysis 2018 to 2022 and Forecast, 2023 to 2033

    4.1. Historical Market Size Value (US$ Million) Analysis, 2018 to 2022

    4.2. Current and Future Market Size Value (US$ Million) Projections, 2023 to 2033

        4.2.1. Y-o-Y Growth Trend Analysis

        4.2.2. Absolute $ Opportunity Analysis

5. Global Market Analysis 2018 to 2022 and Forecast 2023 to 2033, By Component

    5.1. Introduction / Key Findings

    5.2. Historical Market Size Value (US$ Million) Analysis By Component, 2018 to 2022

    5.3. Current and Future Market Size Value (US$ Million) Analysis and Forecast By Component, 2023 to 2033

        5.3.1. Platform

        5.3.2. Services

    5.4. Y-o-Y Growth Trend Analysis By Component, 2018 to 2022

    5.5. Absolute $ Opportunity Analysis By Component, 2023 to 2033

6. Global Market Analysis 2018 to 2022 and Forecast 2023 to 2033, By Deployment Mode

    6.1. Introduction / Key Findings

    6.2. Historical Market Size Value (US$ Million) Analysis By Deployment Mode, 2018 to 2022

    6.3. Current and Future Market Size Value (US$ Million) Analysis and Forecast By Deployment Mode, 2023 to 2033

        6.3.1. Cloud

        6.3.2. On-premises

    6.4. Y-o-Y Growth Trend Analysis By Deployment Mode, 2018 to 2022

    6.5. Absolute $ Opportunity Analysis By Deployment Mode, 2023 to 2033

7. Global Market Analysis 2018 to 2022 and Forecast 2023 to 2033, By Enterprise Size

    7.1. Introduction / Key Findings

    7.2. Historical Market Size Value (US$ Million) Analysis By Enterprise Size , 2018 to 2022

    7.3. Current and Future Market Size Value (US$ Million) Analysis and Forecast By Enterprise Size , 2023 to 2033

        7.3.1. Small and Medium-Sized Enterprises

        7.3.2. Large Enterprises

    7.4. Y-o-Y Growth Trend Analysis By Enterprise Size , 2018 to 2022

    7.5. Absolute $ Opportunity Analysis By Enterprise Size , 2023 to 2033

8. Global Market Analysis 2018 to 2022 and Forecast 2023 to 2033, By Application

    8.1. Introduction / Key Findings

    8.2. Historical Market Size Value (US$ Million) Analysis By Application, 2018 to 2022

    8.3. Current and Future Market Size Value (US$ Million) Analysis and Forecast By Application, 2023 to 2033

        8.3.1. Marketing & Sales

        8.3.2. Logistics

        8.3.3. Finance and Accounting

        8.3.4. Customer Support

    8.4. Y-o-Y Growth Trend Analysis By Application, 2018 to 2022

    8.5. Absolute $ Opportunity Analysis By Application, 2023 to 2033

9. Global Market Analysis 2018 to 2022 and Forecast 2023 to 2033, By End-User

    9.1. Introduction / Key Findings

    9.2. Historical Market Size Value (US$ Million) Analysis By End-User, 2018 to 2022

    9.3. Current and Future Market Size Value (US$ Million) Analysis and Forecast By End-User, 2023 to 2033

        9.3.1. BFSI

        9.3.2. IT and Telecom

        9.3.3. Transportation

        9.3.4. Healthcare

        9.3.5. Government and Defence

        9.3.6. Energy and Utilities

        9.3.7. Retail and E-Commerce

    9.4. Y-o-Y Growth Trend Analysis By End-User, 2018 to 2022

    9.5. Absolute $ Opportunity Analysis By End-User, 2023 to 2033

10. Global Market Analysis 2018 to 2022 and Forecast 2023 to 2033, By Region

    10.1. Introduction

    10.2. Historical Market Size Value (US$ Million) Analysis By Region, 2018 to 2022

    10.3. Current Market Size Value (US$ Million) Analysis and Forecast By Region, 2023 to 2033

        10.3.1. North America

        10.3.2. Latin America

        10.3.3. Europe

        10.3.4. South Asia

        10.3.5. East Asia

        10.3.6. Oceania

        10.3.7. MEA

    10.4. Market Attractiveness Analysis By Region

11. North America Market Analysis 2018 to 2022 and Forecast 2023 to 2033, By Country

    11.1. Historical Market Size Value (US$ Million) Trend Analysis By Market Taxonomy, 2018 to 2022

    11.2. Market Size Value (US$ Million) Forecast By Market Taxonomy, 2023 to 2033

        11.2.1. By Country

            11.2.1.1. The USA

            11.2.1.2. Canada

        11.2.2. By Component

        11.2.3. By Deployment Mode

        11.2.4. By Enterprise Size

        11.2.5. By Application

        11.2.6. By End-User

    11.3. Market Attractiveness Analysis

        11.3.1. By Country

        11.3.2. By Component

        11.3.3. By Deployment Mode

        11.3.4. By Enterprise Size

        11.3.5. By Application

        11.3.6. By End-User

    11.4. Key Takeaways

12. Latin America Market Analysis 2018 to 2022 and Forecast 2023 to 2033, By Country

    12.1. Historical Market Size Value (US$ Million) Trend Analysis By Market Taxonomy, 2018 to 2022

    12.2. Market Size Value (US$ Million) Forecast By Market Taxonomy, 2023 to 2033

        12.2.1. By Country

            12.2.1.1. Brazil

            12.2.1.2. Mexico

            12.2.1.3. Rest of Latin America

        12.2.2. By Component

        12.2.3. By Deployment Mode

        12.2.4. By Enterprise Size

        12.2.5. By Application

        12.2.6. By End-User

    12.3. Market Attractiveness Analysis

        12.3.1. By Country

        12.3.2. By Component

        12.3.3. By Deployment Mode

        12.3.4. By Enterprise Size

        12.3.5. By Application

        12.3.6. By End-User

    12.4. Key Takeaways

13. Europe Market Analysis 2018 to 2022 and Forecast 2023 to 2033, By Country

    13.1. Historical Market Size Value (US$ Million) Trend Analysis By Market Taxonomy, 2018 to 2022

    13.2. Market Size Value (US$ Million) Forecast By Market Taxonomy, 2023 to 2033

        13.2.1. By Country

            13.2.1.1. Germany

            13.2.1.2. United Kingdom

            13.2.1.3. France

            13.2.1.4. Spain

            13.2.1.5. Italy

            13.2.1.6. Rest of Europe

        13.2.2. By Component

        13.2.3. By Deployment Mode

        13.2.4. By Enterprise Size

        13.2.5. By Application

        13.2.6. By End-User

    13.3. Market Attractiveness Analysis

        13.3.1. By Country

        13.3.2. By Component

        13.3.3. By Deployment Mode

        13.3.4. By Enterprise Size

        13.3.5. By Application

        13.3.6. By End-User

    13.4. Key Takeaways

14. South Asia Market Analysis 2018 to 2022 and Forecast 2023 to 2033, By Country

    14.1. Historical Market Size Value (US$ Million) Trend Analysis By Market Taxonomy, 2018 to 2022

    14.2. Market Size Value (US$ Million) Forecast By Market Taxonomy, 2023 to 2033

        14.2.1. By Country

            14.2.1.1. India

            14.2.1.2. Malaysia

            14.2.1.3. Singapore

            14.2.1.4. Thailand

            14.2.1.5. Rest of South Asia

        14.2.2. By Component

        14.2.3. By Deployment Mode

        14.2.4. By Enterprise Size

        14.2.5. By Application

        14.2.6. By End-User

    14.3. Market Attractiveness Analysis

        14.3.1. By Country

        14.3.2. By Component

        14.3.3. By Deployment Mode

        14.3.4. By Enterprise Size

        14.3.5. By Application

        14.3.6. By End-User

    14.4. Key Takeaways

15. East Asia Market Analysis 2018 to 2022 and Forecast 2023 to 2033, By Country

    15.1. Historical Market Size Value (US$ Million) Trend Analysis By Market Taxonomy, 2018 to 2022

    15.2. Market Size Value (US$ Million) Forecast By Market Taxonomy, 2023 to 2033

        15.2.1. By Country

            15.2.1.1. China

            15.2.1.2. Japan

            15.2.1.3. South Korea

        15.2.2. By Component

        15.2.3. By Deployment Mode

        15.2.4. By Enterprise Size

        15.2.5. By Application

        15.2.6. By End-User

    15.3. Market Attractiveness Analysis

        15.3.1. By Country

        15.3.2. By Component

        15.3.3. By Deployment Mode

        15.3.4. By Enterprise Size

        15.3.5. By Application

        15.3.6. By End-User

    15.4. Key Takeaways

16. Oceania Market Analysis 2018 to 2022 and Forecast 2023 to 2033, By Country

    16.1. Historical Market Size Value (US$ Million) Trend Analysis By Market Taxonomy, 2018 to 2022

    16.2. Market Size Value (US$ Million) Forecast By Market Taxonomy, 2023 to 2033

        16.2.1. By Country

            16.2.1.1. Australia

            16.2.1.2. New Zealand

        16.2.2. By Component

        16.2.3. By Deployment Mode

        16.2.4. By Enterprise Size

        16.2.5. By Application

        16.2.6. By End-User

    16.3. Market Attractiveness Analysis

        16.3.1. By Country

        16.3.2. By Component

        16.3.3. By Deployment Mode

        16.3.4. By Enterprise Size

        16.3.5. By Application

        16.3.6. By End-User

    16.4. Key Takeaways

17. MEA Market Analysis 2018 to 2022 and Forecast 2023 to 2033, By Country

    17.1. Historical Market Size Value (US$ Million) Trend Analysis By Market Taxonomy, 2018 to 2022

    17.2. Market Size Value (US$ Million) Forecast By Market Taxonomy, 2023 to 2033

        17.2.1. By Country

            17.2.1.1. GCC Countries

            17.2.1.2. South Africa

            17.2.1.3. Israel

            17.2.1.4. Rest of MEA

        17.2.2. By Component

        17.2.3. By Deployment Mode

        17.2.4. By Enterprise Size

        17.2.5. By Application

        17.2.6. By End-User

    17.3. Market Attractiveness Analysis

        17.3.1. By Country

        17.3.2. By Component

        17.3.3. By Deployment Mode

        17.3.4. By Enterprise Size

        17.3.5. By Application

        17.3.6. By End-User

    17.4. Key Takeaways

18. Key Countries Market Analysis

    18.1. USA

        18.1.1. Pricing Analysis

        18.1.2. Market Share Analysis, 2022

            18.1.2.1. By Component

            18.1.2.2. By Deployment Mode

            18.1.2.3. By Enterprise Size

            18.1.2.4. By Application

            18.1.2.5. By End-User

    18.2. Canada

        18.2.1. Pricing Analysis

        18.2.2. Market Share Analysis, 2022

            18.2.2.1. By Component

            18.2.2.2. By Deployment Mode

            18.2.2.3. By Enterprise Size

            18.2.2.4. By Application

            18.2.2.5. By End-User

    18.3. Brazil

        18.3.1. Pricing Analysis

        18.3.2. Market Share Analysis, 2022

            18.3.2.1. By Component

            18.3.2.2. By Deployment Mode

            18.3.2.3. By Enterprise Size

            18.3.2.4. By Application

            18.3.2.5. By End-User

    18.4. Mexico

        18.4.1. Pricing Analysis

        18.4.2. Market Share Analysis, 2022

            18.4.2.1. By Component

            18.4.2.2. By Deployment Mode

            18.4.2.3. By Enterprise Size

            18.4.2.4. By Application

            18.4.2.5. By End-User

    18.5. Germany

        18.5.1. Pricing Analysis

        18.5.2. Market Share Analysis, 2022

            18.5.2.1. By Component

            18.5.2.2. By Deployment Mode

            18.5.2.3. By Enterprise Size

            18.5.2.4. By Application

            18.5.2.5. By End-User

    18.6. United Kingdom

        18.6.1. Pricing Analysis

        18.6.2. Market Share Analysis, 2022

            18.6.2.1. By Component

            18.6.2.2. By Deployment Mode

            18.6.2.3. By Enterprise Size

            18.6.2.4. By Application

            18.6.2.5. By End-User

    18.7. France

        18.7.1. Pricing Analysis

        18.7.2. Market Share Analysis, 2022

            18.7.2.1. By Component

            18.7.2.2. By Deployment Mode

            18.7.2.3. By Enterprise Size

            18.7.2.4. By Application

            18.7.2.5. By End-User

    18.8. Spain

        18.8.1. Pricing Analysis

        18.8.2. Market Share Analysis, 2022

            18.8.2.1. By Component

            18.8.2.2. By Deployment Mode

            18.8.2.3. By Enterprise Size

            18.8.2.4. By Application

            18.8.2.5. By End-User

    18.9. Italy

        18.9.1. Pricing Analysis

        18.9.2. Market Share Analysis, 2022

            18.9.2.1. By Component

            18.9.2.2. By Deployment Mode

            18.9.2.3. By Enterprise Size

            18.9.2.4. By Application

            18.9.2.5. By End-User

    18.10. India

        18.10.1. Pricing Analysis

        18.10.2. Market Share Analysis, 2022

            18.10.2.1. By Component

            18.10.2.2. By Deployment Mode

            18.10.2.3. By Enterprise Size

            18.10.2.4. By Application

            18.10.2.5. By End-User

    18.11. Malaysia

        18.11.1. Pricing Analysis

        18.11.2. Market Share Analysis, 2022

            18.11.2.1. By Component

            18.11.2.2. By Deployment Mode

            18.11.2.3. By Enterprise Size

            18.11.2.4. By Application

            18.11.2.5. By End-User

    18.12. Singapore

        18.12.1. Pricing Analysis

        18.12.2. Market Share Analysis, 2022

            18.12.2.1. By Component

            18.12.2.2. By Deployment Mode

            18.12.2.3. By Enterprise Size

            18.12.2.4. By Application

            18.12.2.5. By End-User

    18.13. Thailand

        18.13.1. Pricing Analysis

        18.13.2. Market Share Analysis, 2022

            18.13.2.1. By Component

            18.13.2.2. By Deployment Mode

            18.13.2.3. By Enterprise Size

            18.13.2.4. By Application

            18.13.2.5. By End-User

    18.14. China

        18.14.1. Pricing Analysis

        18.14.2. Market Share Analysis, 2022

            18.14.2.1. By Component

            18.14.2.2. By Deployment Mode

            18.14.2.3. By Enterprise Size

            18.14.2.4. By Application

            18.14.2.5. By End-User

    18.15. Japan

        18.15.1. Pricing Analysis

        18.15.2. Market Share Analysis, 2022

            18.15.2.1. By Component

            18.15.2.2. By Deployment Mode

            18.15.2.3. By Enterprise Size

            18.15.2.4. By Application

            18.15.2.5. By End-User

    18.16. South Korea

        18.16.1. Pricing Analysis

        18.16.2. Market Share Analysis, 2022

            18.16.2.1. By Component

            18.16.2.2. By Deployment Mode

            18.16.2.3. By Enterprise Size

            18.16.2.4. By Application

            18.16.2.5. By End-User

    18.17. Australia

        18.17.1. Pricing Analysis

        18.17.2. Market Share Analysis, 2022

            18.17.2.1. By Component

            18.17.2.2. By Deployment Mode

            18.17.2.3. By Enterprise Size

            18.17.2.4. By Application

            18.17.2.5. By End-User

    18.18. New Zealand

        18.18.1. Pricing Analysis

        18.18.2. Market Share Analysis, 2022

            18.18.2.1. By Component

            18.18.2.2. By Deployment Mode

            18.18.2.3. By Enterprise Size

            18.18.2.4. By Application

            18.18.2.5. By End-User

    18.19. GCC Countries

        18.19.1. Pricing Analysis

        18.19.2. Market Share Analysis, 2022

            18.19.2.1. By Component

            18.19.2.2. By Deployment Mode

            18.19.2.3. By Enterprise Size

            18.19.2.4. By Application

            18.19.2.5. By End-User

    18.20. South Africa

        18.20.1. Pricing Analysis

        18.20.2. Market Share Analysis, 2022

            18.20.2.1. By Component

            18.20.2.2. By Deployment Mode

            18.20.2.3. By Enterprise Size

            18.20.2.4. By Application

            18.20.2.5. By End-User

    18.21. Israel

        18.21.1. Pricing Analysis

        18.21.2. Market Share Analysis, 2022

            18.21.2.1. By Component

            18.21.2.2. By Deployment Mode

            18.21.2.3. By Enterprise Size

            18.21.2.4. By Application

            18.21.2.5. By End-User

19. Market Structure Analysis

    19.1. Competition Dashboard

    19.2. Competition Benchmarking

    19.3. Market Share Analysis of Top Players

        19.3.1. By Regional

        19.3.2. By Component

        19.3.3. By Deployment Mode

        19.3.4. By Enterprise Size

        19.3.5. By Application

        19.3.6. By End-User

20. Competition Analysis

    20.1. Competition Deep Dive

        20.1.1. Google, Inc

            20.1.1.1. Overview

            20.1.1.2. Product Portfolio

            20.1.1.3. Profitability by Market Segments

            20.1.1.4. Sales Footprint

            20.1.1.5. Strategy Overview

                20.1.1.5.1. Marketing Strategy

        20.1.2. Alteryx, Inc.

            20.1.2.1. Overview

            20.1.2.2. Product Portfolio

            20.1.2.3. Profitability by Market Segments

            20.1.2.4. Sales Footprint

            20.1.2.5. Strategy Overview

                20.1.2.5.1. Marketing Strategy

        20.1.3. Microsoft Corporation

            20.1.3.1. Overview

            20.1.3.2. Product Portfolio

            20.1.3.3. Profitability by Market Segments

            20.1.3.4. Sales Footprint

            20.1.3.5. Strategy Overview

                20.1.3.5.1. Marketing Strategy

        20.1.4. IBM Corporation

            20.1.4.1. Overview

            20.1.4.2. Product Portfolio

            20.1.4.3. Profitability by Market Segments

            20.1.4.4. Sales Footprint

            20.1.4.5. Strategy Overview

                20.1.4.5.1. Marketing Strategy

        20.1.5. SAS Institute, Inc.

            20.1.5.1. Overview

            20.1.5.2. Product Portfolio

            20.1.5.3. Profitability by Market Segments

            20.1.5.4. Sales Footprint

            20.1.5.5. Strategy Overview

                20.1.5.5.1. Marketing Strategy

        20.1.6. Cloudera, Inc.

            20.1.6.1. Overview

            20.1.6.2. Product Portfolio

            20.1.6.3. Profitability by Market Segments

            20.1.6.4. Sales Footprint

            20.1.6.5. Strategy Overview

                20.1.6.5.1. Marketing Strategy

        20.1.7. Dataiku SAS

            20.1.7.1. Overview

            20.1.7.2. Product Portfolio

            20.1.7.3. Profitability by Market Segments

            20.1.7.4. Sales Footprint

            20.1.7.5. Strategy Overview

                20.1.7.5.1. Marketing Strategy

        20.1.8. RapidMiner, Inc

            20.1.8.1. Overview

            20.1.8.2. Product Portfolio

            20.1.8.3. Profitability by Market Segments

            20.1.8.4. Sales Footprint

            20.1.8.5. Strategy Overview

                20.1.8.5.1. Marketing Strategy

        20.1.9. Wolfram Research

            20.1.9.1. Overview

            20.1.9.2. Product Portfolio

            20.1.9.3. Profitability by Market Segments

            20.1.9.4. Sales Footprint

            20.1.9.5. Strategy Overview

                20.1.9.5.1. Marketing Strategy

        20.1.10. Teradata Corporation

            20.1.10.1. Overview

            20.1.10.2. Product Portfolio

            20.1.10.3. Profitability by Market Segments

            20.1.10.4. Sales Footprint

            20.1.10.5. Strategy Overview

                20.1.10.5.1. Marketing Strategy

        20.1.11. WNS Global Services Pvt. Ltd.

            20.1.11.1. Overview

            20.1.11.2. Product Portfolio

            20.1.11.3. Profitability by Market Segments

            20.1.11.4. Sales Footprint

            20.1.11.5. Strategy Overview

                20.1.11.5.1. Marketing Strategy

        20.1.12. H2O.ai

            20.1.12.1. Overview

            20.1.12.2. Product Portfolio

            20.1.12.3. Profitability by Market Segments

            20.1.12.4. Sales Footprint

            20.1.12.5. Strategy Overview

                20.1.12.5.1. Marketing Strategy

        20.1.13. TIBCO Software Inc.

            20.1.13.1. Overview

            20.1.13.2. Product Portfolio

            20.1.13.3. Profitability by Market Segments

            20.1.13.4. Sales Footprint

            20.1.13.5. Strategy Overview

                20.1.13.5.1. Marketing Strategy

        20.1.14. Oracle

            20.1.14.1. Overview

            20.1.14.2. Product Portfolio

            20.1.14.3. Profitability by Market Segments

            20.1.14.4. Sales Footprint

            20.1.14.5. Strategy Overview

                20.1.14.5.1. Marketing Strategy

21. Assumptions & Acronyms Used

22. Research Methodology

Don't pay for what you don't need

Customize your report by selecting specific countries or regions and save 30%!

List of Tables

Table 1: Global Market Value (US$ Million) Forecast by Region, 2018 to 2033

Table 2: Global Market Value (US$ Million) Forecast by Component, 2018 to 2033

Table 3: Global Market Value (US$ Million) Forecast by Deployment Mode, 2018 to 2033

Table 4: Global Market Value (US$ Million) Forecast by Enterprise Size , 2018 to 2033

Table 5: Global Market Value (US$ Million) Forecast by Application, 2018 to 2033

Table 6: Global Market Value (US$ Million) Forecast by End-User, 2018 to 2033

Table 7: North America Market Value (US$ Million) Forecast by Country, 2018 to 2033

Table 8: North America Market Value (US$ Million) Forecast by Component, 2018 to 2033

Table 9: North America Market Value (US$ Million) Forecast by Deployment Mode, 2018 to 2033

Table 10: North America Market Value (US$ Million) Forecast by Enterprise Size , 2018 to 2033

Table 11: North America Market Value (US$ Million) Forecast by Application, 2018 to 2033

Table 12: North America Market Value (US$ Million) Forecast by End-User, 2018 to 2033

Table 13: Latin America Market Value (US$ Million) Forecast by Country, 2018 to 2033

Table 14: Latin America Market Value (US$ Million) Forecast by Component, 2018 to 2033

Table 15: Latin America Market Value (US$ Million) Forecast by Deployment Mode, 2018 to 2033

Table 16: Latin America Market Value (US$ Million) Forecast by Enterprise Size , 2018 to 2033

Table 17: Latin America Market Value (US$ Million) Forecast by Application, 2018 to 2033

Table 18: Latin America Market Value (US$ Million) Forecast by End-User, 2018 to 2033

Table 19: Europe Market Value (US$ Million) Forecast by Country, 2018 to 2033

Table 20: Europe Market Value (US$ Million) Forecast by Component, 2018 to 2033

Table 21: Europe Market Value (US$ Million) Forecast by Deployment Mode, 2018 to 2033

Table 22: Europe Market Value (US$ Million) Forecast by Enterprise Size , 2018 to 2033

Table 23: Europe Market Value (US$ Million) Forecast by Application, 2018 to 2033

Table 24: Europe Market Value (US$ Million) Forecast by End-User, 2018 to 2033

Table 25: South Asia Market Value (US$ Million) Forecast by Country, 2018 to 2033

Table 26: South Asia Market Value (US$ Million) Forecast by Component, 2018 to 2033

Table 27: South Asia Market Value (US$ Million) Forecast by Deployment Mode, 2018 to 2033

Table 28: South Asia Market Value (US$ Million) Forecast by Enterprise Size , 2018 to 2033

Table 29: South Asia Market Value (US$ Million) Forecast by Application, 2018 to 2033

Table 30: South Asia Market Value (US$ Million) Forecast by End-User, 2018 to 2033

Table 31: East Asia Market Value (US$ Million) Forecast by Country, 2018 to 2033

Table 32: East Asia Market Value (US$ Million) Forecast by Component, 2018 to 2033

Table 33: East Asia Market Value (US$ Million) Forecast by Deployment Mode, 2018 to 2033

Table 34: East Asia Market Value (US$ Million) Forecast by Enterprise Size , 2018 to 2033

Table 35: East Asia Market Value (US$ Million) Forecast by Application, 2018 to 2033

Table 36: East Asia Market Value (US$ Million) Forecast by End-User, 2018 to 2033

Table 37: Oceania Market Value (US$ Million) Forecast by Country, 2018 to 2033

Table 38: Oceania Market Value (US$ Million) Forecast by Component, 2018 to 2033

Table 39: Oceania Market Value (US$ Million) Forecast by Deployment Mode, 2018 to 2033

Table 40: Oceania Market Value (US$ Million) Forecast by Enterprise Size , 2018 to 2033

Table 41: Oceania Market Value (US$ Million) Forecast by Application, 2018 to 2033

Table 42: Oceania Market Value (US$ Million) Forecast by End-User, 2018 to 2033

Table 43: MEA Market Value (US$ Million) Forecast by Country, 2018 to 2033

Table 44: MEA Market Value (US$ Million) Forecast by Component, 2018 to 2033

Table 45: MEA Market Value (US$ Million) Forecast by Deployment Mode, 2018 to 2033

Table 46: MEA Market Value (US$ Million) Forecast by Enterprise Size , 2018 to 2033

Table 47: MEA Market Value (US$ Million) Forecast by Application, 2018 to 2033

Table 48: MEA Market Value (US$ Million) Forecast by End-User, 2018 to 2033
Sudip Saha
Sudip Saha

Principal Consultant

Talk to Analyst

Find your sweet spots for generating winning opportunities in this market.

List of Charts

Figure 1: Global Market Value (US$ Million) by Component, 2023 to 2033

Figure 2: Global Market Value (US$ Million) by Deployment Mode, 2023 to 2033

Figure 3: Global Market Value (US$ Million) by Enterprise Size , 2023 to 2033

Figure 4: Global Market Value (US$ Million) by Application, 2023 to 2033

Figure 5: Global Market Value (US$ Million) by End-User, 2023 to 2033

Figure 6: Global Market Value (US$ Million) by Region, 2023 to 2033

Figure 7: Global Market Value (US$ Million) Analysis by Region, 2018 to 2033

Figure 8: Global Market Value Share (%) and BPS Analysis by Region, 2023 to 2033

Figure 9: Global Market Y-o-Y Growth (%) Projections by Region, 2023 to 2033

Figure 10: Global Market Value (US$ Million) Analysis by Component, 2018 to 2033

Figure 11: Global Market Value Share (%) and BPS Analysis by Component, 2023 to 2033

Figure 12: Global Market Y-o-Y Growth (%) Projections by Component, 2023 to 2033

Figure 13: Global Market Value (US$ Million) Analysis by Deployment Mode, 2018 to 2033

Figure 14: Global Market Value Share (%) and BPS Analysis by Deployment Mode, 2023 to 2033

Figure 15: Global Market Y-o-Y Growth (%) Projections by Deployment Mode, 2023 to 2033

Figure 16: Global Market Value (US$ Million) Analysis by Enterprise Size , 2018 to 2033

Figure 17: Global Market Value Share (%) and BPS Analysis by Enterprise Size , 2023 to 2033

Figure 18: Global Market Y-o-Y Growth (%) Projections by Enterprise Size , 2023 to 2033

Figure 19: Global Market Value (US$ Million) Analysis by Application, 2018 to 2033

Figure 20: Global Market Value Share (%) and BPS Analysis by Application, 2023 to 2033

Figure 21: Global Market Y-o-Y Growth (%) Projections by Application, 2023 to 2033

Figure 22: Global Market Value (US$ Million) Analysis by End-User, 2018 to 2033

Figure 23: Global Market Value Share (%) and BPS Analysis by End-User, 2023 to 2033

Figure 24: Global Market Y-o-Y Growth (%) Projections by End-User, 2023 to 2033

Figure 25: Global Market Attractiveness by Component, 2023 to 2033

Figure 26: Global Market Attractiveness by Deployment Mode, 2023 to 2033

Figure 27: Global Market Attractiveness by Enterprise Size , 2023 to 2033

Figure 28: Global Market Attractiveness by Application, 2023 to 2033

Figure 29: Global Market Attractiveness by End-User, 2023 to 2033

Figure 30: Global Market Attractiveness by Region, 2023 to 2033

Figure 31: North America Market Value (US$ Million) by Component, 2023 to 2033

Figure 32: North America Market Value (US$ Million) by Deployment Mode, 2023 to 2033

Figure 33: North America Market Value (US$ Million) by Enterprise Size , 2023 to 2033

Figure 34: North America Market Value (US$ Million) by Application, 2023 to 2033

Figure 35: North America Market Value (US$ Million) by End-User, 2023 to 2033

Figure 36: North America Market Value (US$ Million) by Country, 2023 to 2033

Figure 37: North America Market Value (US$ Million) Analysis by Country, 2018 to 2033

Figure 38: North America Market Value Share (%) and BPS Analysis by Country, 2023 to 2033

Figure 39: North America Market Y-o-Y Growth (%) Projections by Country, 2023 to 2033

Figure 40: North America Market Value (US$ Million) Analysis by Component, 2018 to 2033

Figure 41: North America Market Value Share (%) and BPS Analysis by Component, 2023 to 2033

Figure 42: North America Market Y-o-Y Growth (%) Projections by Component, 2023 to 2033

Figure 43: North America Market Value (US$ Million) Analysis by Deployment Mode, 2018 to 2033

Figure 44: North America Market Value Share (%) and BPS Analysis by Deployment Mode, 2023 to 2033

Figure 45: North America Market Y-o-Y Growth (%) Projections by Deployment Mode, 2023 to 2033

Figure 46: North America Market Value (US$ Million) Analysis by Enterprise Size , 2018 to 2033

Figure 47: North America Market Value Share (%) and BPS Analysis by Enterprise Size , 2023 to 2033

Figure 48: North America Market Y-o-Y Growth (%) Projections by Enterprise Size , 2023 to 2033

Figure 49: North America Market Value (US$ Million) Analysis by Application, 2018 to 2033

Figure 50: North America Market Value Share (%) and BPS Analysis by Application, 2023 to 2033

Figure 51: North America Market Y-o-Y Growth (%) Projections by Application, 2023 to 2033

Figure 52: North America Market Value (US$ Million) Analysis by End-User, 2018 to 2033

Figure 53: North America Market Value Share (%) and BPS Analysis by End-User, 2023 to 2033

Figure 54: North America Market Y-o-Y Growth (%) Projections by End-User, 2023 to 2033

Figure 55: North America Market Attractiveness by Component, 2023 to 2033

Figure 56: North America Market Attractiveness by Deployment Mode, 2023 to 2033

Figure 57: North America Market Attractiveness by Enterprise Size , 2023 to 2033

Figure 58: North America Market Attractiveness by Application, 2023 to 2033

Figure 59: North America Market Attractiveness by End-User, 2023 to 2033

Figure 60: North America Market Attractiveness by Country, 2023 to 2033

Figure 61: Latin America Market Value (US$ Million) by Component, 2023 to 2033

Figure 62: Latin America Market Value (US$ Million) by Deployment Mode, 2023 to 2033

Figure 63: Latin America Market Value (US$ Million) by Enterprise Size , 2023 to 2033

Figure 64: Latin America Market Value (US$ Million) by Application, 2023 to 2033

Figure 65: Latin America Market Value (US$ Million) by End-User, 2023 to 2033

Figure 66: Latin America Market Value (US$ Million) by Country, 2023 to 2033

Figure 67: Latin America Market Value (US$ Million) Analysis by Country, 2018 to 2033

Figure 68: Latin America Market Value Share (%) and BPS Analysis by Country, 2023 to 2033

Figure 69: Latin America Market Y-o-Y Growth (%) Projections by Country, 2023 to 2033

Figure 70: Latin America Market Value (US$ Million) Analysis by Component, 2018 to 2033

Figure 71: Latin America Market Value Share (%) and BPS Analysis by Component, 2023 to 2033

Figure 72: Latin America Market Y-o-Y Growth (%) Projections by Component, 2023 to 2033

Figure 73: Latin America Market Value (US$ Million) Analysis by Deployment Mode, 2018 to 2033

Figure 74: Latin America Market Value Share (%) and BPS Analysis by Deployment Mode, 2023 to 2033

Figure 75: Latin America Market Y-o-Y Growth (%) Projections by Deployment Mode, 2023 to 2033

Figure 76: Latin America Market Value (US$ Million) Analysis by Enterprise Size , 2018 to 2033

Figure 77: Latin America Market Value Share (%) and BPS Analysis by Enterprise Size , 2023 to 2033

Figure 78: Latin America Market Y-o-Y Growth (%) Projections by Enterprise Size , 2023 to 2033

Figure 79: Latin America Market Value (US$ Million) Analysis by Application, 2018 to 2033

Figure 80: Latin America Market Value Share (%) and BPS Analysis by Application, 2023 to 2033

Figure 81: Latin America Market Y-o-Y Growth (%) Projections by Application, 2023 to 2033

Figure 82: Latin America Market Value (US$ Million) Analysis by End-User, 2018 to 2033

Figure 83: Latin America Market Value Share (%) and BPS Analysis by End-User, 2023 to 2033

Figure 84: Latin America Market Y-o-Y Growth (%) Projections by End-User, 2023 to 2033

Figure 85: Latin America Market Attractiveness by Component, 2023 to 2033

Figure 86: Latin America Market Attractiveness by Deployment Mode, 2023 to 2033

Figure 87: Latin America Market Attractiveness by Enterprise Size , 2023 to 2033

Figure 88: Latin America Market Attractiveness by Application, 2023 to 2033

Figure 89: Latin America Market Attractiveness by End-User, 2023 to 2033

Figure 90: Latin America Market Attractiveness by Country, 2023 to 2033

Figure 91: Europe Market Value (US$ Million) by Component, 2023 to 2033

Figure 92: Europe Market Value (US$ Million) by Deployment Mode, 2023 to 2033

Figure 93: Europe Market Value (US$ Million) by Enterprise Size , 2023 to 2033

Figure 94: Europe Market Value (US$ Million) by Application, 2023 to 2033

Figure 95: Europe Market Value (US$ Million) by End-User, 2023 to 2033

Figure 96: Europe Market Value (US$ Million) by Country, 2023 to 2033

Figure 97: Europe Market Value (US$ Million) Analysis by Country, 2018 to 2033

Figure 98: Europe Market Value Share (%) and BPS Analysis by Country, 2023 to 2033

Figure 99: Europe Market Y-o-Y Growth (%) Projections by Country, 2023 to 2033

Figure 100: Europe Market Value (US$ Million) Analysis by Component, 2018 to 2033

Figure 101: Europe Market Value Share (%) and BPS Analysis by Component, 2023 to 2033

Figure 102: Europe Market Y-o-Y Growth (%) Projections by Component, 2023 to 2033

Figure 103: Europe Market Value (US$ Million) Analysis by Deployment Mode, 2018 to 2033

Figure 104: Europe Market Value Share (%) and BPS Analysis by Deployment Mode, 2023 to 2033

Figure 105: Europe Market Y-o-Y Growth (%) Projections by Deployment Mode, 2023 to 2033

Figure 106: Europe Market Value (US$ Million) Analysis by Enterprise Size , 2018 to 2033

Figure 107: Europe Market Value Share (%) and BPS Analysis by Enterprise Size , 2023 to 2033

Figure 108: Europe Market Y-o-Y Growth (%) Projections by Enterprise Size , 2023 to 2033

Figure 109: Europe Market Value (US$ Million) Analysis by Application, 2018 to 2033

Figure 110: Europe Market Value Share (%) and BPS Analysis by Application, 2023 to 2033

Figure 111: Europe Market Y-o-Y Growth (%) Projections by Application, 2023 to 2033

Figure 112: Europe Market Value (US$ Million) Analysis by End-User, 2018 to 2033

Figure 113: Europe Market Value Share (%) and BPS Analysis by End-User, 2023 to 2033

Figure 114: Europe Market Y-o-Y Growth (%) Projections by End-User, 2023 to 2033

Figure 115: Europe Market Attractiveness by Component, 2023 to 2033

Figure 116: Europe Market Attractiveness by Deployment Mode, 2023 to 2033

Figure 117: Europe Market Attractiveness by Enterprise Size , 2023 to 2033

Figure 118: Europe Market Attractiveness by Application, 2023 to 2033

Figure 119: Europe Market Attractiveness by End-User, 2023 to 2033

Figure 120: Europe Market Attractiveness by Country, 2023 to 2033

Figure 121: South Asia Market Value (US$ Million) by Component, 2023 to 2033

Figure 122: South Asia Market Value (US$ Million) by Deployment Mode, 2023 to 2033

Figure 123: South Asia Market Value (US$ Million) by Enterprise Size , 2023 to 2033

Figure 124: South Asia Market Value (US$ Million) by Application, 2023 to 2033

Figure 125: South Asia Market Value (US$ Million) by End-User, 2023 to 2033

Figure 126: South Asia Market Value (US$ Million) by Country, 2023 to 2033

Figure 127: South Asia Market Value (US$ Million) Analysis by Country, 2018 to 2033

Figure 128: South Asia Market Value Share (%) and BPS Analysis by Country, 2023 to 2033

Figure 129: South Asia Market Y-o-Y Growth (%) Projections by Country, 2023 to 2033

Figure 130: South Asia Market Value (US$ Million) Analysis by Component, 2018 to 2033

Figure 131: South Asia Market Value Share (%) and BPS Analysis by Component, 2023 to 2033

Figure 132: South Asia Market Y-o-Y Growth (%) Projections by Component, 2023 to 2033

Figure 133: South Asia Market Value (US$ Million) Analysis by Deployment Mode, 2018 to 2033

Figure 134: South Asia Market Value Share (%) and BPS Analysis by Deployment Mode, 2023 to 2033

Figure 135: South Asia Market Y-o-Y Growth (%) Projections by Deployment Mode, 2023 to 2033

Figure 136: South Asia Market Value (US$ Million) Analysis by Enterprise Size , 2018 to 2033

Figure 137: South Asia Market Value Share (%) and BPS Analysis by Enterprise Size , 2023 to 2033

Figure 138: South Asia Market Y-o-Y Growth (%) Projections by Enterprise Size , 2023 to 2033

Figure 139: South Asia Market Value (US$ Million) Analysis by Application, 2018 to 2033

Figure 140: South Asia Market Value Share (%) and BPS Analysis by Application, 2023 to 2033

Figure 141: South Asia Market Y-o-Y Growth (%) Projections by Application, 2023 to 2033

Figure 142: South Asia Market Value (US$ Million) Analysis by End-User, 2018 to 2033

Figure 143: South Asia Market Value Share (%) and BPS Analysis by End-User, 2023 to 2033

Figure 144: South Asia Market Y-o-Y Growth (%) Projections by End-User, 2023 to 2033

Figure 145: South Asia Market Attractiveness by Component, 2023 to 2033

Figure 146: South Asia Market Attractiveness by Deployment Mode, 2023 to 2033

Figure 147: South Asia Market Attractiveness by Enterprise Size , 2023 to 2033

Figure 148: South Asia Market Attractiveness by Application, 2023 to 2033

Figure 149: South Asia Market Attractiveness by End-User, 2023 to 2033

Figure 150: South Asia Market Attractiveness by Country, 2023 to 2033

Figure 151: East Asia Market Value (US$ Million) by Component, 2023 to 2033

Figure 152: East Asia Market Value (US$ Million) by Deployment Mode, 2023 to 2033

Figure 153: East Asia Market Value (US$ Million) by Enterprise Size , 2023 to 2033

Figure 154: East Asia Market Value (US$ Million) by Application, 2023 to 2033

Figure 155: East Asia Market Value (US$ Million) by End-User, 2023 to 2033

Figure 156: East Asia Market Value (US$ Million) by Country, 2023 to 2033

Figure 157: East Asia Market Value (US$ Million) Analysis by Country, 2018 to 2033

Figure 158: East Asia Market Value Share (%) and BPS Analysis by Country, 2023 to 2033

Figure 159: East Asia Market Y-o-Y Growth (%) Projections by Country, 2023 to 2033

Figure 160: East Asia Market Value (US$ Million) Analysis by Component, 2018 to 2033

Figure 161: East Asia Market Value Share (%) and BPS Analysis by Component, 2023 to 2033

Figure 162: East Asia Market Y-o-Y Growth (%) Projections by Component, 2023 to 2033

Figure 163: East Asia Market Value (US$ Million) Analysis by Deployment Mode, 2018 to 2033

Figure 164: East Asia Market Value Share (%) and BPS Analysis by Deployment Mode, 2023 to 2033

Figure 165: East Asia Market Y-o-Y Growth (%) Projections by Deployment Mode, 2023 to 2033

Figure 166: East Asia Market Value (US$ Million) Analysis by Enterprise Size , 2018 to 2033

Figure 167: East Asia Market Value Share (%) and BPS Analysis by Enterprise Size , 2023 to 2033

Figure 168: East Asia Market Y-o-Y Growth (%) Projections by Enterprise Size , 2023 to 2033

Figure 169: East Asia Market Value (US$ Million) Analysis by Application, 2018 to 2033

Figure 170: East Asia Market Value Share (%) and BPS Analysis by Application, 2023 to 2033

Figure 171: East Asia Market Y-o-Y Growth (%) Projections by Application, 2023 to 2033

Figure 172: East Asia Market Value (US$ Million) Analysis by End-User, 2018 to 2033

Figure 173: East Asia Market Value Share (%) and BPS Analysis by End-User, 2023 to 2033

Figure 174: East Asia Market Y-o-Y Growth (%) Projections by End-User, 2023 to 2033

Figure 175: East Asia Market Attractiveness by Component, 2023 to 2033

Figure 176: East Asia Market Attractiveness by Deployment Mode, 2023 to 2033

Figure 177: East Asia Market Attractiveness by Enterprise Size , 2023 to 2033

Figure 178: East Asia Market Attractiveness by Application, 2023 to 2033

Figure 179: East Asia Market Attractiveness by End-User, 2023 to 2033

Figure 180: East Asia Market Attractiveness by Country, 2023 to 2033

Figure 181: Oceania Market Value (US$ Million) by Component, 2023 to 2033

Figure 182: Oceania Market Value (US$ Million) by Deployment Mode, 2023 to 2033

Figure 183: Oceania Market Value (US$ Million) by Enterprise Size , 2023 to 2033

Figure 184: Oceania Market Value (US$ Million) by Application, 2023 to 2033

Figure 185: Oceania Market Value (US$ Million) by End-User, 2023 to 2033

Figure 186: Oceania Market Value (US$ Million) by Country, 2023 to 2033

Figure 187: Oceania Market Value (US$ Million) Analysis by Country, 2018 to 2033

Figure 188: Oceania Market Value Share (%) and BPS Analysis by Country, 2023 to 2033

Figure 189: Oceania Market Y-o-Y Growth (%) Projections by Country, 2023 to 2033

Figure 190: Oceania Market Value (US$ Million) Analysis by Component, 2018 to 2033

Figure 191: Oceania Market Value Share (%) and BPS Analysis by Component, 2023 to 2033

Figure 192: Oceania Market Y-o-Y Growth (%) Projections by Component, 2023 to 2033

Figure 193: Oceania Market Value (US$ Million) Analysis by Deployment Mode, 2018 to 2033

Figure 194: Oceania Market Value Share (%) and BPS Analysis by Deployment Mode, 2023 to 2033

Figure 195: Oceania Market Y-o-Y Growth (%) Projections by Deployment Mode, 2023 to 2033

Figure 196: Oceania Market Value (US$ Million) Analysis by Enterprise Size , 2018 to 2033

Figure 197: Oceania Market Value Share (%) and BPS Analysis by Enterprise Size , 2023 to 2033

Figure 198: Oceania Market Y-o-Y Growth (%) Projections by Enterprise Size , 2023 to 2033

Figure 199: Oceania Market Value (US$ Million) Analysis by Application, 2018 to 2033

Figure 200: Oceania Market Value Share (%) and BPS Analysis by Application, 2023 to 2033

Figure 201: Oceania Market Y-o-Y Growth (%) Projections by Application, 2023 to 2033

Figure 202: Oceania Market Value (US$ Million) Analysis by End-User, 2018 to 2033

Figure 203: Oceania Market Value Share (%) and BPS Analysis by End-User, 2023 to 2033

Figure 204: Oceania Market Y-o-Y Growth (%) Projections by End-User, 2023 to 2033

Figure 205: Oceania Market Attractiveness by Component, 2023 to 2033

Figure 206: Oceania Market Attractiveness by Deployment Mode, 2023 to 2033

Figure 207: Oceania Market Attractiveness by Enterprise Size , 2023 to 2033

Figure 208: Oceania Market Attractiveness by Application, 2023 to 2033

Figure 209: Oceania Market Attractiveness by End-User, 2023 to 2033

Figure 210: Oceania Market Attractiveness by Country, 2023 to 2033

Figure 211: MEA Market Value (US$ Million) by Component, 2023 to 2033

Figure 212: MEA Market Value (US$ Million) by Deployment Mode, 2023 to 2033

Figure 213: MEA Market Value (US$ Million) by Enterprise Size , 2023 to 2033

Figure 214: MEA Market Value (US$ Million) by Application, 2023 to 2033

Figure 215: MEA Market Value (US$ Million) by End-User, 2023 to 2033

Figure 216: MEA Market Value (US$ Million) by Country, 2023 to 2033

Figure 217: MEA Market Value (US$ Million) Analysis by Country, 2018 to 2033

Figure 218: MEA Market Value Share (%) and BPS Analysis by Country, 2023 to 2033

Figure 219: MEA Market Y-o-Y Growth (%) Projections by Country, 2023 to 2033

Figure 220: MEA Market Value (US$ Million) Analysis by Component, 2018 to 2033

Figure 221: MEA Market Value Share (%) and BPS Analysis by Component, 2023 to 2033

Figure 222: MEA Market Y-o-Y Growth (%) Projections by Component, 2023 to 2033

Figure 223: MEA Market Value (US$ Million) Analysis by Deployment Mode, 2018 to 2033

Figure 224: MEA Market Value Share (%) and BPS Analysis by Deployment Mode, 2023 to 2033

Figure 225: MEA Market Y-o-Y Growth (%) Projections by Deployment Mode, 2023 to 2033

Figure 226: MEA Market Value (US$ Million) Analysis by Enterprise Size , 2018 to 2033

Figure 227: MEA Market Value Share (%) and BPS Analysis by Enterprise Size , 2023 to 2033

Figure 228: MEA Market Y-o-Y Growth (%) Projections by Enterprise Size , 2023 to 2033

Figure 229: MEA Market Value (US$ Million) Analysis by Application, 2018 to 2033

Figure 230: MEA Market Value Share (%) and BPS Analysis by Application, 2023 to 2033

Figure 231: MEA Market Y-o-Y Growth (%) Projections by Application, 2023 to 2033

Figure 232: MEA Market Value (US$ Million) Analysis by End-User, 2018 to 2033

Figure 233: MEA Market Value Share (%) and BPS Analysis by End-User, 2023 to 2033

Figure 234: MEA Market Y-o-Y Growth (%) Projections by End-User, 2023 to 2033

Figure 235: MEA Market Attractiveness by Component, 2023 to 2033

Figure 236: MEA Market Attractiveness by Deployment Mode, 2023 to 2033

Figure 237: MEA Market Attractiveness by Enterprise Size , 2023 to 2033

Figure 238: MEA Market Attractiveness by Application, 2023 to 2033

Figure 239: MEA Market Attractiveness by End-User, 2023 to 2033

Figure 240: MEA Market Attractiveness by Country, 2023 to 2033

Recommendations

Technology

Sensor Data Analytics Market

Published : June 2022

Explore Technology Insights

View Reports

Data Science Platform Market