Reports

- Global Locations -

Headquarters

Future Market Insights, Inc.

Christiana Corporate, 200
Continental Drive, Suite 401,
Newark, Delaware - 19713,
United States

T: +1-845-579-5705

Americas

Future Market Insights, Inc.

616 Corporate Way, Suite 2-9018,
Valley Cottage, NY 10989, United States

T: +1-347-918-3531

MEA

Future Market Insights

1602-6 Jumeirah Bay X2 Tower, Plot No: JLT-PH2-X2A,
Jumeirah Lakes Towers, Dubai,
United Arab Emirates

Europe

Future Market Insights

3rd Floor, 207 Regent Street,
W1B 3HH London
United Kingdom

T: + 44 (0) 20 8123 9659
D: +44 (0) 20 3287 4268

Asia Pacific

Future Market Insights

IndiaLand Global Tech Park, Unit UG-1, Behind Grand HighStreet, Phase 1, Hinjawadi, MH, Pune – 411057, India

Data Center Infrastructure Management Market (2022 to 2032)

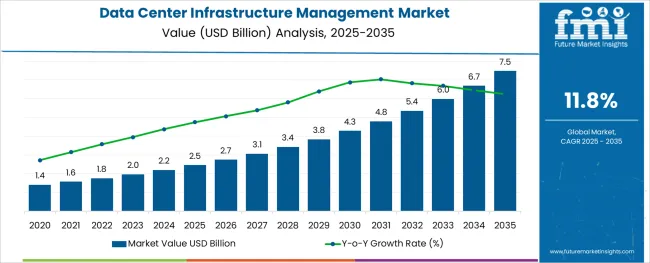
[315 Pages Report] The data center infrastructure management revenue totaled US$ 1.8 Billion in 2021. The market is expected to reach US$ 5.6 Billion by 2032, exhibiting growth at 10.7% CAGR between 2022 and 2032. As of 2022, the market is likely to reach US$ 2 Billion, exhibiting a Y-o-Y incline of 11.1% from 2021.

As businesses strive to reduce problems and security breaches, they are embracing smart and dynamic infrastructures, which is expected to fuel growth in the DCIM market.

Attributes Details
Data Center Infrastructure Management Market CAGR (2022 to 2032) 10.7%
Data Center Infrastructure Management Market Size (2022) US$ 2 Billion
Data Center Infrastructure Management Market Size (2032) US$ 5.6 Billion

Colocation sites and data centers are undergoing digital transformation, which transforms IT layouts and increases complexity. A virtual replica, or a digital twin of the infrastructure, is being created by operators so that they can stay on top of the markets. Data center management procedures and tools enable a data center to fulfill its service delivery responsibilities more efficiently, such as managing asset configurations and changes, tracking asset associations and records, and analyzing connectivity and ports.

In order to transform business functions, increase data center capacity, and reduce the cost of data centers in addition to assessing the efficacy and performance of data center operations, data center infrastructure management has become an increasingly important function. DCIM solutions will become more popular with the increase in energy consumption resulting from the continuous operation of the data center. As a result, it is expected that the market for DCIM solutions is set to increase, as a result of the increasing influence of regulatory norms on data centers.

Don't pay for what you don't need

Customize your report by selecting specific countries or regions and save 30%!

How will the Data Center Infrastructure Management Market grow in the Coming Years?

The demand for robust IT infrastructure management solutions for data handling and storage has grown across industry verticals, such as manufacturing, retail, healthcare, and BFSI. Consequently, the demand for DCIM solutions is likely to increase with the increase in demand for data center infrastructure management initiatives that will help operators achieve maximum throughput and operational efficiency in data centers.

Other factors contributing to the growth of the market are the growing number of edge data centers that address the low latency requirements of some applications. The traditional data center network operations center still plays an important role, but due to the growth in cloud adoption, the approach to managing data centers and cloud services will change to ensure an end-to-end process in the market. Software-defined data centers are predicted to replace traditional methods for managing data centers, regardless of the size of the facility.

RFID technology streamlines the management of physical assets within DCIM. Successful DCIM provides an organization with a competitive edge and is a vital component of corporate success. In a data center management system, monitoring different parameters, including server and computer performance, network performance, and security risks, is used to gain visibility and insights, and to resolve network problems as they arise. Due to these factors, DCIM solutions are becoming more and more necessary for organizations in order to assist in improving decision-making processes, ensure data centers operate at peak efficiency, and improve decision-making.

Data Center Infrastructure Management Market

Digitalization and other innovative technologies in various end-use applications have been enhancing market growth mainly through the development of e-commerce. A growing need to manage limited space and high rack density, which helps drive the market, is also a result of increased work-from-home policies to prevent IT system failure.

What Challenges are in store for the Data Center Infrastructure Management Market?

Integrating Real-Time Devices into an Operations Data Center is a complex process

DCIM has developed into a major software solution for infrastructure optimization. In addition to successfully implementing DCIM in several companies, there are numerous organizations that have reported the failure of their DCIM implementations as well. DCIM providers fail to deliver what customers expect, which is a major reason behind the unsuccessful implementations of DCIM in the market. DCIM implementation can be complicated for data centers with a number of functional domains.

COVID-19 has posed a challenge to the construction of new data centers due to the threat posed by the infection. Most vendors have delayed or canceled their projects or activities which could increase the possibility of an infection in the near future. The possibility of business interruptions due to software installation failures has hindered the growth of the market. A lack of trained professionals and high initial expenses can dampen the growth of the market. Insufficient tools and approaches to deal with the synchronization issues that affect virtualized automation are restricting the market's growth.

As data center management costs and demands rise, data center managers often face challenges maintaining the optimum level of efficiency as well as utilization of the data center in the market. The market isn't growing as fast as it should due to a lack of tools that make virtual automation synchronize with physical infrastructure. DCIM faces a growing number of challenges as a result of the proliferation of technologies, the ever-changing business environment, the economic conditions in which they operate, and regulatory compliance. Amongst other challenges, the market faces capacity constraints, a lack of knowledge on energy consumption, network capacity limitations, and dealing with budgets for energy use, among others.

Sudip Saha
Sudip Saha

Principal Consultant

Talk to Analyst

Find your sweet spots for generating winning opportunities in this market.

Comparative View of Data Center Infrastructure Management Market

Data Center Infrastructure Management Market:

Attributes Data Center Infrastructure Management Market
CAGR (2022 to 2032) 10.7%
Market Value (2032) US$ 3.2 Billion
Growth Factor The IP traffic in data centers is likely to increase in the forecast period, which is ultimately expected to lead to an increase in the market for data center infrastructure management.
Opportunity The continuing expansion of DCIM systems as well as customized DCIM systems for unique customer requirements, combined with the ability to configure and install without minimum-quantity restrictions, are presenting new opportunities to the DCIM industry.
Key Trends DCIM platforms support secure remote network access from remote locations, enabling employees to carry out their work from anywhere in the world. These advanced platforms support the development of hosting technologies for remote access via secure IP networks.

Data Center Power Management Market:

Attributes Data Center Power Management Market
CAGR (2022 to 2032) 16.3%
Market Value (2032) US$ 37.3 Billion
Growth Factor With the proliferation of smart devices, mobile data is increasing tremendously. As the amount of data is increasing, technologies such as 5G, the Internet of Things (IoT), and connected systems are also contributing to this surge in data.
Opportunity While processing such high amounts of data, data center managers are upgrading their power efficiency in order to maintain profitability, which is expected to improve demand in the future.
Key Trends There is strong interest in hyper-scale data centers, the use of renewable energies, and the integrated management of data center power across the globe as key trends driving the market.

Data Center Substation Market:

Attributes Data Center Substation Market
CAGR (2022 to 2032) 6.2%
Market Value (2032) US$ 18.2 Billion
Growth Factor Increasing demand for automated and smart electrical power systems that help reduce the footprint of carbon on the environment is acting as a catalyst for growth in the market.
Opportunity Developing new business models and adopting advanced solutions are expected to lead to growth opportunities as Industry 4.0 takes hold.
Key Trends The digitalization of data centers in developing countries is one of the key factors driving the market demand for digital substations. Another driving factor is the growing popularity of digital substations.

With the adoption of networked computing technologies, demand for computing resources has grown at an arbitrary rate. The implementation of DCIM helps to stimulate collaboration between data center buildings and their systems. An increase in demand for sustainable solutions is driven by the virtualization of data centers, enterprise migration to private cloud computing, and reduced energy consumption in data centers, all of which are contributing to the DCIM market's growth.

Using real-time information about the temperature and humidity in the server room, the status of equipment, and the power consumption and air conditioning workload, data center operators can create flexible and efficient operating procedures. Detailed DCIM information allows the detection of problems in real-time before they culminate in a system failure.

A workflow management system that integrates and automates processes helps to enhance productivity in the market. In addition, DCIM software helps data center operators plan and design their infrastructure efficiently and more effectively. Furthermore, DCIM seamlessly links operational information with facility information and IT information to better utilize data centers.

Considering the rapid pace at which the industry releases new technologies, these libraries are routinely updated and maintained as part of a cooperative effort with the vendors. Modern complex networks have an increasing need to manage assets and services within a single management tool regardless of where they are located within organizations for complete transparency across each infrastructure component.

Category Wise Analysis for Data Center Infrastructure Management Market

Which is the Dominant Application area for Data Center Infrastructure Management?

IT Asset Management is predicted to grow substantially

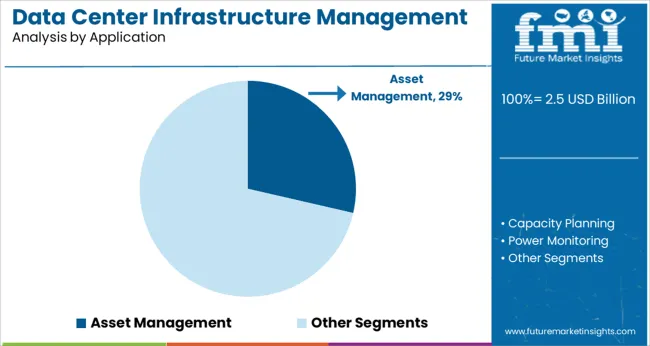
As the IT business continues to grow in the market, demand for data center infrastructure management applications will likely increase in the coming years. In addition to identifying, locating, visualizing, and planning capacity for future growth, the DCIM solution can help data center managers evaluate all data centers' assets as they grow.

The adoption rate of asset management among DCIM will increase at a tremendous rate, with a CAGR of 10.8%. With the increase in complexity of systems, the management of IT assets is becoming increasingly difficult. A large number of small businesses are using pen and paper, spreadsheets, and other methods to track IT assets. Unfortunately, this conventional method is unable to keep up with the rapid development of IT infrastructures.

Which Deployment Model is Most Preferred?

On-Premises Data Center Infrastructure Management to be Most Preferred

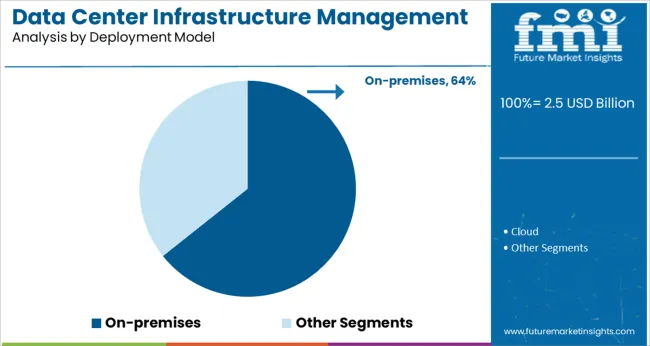
According to deployment type, the market is segmented into cloud and on-premises types. On-premises solutions will contribute the largest share of DCIM market growth during the forecast period. According to the forecast, the market will grow at a CAGR of 10.7%. Using the on-premises DCIM, the data center infrastructure is able to share data across the various sensors.

DCIM solutions for on-premise offer additional benefits for an organization's environment such as data collection, analysis, and alerting that is centralized and consistent. Administrators can use this data to monitor airflow, electricity consumption, temperature, weather, and security.

Get the data you need at a Fraction of the cost

Personalize your report by choosing insights you need
and save 40%!

Region-wise Analysis

What is the opportunity for the Data Center Infrastructure Management Market across North America?

Access to strong network connectivity will allow the North American market to grow in the coming years

In North America, there are many data centers at different locations all around the continent. As a result of the growing significance of energy-efficient data centers in North America, the DCIM is expected to see a growing level of business in the market.

The USA market is expected to grow at a CAGR of 10.5% for DICM during the forecast period. There is a high demand for network management solutions due to the rise in the number of small and medium-sized data centers that are currently operating in the country. In response to the growing demand for DCIM solutions, market players are establishing new facilities in the country to expand their market presence.

IT companies have been growing their revenue size due to the increasing use of mobile devices, big data, and cloud services, which have expanded their business models. As server costs decrease and cloud computing tools gain acceptance, the market is expected to grow in the region in the forecast period.

Will Asia-Pacific Become an Attractive Data Center Infrastructure Management Market in the Future?

Increased IT activities and cloud-based projects to drive growth in developing nations

The Asia Pacific region is expected to be the fastest-growing market for DICM during the forecast period. In the next few years, the data center infrastructure management industry in Asia Pacific is projected to grow largely driven by the implementation of the Internet of Things (IoT) and machine learning by organizations in countries such as Japan, South Korea, Singapore, and China.

The rapid proliferation of network connectivity and wireless communication devices, coupled with the adoption of new technologies, will drive growth in this region during the forecast period. As the DCIM market grows in APAC, several factors contribute to the success of this market. Some of these factors include an increasing Internet penetration rate, a large consumer base, rapid income growth, and technological advancements, all of which further boost the market development for DCIM in APAC.

Growing environmental issues and pollution have propelled the market in China to adopt greener energy the market. To combat the fast-growing industry, the government has implemented legislative guidelines for the data centers market. As a result of the guidelines developed earlier by the Ministry of Industry and Information Technology (MIIT), the National Government Offices Administration, and the National Energy Administration, a new framework has been released in January 2019 to push the industry toward more efficient data centers. It is expected that the DCIM software market in China will grow at a CAGR of 10% over the forecast period.

An increasing number of IT projects and the expansion of data centers in these regions are also driving growth in the DCIM market. For instance, GLP planned for 900MW data center expansion in Japan. The firm also planned to invest $12 billion in this project over the next five years. Japan is expected to grow at a CAGR of 9% over the forecast period. Among the leading technology hubs, South Korea leads the way. As a result of its cutting-edge ICT infrastructure, this country boasts the fastest Internet speeds in the world, creating an ideal environment for global leading electronics and IT companies. As a result of a large number of players participating in the market, the DCIM market is thriving in this region. The South Korean market is expected to grow by 8.3% CAGR over the next few years.

What are the potential growth prospects for the European DCIM market?

Big Data and IoT are expected to drive growth in the UK market

UK data centers generated the largest revenue from the IT infrastructure segment. About 42% of the overall data center market in the UK was accounted for by server infrastructure costs. Market growth for DCIM is projected at 9.7% in the United Kingdom during the forecast period.

Further, the demand for edge computing and edge data centers in the country will increase due to advances in artificial intelligence and the Internet of Things. Data centers in the UK face tough government regulations that require them to reduce their carbon footprint and purchase renewable energy sources to operate. Consumers and businesses in the UK are becoming more reliant on data center services due to the increasing use of cellular devices, improvements in network access, and the rising adoption of new technologies to strengthen the market for DCIM.

Recent Developments in Data Center Infrastructure Management

Manufacturing companies can increase production through strategic partnerships, increasing revenues and market share. End users will reap the benefits of new technologies as new products and technologies are introduced. One of the potential benefits of a strategic partnership is the ability to expand the company's production capabilities.

  • In February 2022, as part of their plans to develop own and operate data centers in India, global alternative asset manager Brookfield Asset Management and digital realities' joint venture BAM Digital Reality have expanded their partnership with Brookfield Infrastructure. BAM Digital Reality has acquired a 10-acre parcel of land in Chennai’s Ambattur locality for over Rs 230 crores, its first direct development of a large data center.
  • Pensando, a startup developing data center chips, was acquired by AMD in April 2022 for US$ 1.9 Billion. The acquisition is expected to be completed by the end of the quarter. The Pensando company will become part of AMD's Data Center Solutions Group upon completion of the acquisition. In expanding its data center business, AMD will benefit from the acquisition of Pensando. As a result of strong demand for AMD's Epyc line of server processors, the business doubled its revenues in the most recent quarter.
  • In May 2022, using a nuclear power plant, Standard Power will build a massive data center in Pennsylvania. Standard Power and Energy Harbor signed a Memorandum of Understanding (MoU) to collaborate on building a large-scale carbon-free data center at Energy Harbor's Beaver Valley nuclear power plant in Shippingport, PA. The partnership will perform a feasibility study for a new data center to determine the best engineering, colocation, and implementation options.
  • In May 2022, DigitalBridge Group Inc. is expected to purchase Switch Inc., an operator of data centers. The talks are still ongoing, and it was still possible the transaction would fall through. Comparatively, DigitalBridge had a market cap of US$ 3.31 Billion, while Switch had a market cap of US$ 7.29 Billion.

By Key Players

  • ABB
  • CommScope
  • Cormant
  • Delta Electronics
  • Device42
  • Eaton
  • FNT Software
  • Graphical Networks
  • GreenField Software
  • Hyperview

Key Segments Covered in the Data Center Infrastructure Management Market Report

By Component:

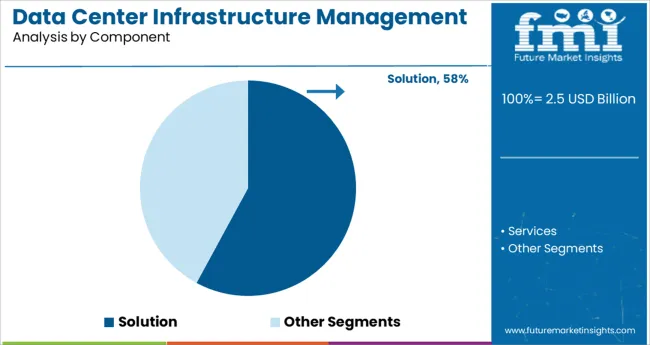
  • Solution
  • Services

By Application:

  • Asset Management
  • Capacity Planning
  • Power Monitoring
  • Environment Monitoring
  • BI and Analytics
  • Others (Automated Workflow and Change Management, and Auditing and Reporting)

By Deployment Model:

  • On-premises
  • Cloud

By Data Center Type:

  • Enterprise Data Center
  • Managed Data Center
  • Colocation Data Center
  • Cloud and Edge Data Center

By Vertical:

  • BFSI
  • Government and Public Sector
  • IT and ITeS
  • Manufacturing
  • Healthcare and Life Science
  • Telecommunications
  • Others (Retail and E-Commerce, Education, and Media and Entertainment)

By Region:

  • North America
  • Europe
  • Asia Pacific
  • Middle East and Africa
  • Latin America

Frequently Asked Questions

What is the growth outlook for the data center infrastructure management market?

The data center infrastructure management market is expected to grow at a steady CAGR of 10.7% over the forecast period

What was the size of the data center infrastructure management market size in 2021?

The global market for data center infrastructure management was valued at US$ 1.8 Billion in 2021

What application type is the most valuable in the data center infrastructure management market?

Asset management is projected to have the highest market with a CAGR of 10.8% during the forecast period

What region dominates the global data center infrastructure management market?

USA leads the global data center infrastructure management market with a CAGR of 10.5% during the forecast period

What will be the market size of data center infrastructure management by 2032?

The market for data center infrastructure management is expected to grow by nearly US$ 5.6 Billion by 2032

Which deployment model type is forecast to drive market growth during the forecast period?

The on-premises are expected to reach a CAGR of 10.7% during the forecast period

What is the estimated market value of the Chinese Market?

China is expected to garner US$ 394.1 Million while expanding at a 10% CAGR from 2022 to 2032.

Table of Content

1. Executive Summary | Data Center Infrastructure Management Market

    1.1. Global Market Outlook

    1.2. Summary of Statistics

    1.3. Key Market Characteristics & Attributes

    1.4. FMI Analysis and Recommendations

2. Market Overview

    2.1. Market Coverage / Taxonomy

    2.2. Market Definition / Scope / Limitations

3. Market Risks and Trends Assessment

    3.1. Risk Assessment

        3.1.1. COVID-19 Crisis and Impact on Demand

        3.1.2. COVID-19 Impact Benchmark with Previous Crisis

        3.1.3. Impact on Market Value (US$ Million)

        3.1.4. Assessment by Key Countries

        3.1.5. Assessment by Key Market Segments

        3.1.6. Action Points and Recommendation for Suppliers

    3.2. Key Trends Impacting the Market

    3.3. Formulation and Product Development Trends

4. Market Background

    4.1. Market, by Key Countries

    4.2. Market Opportunity Assessment (US$ Million)

        4.2.1. Total Available Market

        4.2.2. Serviceable Addressable Market

        4.2.3. Serviceable Obtainable Market

    4.3. Market Scenario Forecast

        4.3.1. Demand in Optimistic Scenario

        4.3.2. Demand in Likely Scenario

        4.3.3. Demand in Conservative Scenario

    4.4. Investment Feasibility Analysis

        4.4.1. Investment in Established Markets

            4.4.1.1. In Short Term

            4.4.1.2. In Long Term

        4.4.2. Investment in Emerging Markets

            4.4.2.1. In Short Term

            4.4.2.2. In Long Term

    4.5. Forecast Factors - Relevance & Impact

        4.5.1. Top Companies Historical Growth

        4.5.2. Growth in Automation, By Country

        4.5.3. Adoption Rate, By Country

    4.6. Market Dynamics

        4.6.1. Market Driving Factors and Impact Assessment

        4.6.2. Prominent Market Challenges and Impact Assessment

        4.6.3. Market Opportunities

        4.6.4. Prominent Trends in the Global Market & Their Impact Assessment

5. Key Success Factors

    5.1. Manufacturers’ Focus on Low Penetration High Growth Markets

    5.2. Banking on with Segments High Incremental Opportunity

    5.3. Peer Benchmarking

6. Global Market Demand Analysis 2015 to 2021 and Forecast, 2022 to 2032

    6.1. Historical Market Analysis, 2015 to 2021

    6.2. Current and Future Market Projections, 2022 to 2032

    6.3. Y-o-Y Growth Trend Analysis

7. Global Market Value Analysis 2015 to 2021 and Forecast, 2022 to 2032

    7.1. Historical Market Value (US$ Million) Analysis, 2015 to 2021

    7.2. Current and Future Market Value (US$ Million) Projections, 2022 to 2032

        7.2.1. Y-o-Y Growth Trend Analysis

        7.2.2. Absolute $ Opportunity Analysis

8. Global Market Analysis 2015 to 2021 and Forecast 2022 to 2032, By Component

    8.1. Introduction / Key Findings

    8.2. Historical Market Value (US$ Million) and Analysis By Component, 2015 to 2021

    8.3. Current and Future Market Value (US$ Million) and Analysis and Forecast By Component, 2022 to 2032

        8.3.1. Solution

        8.3.2. Services

    8.4. Market Attractiveness Analysis By Component

9. Global Market Analysis 2015 to 2021 and Forecast 2022 to 2032, By Application

    9.1. Introduction / Key Findings

    9.2. Historical Market Value (US$ Million) and Analysis By Application, 2015 to 2021

    9.3. Current and Future Market Value (US$ Million) and Analysis and Forecast By Application, 2022 to 2032

        9.3.1. Asset Management

        9.3.2. Capacity Planning

        9.3.3. Power Monitoring

        9.3.4. Environmental Monitoring

        9.3.5. BI and Analytics

        9.3.6. Others (Automated Workflow and Change Management, and Auditing and Reporting)

    9.4. Market Attractiveness Analysis By Application

10. Global Market Analysis 2015 to 2021 and Forecast 2022 to 2032, By Deployment Model

    10.1. Introduction / Key Findings

    10.2. Historical Market Value (US$ Million) and AnalysisBy Deployment Model, 2015 to 2021

    10.3. Current and Future Market Value (US$ Million) and Analysis and ForecastBy Deployment Model, 2022 to 2032

        10.3.1. On-premises

        10.3.2. Cloud

    10.4. Market Attractiveness AnalysisBy Deployment Model

11. Global Market Analysis 2015 to 2021 and Forecast 2022 to 2032, By Data Center Type

    11.1. Introduction / Key Findings

    11.2. Historical Market Value (US$ Million) and Analysis By Data Center Type, 2015 to 2021

    11.3. Current and Future Market Value (US$ Million) and Analysis and Forecast By Data Center Type, 2022 to 2032

        11.3.1. Enterprise Data Center

        11.3.2. Managed Data Center

        11.3.3. Colocation Data Center

        11.3.4. Cloud and Edge Data Center

    11.4. Market Attractiveness Analysis By Data Center Type

12. Global Market Analysis 2015 to 2021 and Forecast 2022 to 2032, By Vertical

    12.1. Introduction / Key Findings

    12.2. Historical Market Value (US$ Million) and Analysis By Vertical, 2015 to 2021

    12.3. Current and Future Market Value (US$ Million) and Analysis and Forecast By Vertical, 2022 to 2032

        12.3.1. BFSI

        12.3.2. Government and Public Sector

        12.3.3. IT and ITeS

        12.3.4. Manufacturing

        12.3.5. Healthcare and Life Sciences

        12.3.6. Telecommunications

        12.3.7. Others (Retail and eCommerce, Education, and Media and Entertainment)

    12.4. Market Attractiveness Analysis By Vertical

13. Global Market Analysis 2015 to 2021 and Forecast 2022 to 2032, By Region

    13.1. Introduction

    13.2. Historical Market Value (US$ Million) and Analysis By Region, 2015 to 2021

    13.3. Current Market Size (US$ Million) & Analysis and Forecast By Region, 2022 to 2032

        13.3.1. North America

        13.3.2. Latin America

        13.3.3. Europe

        13.3.4. Asia Pacific

        13.3.5. Middle East and Africa (MEA)

    13.4. Market Attractiveness Analysis By Region

14. North America Market Analysis 2015 to 2021 and Forecast 2022 to 2032

    14.1. Introduction

    14.2. Pricing Analysis

    14.3. Historical Market Value (US$ Million) and Trend Analysis By Market Taxonomy, 2015 to 2021

    14.4. Market Value (US$ Million) & Forecast By Market Taxonomy, 2022 to 2032

        14.4.1. By Country

            14.4.1.1. United States of America

            14.4.1.2. Canada

            14.4.1.3. Rest of North America

        14.4.2. By Deployment Model

        14.4.3. By Component

        14.4.4. By Application

        14.4.5. By Data Center Type

        14.4.6. By Vertical

    14.5. Market Attractiveness Analysis

        14.5.1. By Country

        14.5.2. By Deployment Model

        14.5.3. By Component

        14.5.4. By Application

        14.5.5. By Data Center Type

        14.5.6. By Vertical

15. Latin America Market Analysis 2015 to 2021 and Forecast 2022 to 2032

    15.1. Introduction

    15.2. Pricing Analysis

    15.3. Historical Market Value (US$ Million) and Trend Analysis By Market Taxonomy, 2015 to 2021

    15.4. Market Value (US$ Million) & Forecast By Market Taxonomy, 2022 to 2032

        15.4.1. By Country

            15.4.1.1. Brazil

            15.4.1.2. Mexico

            15.4.1.3. Rest of Latin America

        15.4.2. By Deployment Model

        15.4.3. By Component

        15.4.4. By Application

        15.4.5. By Data Center Type

        15.4.6. By Vertical

    15.5. Market Attractiveness Analysis

        15.5.1. By Country

        15.5.2. By Deployment Model

        15.5.3. By Component

        15.5.4. By Application

        15.5.5. By Data Center Type

        15.5.6. By Vertical

16. Europe Market Analysis 2015 to 2021 and Forecast 2022 to 2032

    16.1. Introduction

    16.2. Pricing Analysis

    16.3. Historical Market Value (US$ Million) and Trend Analysis By Market Taxonomy, 2015 to 2021

    16.4. Market Value (US$ Million) & Forecast By Market Taxonomy, 2022 to 2032

        16.4.1. By Country

            16.4.1.1. Germany

            16.4.1.2. France

            16.4.1.3. United Kingdom

            16.4.1.4. Italy

            16.4.1.5. Russia

            16.4.1.6. Rest of Europe

        16.4.2. By Deployment Model

        16.4.3. By Component

        16.4.4. By Application

        16.4.5. By Data Center Type

        16.4.6. By Vertical

    16.5. Market Attractiveness Analysis

        16.5.1. By Country

        16.5.2. By Deployment Model

        16.5.3. By Component

        16.5.4. By Application

        16.5.5. By Data Center Type

        16.5.6. By Vertical

17. Asia Pacific Market Analysis 2015 to 2021 and Forecast 2022 to 2032

    17.1. Introduction

    17.2. Pricing Analysis

    17.3. Historical Market Value (US$ Million) and Trend Analysis By Market Taxonomy, 2015 to 2021

    17.4. Market Value (US$ Million) & Forecast By Market Taxonomy, 2022 to 2032

        17.4.1. By Country

            17.4.1.1. China

            17.4.1.2. Japan

            17.4.1.3. South Korea

            17.4.1.4. Rest of Asia Pacific

        17.4.2. By Deployment Model

        17.4.3. By Component

        17.4.4. By Application

        17.4.5. By Data Center Type

        17.4.6. By Vertical

    17.5. Market Attractiveness Analysis

        17.5.1. By Country

        17.5.2. By Deployment Model

        17.5.3. By Component

        17.5.4. By Application

        17.5.5. By Data Center Type

        17.5.6. By Vertical

18. Middle East and Africa Market Analysis 2015 to 2021 and Forecast 2022 to 2032

    18.1. Introduction

    18.2. Pricing Analysis

    18.3. Historical Market Value (US$ Million) and Trend Analysis By Market Taxonomy, 2015 to 2021

    18.4. Market Value (US$ Million) & Forecast By Market Taxonomy, 2022 to 2032

        18.4.1. By Country

            18.4.1.1. GCC Countries

            18.4.1.2. South Africa

            18.4.1.3. Turkey

            18.4.1.4. Rest of Middle East and Africa

        18.4.2. By Deployment Model

        18.4.3. By Component

        18.4.4. By Application

        18.4.5. By Data Center Type

        18.4.6. By Vertical

    18.5. Market Attractiveness Analysis

        18.5.1. By Country

        18.5.2. By Deployment Model

        18.5.3. By Component

        18.5.4. By Application

        18.5.5. By Data Center Type

        18.5.6. By Vertical

19. Key Countries Market Analysis 2015 to 2021 and Forecast 2022 to 2032

    19.1. Introduction

        19.1.1. Market Value Proportion Analysis, By Key Countries

        19.1.2. Global Vs. Country Growth Comparison

    19.2. US Market Analysis

        19.2.1. Value Proportion Analysis by Market Taxonomy

        19.2.2. Value & Analysis and Forecast by Market Taxonomy, 2015 to 2032

            19.2.2.1. By Deployment Model

            19.2.2.2. By Component

            19.2.2.3. By Application

            19.2.2.4. By Data Center Type

            19.2.2.5. By Vertical

    19.3. Canada Market Analysis

        19.3.1. Value Proportion Analysis by Market Taxonomy

        19.3.2. Value & Analysis and Forecast by Market Taxonomy, 2015 to 2032

            19.3.2.1. By Deployment Model

            19.3.2.2. By Component

            19.3.2.3. By Application

            19.3.2.4. By Data Center Type

            19.3.2.5. By Vertical

    19.4. Mexico Market Analysis

        19.4.1. Value Proportion Analysis by Market Taxonomy

        19.4.2. Value & Analysis and Forecast by Market Taxonomy, 2015 to 2032

            19.4.2.1. By Deployment Model

            19.4.2.2. By Component

            19.4.2.3. By Application

            19.4.2.4. By Data Center Type

            19.4.2.5. By Vertical

    19.5. Brazil Market Analysis

        19.5.1. Value Proportion Analysis by Market Taxonomy

        19.5.2. Value & Analysis and Forecast by Market Taxonomy, 2015 to 2032

            19.5.2.1. By Deployment Model

            19.5.2.2. By Component

            19.5.2.3. By Application

            19.5.2.4. By Data Center Type

            19.5.2.5. By Vertical

    19.6. Germany Market Analysis

        19.6.1. Value Proportion Analysis by Market Taxonomy

        19.6.2. Value & Analysis and Forecast by Market Taxonomy, 2015 to 2032

            19.6.2.1. By Deployment Model

            19.6.2.2. By Component

            19.6.2.3. By Application

            19.6.2.4. By Data Center Type

            19.6.2.5. By Vertical

    19.7. France Market Analysis

        19.7.1. Value Proportion Analysis by Market Taxonomy

        19.7.2. Value & Analysis and Forecast by Market Taxonomy, 2015 to 2032

            19.7.2.1. By Deployment Model

            19.7.2.2. By Component

            19.7.2.3. By Application

            19.7.2.4. By Data Center Type

            19.7.2.5. By Vertical

    19.8. Italy Market Analysis

        19.8.1. Value Proportion Analysis by Market Taxonomy

        19.8.2. Value & Analysis and Forecast by Market Taxonomy, 2015 to 2032

            19.8.2.1. By Deployment Model

            19.8.2.2. By Component

            19.8.2.3. By Application

            19.8.2.4. By Data Center Type

            19.8.2.5. By Vertical

    19.9. Russia Market Analysis

        19.9.1. Value Proportion Analysis by Market Taxonomy

        19.9.2. Value & Analysis and Forecast by Market Taxonomy, 2015 to 2032

            19.9.2.1. By Deployment Model

            19.9.2.2. By Component

            19.9.2.3. By Application

            19.9.2.4. By Data Center Type

            19.9.2.5. By Vertical

    19.10. UK Market Analysis

        19.10.1. Value Proportion Analysis by Market Taxonomy

        19.10.2. Value & Analysis and Forecast by Market Taxonomy, 2015 to 2032

            19.10.2.1. By Deployment Model

            19.10.2.2. By Component

            19.10.2.3. By Application

            19.10.2.4. By Data Center Type

            19.10.2.5. By Vertical

    19.11. China Market Analysis

        19.11.1. Value Proportion Analysis by Market Taxonomy

        19.11.2. Value & Analysis and Forecast by Market Taxonomy, 2015 to 2032

            19.11.2.1. By Deployment Model

            19.11.2.2. By Component

            19.11.2.3. By Application

            19.11.2.4. By Data Center Type

            19.11.2.5. By Vertical

    19.12. Japan Market Analysis

        19.12.1. Value Proportion Analysis by Market Taxonomy

        19.12.2. Value & Analysis and Forecast by Market Taxonomy, 2015 to 2032

            19.12.2.1. By Deployment Model

            19.12.2.2. By Component

            19.12.2.3. By Application

            19.12.2.4. By Data Center Type

            19.12.2.5. By Vertical

    19.13. South Korea Market Analysis

        19.13.1. Value Proportion Analysis by Market Taxonomy

        19.13.2. Value & Analysis and Forecast by Market Taxonomy, 2015 to 2032

            19.13.2.1. By Deployment Model

            19.13.2.2. By Component

            19.13.2.3. By Application

            19.13.2.4. By Data Center Type

            19.13.2.5. By Vertical

    19.14. GCC Countries Market Analysis

        19.14.1. Value Proportion Analysis by Market Taxonomy

        19.14.2. Value & Analysis and Forecast by Market Taxonomy, 2015 to 2032

            19.14.2.1. By Deployment Model

            19.14.2.2. By Component

            19.14.2.3. By Application

            19.14.2.4. By Data Center Type

            19.14.2.5. By Vertical

    19.15. South Africa Market Analysis

        19.15.1. Value Proportion Analysis by Market Taxonomy

        19.15.2. Value & Analysis and Forecast by Market Taxonomy, 2015 to 2032

            19.15.2.1. By Deployment Model

            19.15.2.2. By Component

            19.15.2.3. By Application

            19.15.2.4. By Data Center Type

            19.15.2.5. By Vertical

    19.16. Turkey Market Analysis

        19.16.1. Value Proportion Analysis by Market Taxonomy

        19.16.2. Value & Analysis and Forecast by Market Taxonomy, 2015 to 2032

            19.16.2.1. By Deployment Model

            19.16.2.2. By Component

            19.16.2.3. By Application

            19.16.2.4. By Data Center Type

            19.16.2.5. By Vertical

        19.16.3. Competition Landscape and Player Concentration in the Country

20. Market Structure Analysis

    20.1. Market Analysis by Tier of Companies

    20.2. Market Concentration

    20.3. Market Share Analysis of Top Players

    20.4. Market Presence Analysis

        20.4.1. By Regional Footprint of Players

        20.4.2. Product Footprint by Players

21. Competition Analysis

    21.1. Competition Dashboard

    21.2. Competition Benchmarking

    21.3. Competition Deep Dive

        21.3.1. ABB

            21.3.1.1. Overview

            21.3.1.2. Product Portfolio

            21.3.1.3. Sales Footprint

            21.3.1.4. Strategy Overview

        21.3.2. CommScope

            21.3.2.1. Overview

            21.3.2.2. Product Portfolio

            21.3.2.3. Sales Footprint

            21.3.2.4. Strategy Overview

        21.3.3. Cormant

            21.3.3.1. Overview

            21.3.3.2. Product Portfolio

            21.3.3.3. Sales Footprint

            21.3.3.4. Strategy Overview

        21.3.4. Delta Electronics

            21.3.4.1. Overview

            21.3.4.2. Product Portfolio

            21.3.4.3. Sales Footprint

            21.3.4.4. Strategy Overview

        21.3.5. Device42

            21.3.5.1. Overview

            21.3.5.2. Product Portfolio

            21.3.5.3. Sales Footprint

            21.3.5.4. Strategy Overview

        21.3.6. Eaton

            21.3.6.1. Overview

            21.3.6.2. Product Portfolio

            21.3.6.3. Sales Footprint

            21.3.6.4. Strategy Overview

        21.3.7. FNT Software

            21.3.7.1. Overview

            21.3.7.2. Product Portfolio

            21.3.7.3. Sales Footprint

            21.3.7.4. Strategy Overview

        21.3.8. Graphical Networks

            21.3.8.1. Overview

            21.3.8.2. Product Portfolio

            21.3.8.3. Sales Footprint

            21.3.8.4. Strategy Overview

        21.3.9. GreenField Software

            21.3.9.1. Overview

            21.3.9.2. Product Portfolio

            21.3.9.3. Sales Footprint

            21.3.9.4. Strategy Overview

        21.3.10. Hyperview

            21.3.10.1. Overview

            21.3.10.2. Product Portfolio

            21.3.10.3. Sales Footprint

            21.3.10.4. Strategy Overview

22. Assumptions and Acronyms Used

23. Research Methodology

Don't pay for what you don't need

Customize your report by selecting specific countries or regions and save 30%!

List of Tables

Table 1: Global Market Value (US$ Million), By Deployment Model, 2015 to 2021

Table 2: Global Market Value (US$ Million), By Deployment Model, 2022 to 2032

Table 3: Global Market Value (US$ Million), By Component, 2015 to 2021

Table 4: Global Market Value (US$ Million), By Component, 2022 to 2032

Table 5: Global Market Value (US$ Million), By Application, 2015 to 2021

Table 6: Global Market Value (US$ Million), By Application, 2022 to 2032

Table 7: Global Market Value (US$ Million), By Vertical, 2015 to 2021

Table 8: Global Market Value (US$ Million), By Vertical, 2022 to 2032

Table 9: Global Market Value (US$ Million), By Data Center Type, 2015 to 2021

Table 10: Global Market Value (US$ Million), By Data Center Type, 2022 to 2032

Table 11: Global Market, By Region, 2015 to 2021

Table 12: Global Market, By Region, 2022 to 2032

Table 13: North America Market Value (US$ Million), By Deployment Model, 2015 to 2021

Table 14: North America Market Value (US$ Million), By Deployment Model, 2022 to 2032

Table 15: North America Market Value (US$ Million), By Component, 2015 to 2021

Table 16: North America Market Value (US$ Million), By Component, 2022 to 2032

Table 17: North America Market Value (US$ Million), By Application, 2015 to 2021

Table 18: North America Market Value (US$ Million), By Application, 2022 to 2032

Table 19: North America Market Value (US$ Million), By Vertical, 2015 to 2021

Table 20: North America Market Value (US$ Million), By Vertical, 2022 to 2032

Table 21: North America Market Value (US$ Million), By Data Center Type, 2015 to 2021

Table 22: North America Market Value (US$ Million), By Data Center Type, 2022 to 2032

Table 23: North America Market, By Country, 2015 to 2021

Table 24: North America Market, By Country, 2022 to 2032

Table 25: Latin America Market Value (US$ Million), By Deployment Model, 2015 to 2021

Table 26: Latin America Market Value (US$ Million), By Deployment Model, 2022 to 2032

Table 27: Latin America Market Value (US$ Million), By Component, 2015 to 2021

Table 28: Latin America Market Value (US$ Million), By Component, 2022 to 2032

Table 29: Latin America Market Value (US$ Million), By Application, 2015 to 2021

Table 30: Latin America Market Value (US$ Million), By Application, 2022 to 2032

Table 31: Latin America Market Value (US$ Million), By Vertical, 2015 to 2021

Table 32: Latin America Market Value (US$ Million), By Vertical, 2022 to 2032

Table 33: Latin America Market Value (US$ Million), By Data Center Type, 2015 to 2021

Table 34: Latin America Market Value (US$ Million), By Data Center Type, 2022 to 2032

Table 35: Latin America Market, By Country, 2015 to 2021

Table 36: Latin America Market, By Country, 2022 to 2032

Table 37: Europe Market Value (US$ Million), By Deployment Model, 2015 to 2021

Table 38: Europe Market Value (US$ Million), By Deployment Model, 2022 to 2032

Table 39: Europe Market Value (US$ Million), By Component, 2015 to 2021

Table 40: Europe Market Value (US$ Million), By Component, 2022 to 2032

Table 41: Europe Market Value (US$ Million), By Application, 2015 to 2021

Table 42: Europe Market Value (US$ Million), By Application, 2022 to 2032

Table 43: Europe Market Value (US$ Million), By Vertical, 2015 to 2021

Table 44: Europe Market Value (US$ Million), By Vertical, 2022 to 2032

Table 45: Europe Market Value (US$ Million), By Data Center Type, 2015 to 2021

Table 46: Europe Market Value (US$ Million), By Data Center Type, 2022 to 2032

Table 47: Europe Market, By Country, 2015 to 2021

Table 48: Europe Market, By Country, 2022 to 2032

Table 49: Asia Pacific Market Value (US$ Million), By Deployment Model, 2015 to 2021

Table 50: Asia Pacific Market Value (US$ Million), By Deployment Model, 2022 to 2032

Table 51: Asia Pacific Market Value (US$ Million), By Component, 2015 to 2021

Table 52: Asia Pacific Market Value (US$ Million), By Component, 2022 to 2032

Table 53: Asia Pacific Market Value (US$ Million), By Application, 2015 to 2021

Table 54: Asia Pacific Market Value (US$ Million), By Application, 2022 to 2032

Table 55: Asia Pacific Market Value (US$ Million), By Vertical, 2015 to 2021

Table 56: Asia Pacific Market Value (US$ Million), By Vertical, 2022 to 2032

Table 57: Asia Pacific Market Value (US$ Million), By Data Center Type, 2015 to 2021

Table 58: Asia Pacific Market Value (US$ Million), By Data Center Type, 2022 to 2032

Table 59: Asia Pacific Market, By Country, 2015 to 2021

Table 60: Asia Pacific Market, By Country, 2022 to 2032

Table 61: MEA Market Value (US$ Million), By Deployment Model, 2015 to 2021

Table 62: MEA Market Value (US$ Million), By Deployment Model, 2022 to 2032

Table 63: MEA Market Value (US$ Million), By Component, 2015 to 2021

Table 64: MEA Market Value (US$ Million), By Component, 2022 to 2032

Table 65: MEA Market Value (US$ Million), By Application, 2015 to 2021

Table 66: MEA Market Value (US$ Million), By Application, 2022 to 2032

Table 67: MEA Market Value (US$ Million), By Vertical, 2015 to 2021

Table 68: MEA Market Value (US$ Million), By Vertical, 2022 to 2032

Table 69: MEA Market Value (US$ Million), By Data Center Type, 2015 to 2021

Table 70: MEA Market Value (US$ Million), By Data Center Type, 2022 to 2032

Table 71: MEA Market, By Country, 2015 to 2021

Table 72: MEA Market, By Country, 2022 to 2032
Sudip Saha
Sudip Saha

Principal Consultant

Talk to Analyst

Find your sweet spots for generating winning opportunities in this market.

List of Charts

Figure 1: Global Market Value (US$ Million) and Year-on-Year Growth, 2015 to 2032

Figure 2: Global Market Absolute $ Historical Gain (2015 to 2021) and Opportunity (2022 to 2032), US$ Million

Figure 3: Global Market Share, By Deployment Model, 2022 & 2032

Figure 4: Global Market Y-o-Y Growth Projections, By Deployment Model - 2022 to 2032

Figure 5: Global Market Attractiveness Index, By Deployment Model - 2022 to 2032

Figure 6: Global Market Share, By Component, 2022 & 2032

Figure 7: Global Market Y-o-Y Growth Projections, By Component - 2022 to 2032

Figure 8: Global Market Attractiveness Index, By Component - 2022 to 2032

Figure 9: Global Market Share, By Vertical, 2022 & 2032

Figure 10: Global Market Y-o-Y Growth Projections, By Vertical - 2022 to 2032

Figure 11: Global Market Attractiveness Index, By Vertical - 2022 to 2032

Figure 12: Global Market Share, By Application, 2022 & 2032

Figure 13: Global Market Y-o-Y Growth Projections, By Application - 2022 to 2032

Figure 14: Global Market Attractiveness Index, By Application - 2022 to 2032

Figure 15: Global Market Share, By Data Center Type, 2022 & 2032

Figure 16: Global Market Y-o-Y Growth Projections, By Data Center Type - 2022 to 2032

Figure 17: Global Market Attractiveness Index, By Data Center Type - 2022 to 2032

Figure 18: Global Market Share, By Region, 2022 & 2032

Figure 19: Global Market Y-o-Y Growth Projections, By Region - 2022 to 2032

Figure 20: Global Market Attractiveness Index, By Region - 2022 to 2032

Figure 21: North America Market Value (US$ Million) and Year-on-Year Growth, 2015 to 2032

Figure 22: North America Market Absolute $ Historical Gain (2015 to 2021) and Opportunity (2022 to 2032), US$ Million

Figure 23: North America Market Share, By Deployment Model, 2022 & 2032

Figure 24: North America Market Y-o-Y Growth Projections, By Deployment Model - 2022 to 2032

Figure 25: North America Market Attractiveness Index, By Deployment Model - 2022 to 2032

Figure 26: North America Market Share, By Component, 2022 & 2032

Figure 27: North America Market Y-o-Y Growth Projections, By Component - 2022 to 2032

Figure 28: North America Market Attractiveness Index, By Component - 2022 to 2032

Figure 29: North America Market Share, By Vertical, 2022 & 2032

Figure 30: North America Market Y-o-Y Growth Projections, By Vertical - 2022 to 2032

Figure 31: North America Market Attractiveness Index, By Vertical - 2022 to 2032

Figure 32: North America Market Share, By Application, 2022 & 2032

Figure 33: North America Market Y-o-Y Growth Projections, By Application - 2022 to 2032

Figure 34: North America Market Attractiveness Index, By Application - 2022 to 2032

Figure 35: North America Market Share, By Data Center Type, 2022 & 2032

Figure 36: North America Market Y-o-Y Growth Projections, By Data Center Type - 2022 to 2032

Figure 37: North America Market Attractiveness Index, By Data Center Type - 2022 to 2032

Figure 38: North America Market Share, By Country, 2022 & 2032

Figure 39: North America Market Y-o-Y Growth Projections, By Country - 2022 to 2032

Figure 40: North America Market Attractiveness Index, By Country - 2022 to 2032

Figure 41: Latin America Market Value (US$ Million) and Year-on-Year Growth, 2015 to 2032

Figure 42: Latin America Market Absolute $ Historical Gain (2015 to 2021) and Opportunity (2022 to 2032), US$ Million

Figure 43: Latin America Market Share, By Deployment Model, 2022 & 2032

Figure 44: Latin America Market Y-o-Y Growth Projections, By Deployment Model - 2022 to 2032

Figure 45: Latin America Market Attractiveness Index, By Deployment Model - 2022 to 2032

Figure 46: Latin America Market Share, By Component, 2022 & 2032

Figure 47: Latin America Market Y-o-Y Growth Projections, By Component - 2022 to 2032

Figure 48: Latin America Market Attractiveness Index, By Component - 2022 to 2032

Figure 49: Latin America Market Share, By Vertical, 2022 & 2032

Figure 50: Latin America Market Y-o-Y Growth Projections, By Vertical - 2022 to 2032

Figure 51: Latin America Market Attractiveness Index, By Vertical - 2022 to 2032

Figure 52: Latin America Market Share, By Application, 2022 & 2032

Figure 53: Latin America Market Y-o-Y Growth Projections, By Application - 2022 to 2032

Figure 54: Latin America Market Attractiveness Index, By Application - 2022 to 2032

Figure 55: Latin America Market Share, By Data Center Type, 2022 & 2032

Figure 56: Latin America Market Y-o-Y Growth Projections, By Data Center Type - 2022 to 2032

Figure 57: Latin America Market Attractiveness Index, By Data Center Type - 2022 to 2032

Figure 58: Latin America Market Share, By Country, 2022 & 2032

Figure 59: Latin America Market Y-o-Y Growth Projections, By Country - 2022 to 2032

Figure 60: Latin America Market Attractiveness Index, By Country - 2022 to 2032

Figure 61: Europe Market Value (US$ Million) and Year-on-Year Growth, 2015 to 2032

Figure 62: Europe Market Absolute $ Historical Gain (2015 to 2021) and Opportunity (2022 to 2032), US$ Million

Figure 63: Europe Market Share, By Deployment Model, 2022 & 2032

Figure 64: Europe Market Y-o-Y Growth Projections, By Deployment Model - 2022 to 2032

Figure 65: Europe Market Attractiveness Index, By Deployment Model - 2022 to 2032

Figure 66: Europe Market Share, By Component, 2022 & 2032

Figure 67: Europe Market Y-o-Y Growth Projections, By Component - 2022 to 2032

Figure 68: Europe Market Attractiveness Index, By Component - 2022 to 2032

Figure 69: Europe Market Share, By Vertical, 2022 & 2032

Figure 70: Europe Market Y-o-Y Growth Projections, By Vertical - 2022 to 2032

Figure 71: Europe Market Attractiveness Index, By Vertical - 2022 to 2032

Figure 72: Europe Market Share, By Application, 2022 & 2032

Figure 73: Europe Market Y-o-Y Growth Projections, By Application - 2022 to 2032

Figure 74: Europe Market Attractiveness Index, By Application - 2022 to 2032

Figure 75: Europe Market Share, By Data Center Type, 2022 & 2032

Figure 76: Europe Market Y-o-Y Growth Projections, By Data Center Type - 2022 to 2032

Figure 77: Europe Market Attractiveness Index, By Data Center Type - 2022 to 2032

Figure 78: Europe Market Share, By Country, 2022 & 2032

Figure 79: Europe Market Y-o-Y Growth Projections, By Country - 2022 to 2032

Figure 80: Europe Market Attractiveness Index, By Country - 2022 to 2032

Figure 81: Asia Pacific Market Value (US$ Million) and Year-on-Year Growth, 2015 to 2032

Figure 82: Asia Pacific Market Absolute $ Historical Gain (2015 to 2021) and Opportunity (2022 to 2032), US$ Million

Figure 83: Asia Pacific Market Share, By Deployment Model, 2022 & 2032

Figure 84: Asia Pacific Market Y-o-Y Growth Projections, By Deployment Model - 2022 to 2032

Figure 85: Asia Pacific Market Attractiveness Index, By Deployment Model - 2022 to 2032

Figure 86: Asia Pacific Market Share, By Component, 2022 & 2032

Figure 87: Asia Pacific Market Y-o-Y Growth Projections, By Component - 2022 to 2032

Figure 88: Asia Pacific Market Attractiveness Index, By Component - 2022 to 2032

Figure 89: Asia Pacific Market Share, By Vertical, 2022 & 2032

Figure 90: Asia Pacific Market Y-o-Y Growth Projections, By Vertical - 2022 to 2032

Figure 91: Asia Pacific Market Attractiveness Index, By Vertical - 2022 to 2032

Figure 92: Asia Pacific Market Share, By Application, 2022 & 2032

Figure 93: Asia Pacific Market Y-o-Y Growth Projections, By Application - 2022 to 2032

Figure 94: Asia Pacific Market Attractiveness Index, By Application - 2022 to 2032

Figure 95: Asia Pacific Market Share, By Data Center Type, 2022 & 2032

Figure 96: Asia Pacific Market Y-o-Y Growth Projections, By Data Center Type - 2022 to 2032

Figure 97: Asia Pacific Market Attractiveness Index, By Data Center Type - 2022 to 2032

Figure 98: Asia Pacific Market Share, By Country, 2022 & 2032

Figure 99: Asia Pacific Market Y-o-Y Growth Projections, By Country - 2022 to 2032

Figure 100: Asia Pacific Market Attractiveness Index, By Country - 2022 to 2032

Figure 101: MEA Market Value (US$ Million) and Year-on-Year Growth, 2015 to 2032

Figure 102: MEA Market Absolute $ Historical Gain (2015 to 2021) and Opportunity (2022 to 2032), US$ Million

Figure 103: MEA Market Share, By Deployment Model, 2022 & 2032

Figure 104: MEA Market Y-o-Y Growth Projections, By Deployment Model - 2022 to 2032

Figure 105: MEA Market Attractiveness Index, By Deployment Model - 2022 to 2032

Figure 106: MEA Market Share, By Component, 2022 & 2032

Figure 107: MEA Market Y-o-Y Growth Projections, By Component - 2022 to 2032

Figure 108: MEA Market Attractiveness Index, By Component - 2022 to 2032

Figure 109: MEA Market Share, By Vertical, 2022 & 2032

Figure 110: MEA Market Y-o-Y Growth Projections, By Vertical - 2022 to 2032

Figure 111: MEA Market Attractiveness Index, By Vertical - 2022 to 2032

Figure 112: MEA Market Share, By Application, 2022 & 2032

Figure 113: MEA Market Y-o-Y Growth Projections, By Application - 2022 to 2032

Figure 114: MEA Market Attractiveness Index, By Application - 2022 to 2032

Figure 115: MEA Market Share, By Data Center Type, 2022 & 2032

Figure 116: MEA Market Y-o-Y Growth Projections, By Data Center Type - 2022 to 2032

Figure 117: MEA Market Attractiveness Index, By Data Center Type - 2022 to 2032

Figure 118: MEA Market Share, By Country, 2022 & 2032

Figure 119: MEA Market Y-o-Y Growth Projections, By Country - 2022 to 2032

Figure 120: MEA Market Attractiveness Index, By Country - 2022 to 2032

Recommendations

Technology

Carrier Infrastructure in Telecom Applications Market

Published : November 2022

Technology

Advanced Distribution Management Systems Market

Published : October 2022

Technology

Battlefield Management Systems Market

Published : October 2022

Technology

Survey and Feedback Management Software Market

Published : January 2022

Explore Technology Insights

View Reports

Data Center Infrastructure Management Market