Reports

- Global Locations -

Headquarters

Future Market Insights, Inc.

Christiana Corporate, 200
Continental Drive, Suite 401,
Newark, Delaware - 19713,
United States

T: +1-845-579-5705

Americas

Future Market Insights, Inc.

616 Corporate Way, Suite 2-9018,
Valley Cottage, NY 10989, United States

T: +1-347-918-3531

MEA

Future Market Insights

1602-6 Jumeirah Bay X2 Tower, Plot No: JLT-PH2-X2A,
Jumeirah Lakes Towers, Dubai,
United Arab Emirates

Europe

Future Market Insights

3rd Floor, 207 Regent Street,
W1B 3HH London
United Kingdom

T: + 44 (0) 20 8123 9659
D: +44 (0) 20 3287 4268

Asia Pacific

Future Market Insights

IndiaLand Global Tech Park, Unit UG-1, Behind Grand HighStreet, Phase 1, Hinjawadi, MH, Pune – 411057, India

DataOps Platform Market Outlook from 2024 to 2034

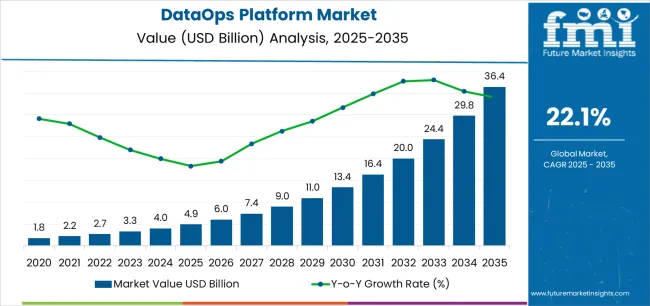
The global DataOps platform market size is estimated to reach US$ 4.0 billion in 2024. A CAGR of 23.3% is expected from the market in the forecast period 2024 to 2034. The market is projected to attain a valuation of US$ 32.7 billion by 2034.

Key DataOps Platform Market Trends

  • The development of DataOps as a Service line is rising as companies are looking to streamline data management and adopt cloud-based tools without investing in external infrastructure.
  • The integration of DataOps solutions with MLOps and DevOps technologies is expected to result in the creation of end-to-end processes.
  • Companies are investing in the development of novel data integration platforms aiming to address the challenges of specific industries, such as manufacturing, finance, and healthcare.
  • Companies are offering novel DataOps solutions equipped with features such as data lineage tracking and strong governance to ensure regulatory adherence & high data quality.
  • The evolution of DataOps platforms is anticipated amid the surging adoption of edge computing, thereby enabling real-time decision-making and insights in collaborative spaces.
Attributes Key Insights
DataOps Platform Market Estimated Size (2024E) US$ 4.0 billion
Projected DataOps Platform Market Valuation (2034F) US$ 32.7 billion
Value-based DataOps Platform Market CAGR (2024 to 2034) 23.3%

Don't pay for what you don't need

Customize your report by selecting specific countries or regions and save 30%!

Significant Drivers in the Global DataOps Platform Market Research Report

  • Rising demand for real-time data analytics and processing solutions
  • High complexity of data integration and environment challenges
  • Increasing demand for data reliability and quality assurance in quick decision-making processes
  • Increasing awareness of data pipeline orchestration tools in enhancing the company’s agility and operational efficiency
  • Growing demand for agile data management solutions among organizations with ongoing expansion of hybrid cloud and cloud computing solutions

2019 to 2023 DataOps Platform Market Growth Outlook Vs. 2024 to 2034 Forecast

The global DataOps platform market exhibited a CAGR of about 27.8% in the historical period. It is estimated to showcase a 23.3% CAGR in the forecast period. The market attained a valuation of US$ 3.2 billion in 2023.

Historical CAGR (2019 to 2023) 27.8%
Historical Valuation (2023) US$ 3.2 billion

Companies often relied on conventional data management solutions in the past. These mainly revolved around siloed approaches to data analysis, processing, and storage. These solutions lacked scalability, were time-consuming, and were manual.

The need for a more collaborative and superior software solution deployment & development process emerged in the early 2000s. This gave rise to the DevOps movement for the continuous integration of data and automation.

Data quality management in DataOps began to gain momentum in the mid-2010s when companies started following the principles of DevOps. The new platform helped with the application of automated, collaborative, and agile practices to data storage & management processes. This further enabled companies to prevent issues such as low-quality data, slow time-to-insights, and data silos.

Sudip Saha
Sudip Saha

Principal Consultant

Talk to Analyst

Find your sweet spots for generating winning opportunities in this market.

Semi-annual DataOps Platform Market Analysis

The table provides information about significant variations in growth rates and dynamic trends in the DataOps platform market. Readers can gain insights into changing consumer tastes and evolving market dynamics throughout an array of different periods. The table offers an explanation of growth potential, scrutinizing the role that actual numbers and predictions have in determining the future path of the market.

Details CAGR
H1 (2023 to 2033) 22.8%
H2 (2023 to 2033) 23.1%
H1 (2024 to 2034) 23.7%
H2 (2024 to 2034) 23.2%

Comparative View of Adjacent DataOps Platform Markets

The global DataOps platform market is set to be impacted by the peer or tangential markets in the technology division. These include other types of markets, such as the platform architecture market and the low code development platform market.

Analysis of these related industries can provide deeper insights that would be helpful for developing unique differentiating strategies to pursue growth and opportunity in the market.

The global DataOps platform market is anticipated to witness a CAGR of 23.3% in the evaluation period. This is attributed to the increasing focus of organizations on data compliance & security and the high demand for real-time data monitoring.

The platform architecture market is anticipated to showcase a CAGR of 14.1% in the estimated period. This is mainly because of the rising demand for containerization & microservices and the growing adoption of cloud-based platforms.

The low code development platform market will likely expand at a CAGR of 28.4% from 2024 to 2034. The market is projected to witness rapid growth amid the emergence of several non-technical users and the need for quick application delivery.

DataOps Platform Market:

Attributes DataOps Platform Market
CAGR (2024 to 2034) 23.3%
Growth Factor As organizations often deal with complex data environments, they are looking for advanced tools like DataOps platforms to deal with diverse data volumes, formats, and sources.
Key Trend The integration of machine learning and artificial intelligence (AI) capabilities is expected to gain traction with the rising demand for predictive analytics, workflow management, and automation of data processing.

Platform Architecture Market:

Attributes Platform Architecture Market
CAGR (2024 to 2034) 14.1%
Growth Factor The high adoption of hybrid deployments and cloud computing among organizations to gain cost-effectiveness and flexibility is expected to aid demand.
Key Trend The emergence of microservices-based architectures is set to help companies replace manual tasks with modular, small-scale services to enhance resilience and agility.

Low Code Development Platform Market:

Attributes Low Code Development Platform Market
CAGR (2024 to 2034) 28.4%
Growth Factor The rising demand for smooth deployment and delivery of applications and mid-high customer demands are set to bolster growth.
Key Trend The availability of accessible and user-friendly platforms to allow individuals to deploy and create applications is projected to be a key trend.

Get the data you need at a Fraction of the cost

Personalize your report by choosing insights you need
and save 40%!

Country-wise Insights

The section below highlights the CAGRs of the leading countries in the DataOps platform market. The three main countries pushing DataOps platform demand include Japan, the United Kingdom, and China.

According to the analysis, Japan is set to lead the DataOps platform market by showcasing a CAGR of 24.4% in the forecast period. The country is anticipated to be followed by the United Kingdom and China, with CAGRs of 24.2% and 23.9%, respectively.

Countries CAGR (2024 to 2034)
United States 23.5%
United Kingdom 24.2%
China 23.9%
Japan 24.4%
South Korea 23.8%

Japan-based Firms Use DataOps Tools to Ensure Smooth Data Management

Japan’s DataOps platform market is expected to rise at a CAGR of 24.4% from 2024 to 2034. The country is projected to reach a valuation of around US$ 3.4 billion by 2034. Factors pushing growth in Japan are:

  • Japan-based companies are facing issues with the extraction and management of data from several data sets. This is leading to the increasing use of data pipeline orchestration tools to ensure data reliability, handle complicated environments, and manage data smoothly.
  • Digital transformation across several industries in Japan is projected to push the demand for DataOps platforms to facilitate decision-making, boost time-to-insights, and propel agile developments.
  • The high demand for AI-driven insights and advanced analytics in Japan is set to drive the need for DataOps platforms to offer the functionalities necessary for unique model deployment, data analytics, and processing.
  • Japan-based firms are likely to focus on productivity and efficiency enhancements, which are anticipated to accelerate DataOps platform demand to maximize collaborations and automate manual operations.

Data Governance in DataOps Helps the United Kingdom Fight Cyberattacks

The United Kingdom is anticipated to attain a value of about US$ 1.3 billion by 2034. The country is likely to expand at a CAGR of 24.2% in the assessment period. Key factors driving the growth of the DataOps platform market in the country are:

  • Companies headquartered in the United Kingdom are striving to support quick decision-making, improve agility, and enhance data management solutions. Hence, they are looking for DataOps platforms to move smoothly through post-Brexit challenges.
  • Increasing concerns related to data compliance and sovereignty amid norms, including the General Data Protection Regulation (GDPR), are expected to push companies in the United Kingdom to invest in DataOps platforms to comply with these norms.
  • Ongoing innovations in InsurTech and FinTech across the United Kingdom are projected to support the adoption of DataOps platforms to improve customer experiences, enhance risk management, and optimize data processes.
  • The high frequency of cyberattacks in the United Kingdom has led to the surging demand for DataOps platforms. These are projected to be utilized to help companies strengthen their data systems.

China Adopts Cloud-based DataOps Platforms with High Government Funds

China’s DataOps platform market is expected to showcase a CAGR of 23.9% through 2034. A value of US$ 5.1 billion is anticipated for China by 2034. Demand for DataOps platforms in the country is projected to be augmented by:

  • Sales of DataOps platforms are anticipated to surge amid rising government investments in advanced technologies. The government’s funds are expected to lead to the development of data analytics and infrastructure capabilities, thereby driving the need for DataOps platforms.
  • With the presence of a well-established technology industry, China is anticipated to augment the start-up ecosystem. These start-ups are set to require novel data analytics and management functionalities to gain a competitive edge.
  • China-based firms are aiming to expand their presence by opening new hubs outside of the country. Innovative DataOps platforms are expected to help them evaluate and manage information across several departments and regions.
  • The growing adoption of machine learning and AI technologies in China is projected to drive the demand for advanced data management features, thereby pushing the requirement for DataOps platforms.

Category-wise Insights

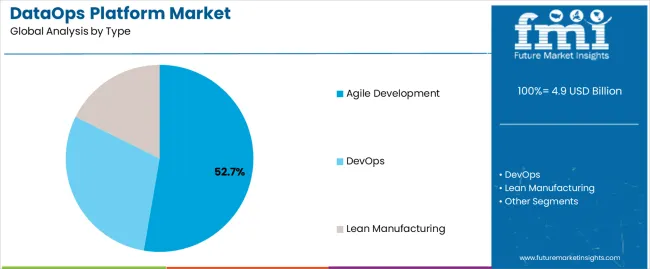
The below section shows the global trends in the DataOps platform industry in terms of type and components. The agile development segment is expected to lead the DataOps platform market based on type.

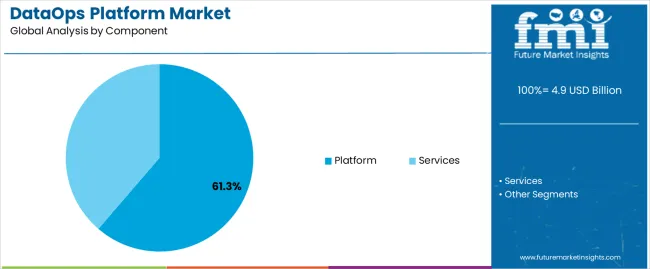
It is set to showcase a CAGR of around 23.1% from 2024 to 2034. Based on the component, the platform segment is anticipated to exhibit a dominant CAGR of 22.8% through 2034.

Segment Value CAGR (2024 to 2034)
Platform (Component) 22.8%
Agile Development (Type) 23.1%

Data Collaboration Platforms to Gain Impetus by 2034 Compared to Services

In terms of components, the platform segment is projected to showcase a CAGR of around 22.8% from 2024 to 2034. The segment is expected to generate a significant DataOps platform market share due to the following factors:

  • As compared to data orchestration services, DataOps platforms offer standardized workflows, processes, and tools to help ensure repeatability and consistency in data operations.
  • DataOps platforms provide pay-as-you-go pricing and subscription models, thereby reducing the requirement for high investments in maintaining and constructing customized solutions.
  • The ability of DataOps platforms to integrate with new technologies, tools, and data points is expected to help companies fulfill their data analytics and management needs.
  • Companies are using DataOps platforms to help comply with government norms in terms of data compliance, security, and governance.

Data Orchestration Tools to Find Extensive Usage in Agile Data Operations

Based on type, the agile development category is anticipated to rise at a CAGR of 23.1% in the forecast period in the DataOps platform industry. This growth is attributed to the following factors:

  • DataOps platforms are set to be used to initiate partnerships between significant stakeholders, analysts, and data engineers to promote agility & teamwork.
  • The ability of novel DataOps platforms to allow for the continuous integration and deployment (CI/CD) of analytics and data pipeline applications is expected to push their adoption.
  • Data operation platforms are projected to be utilized among teams to help them work efficiently and autonomously, thereby reducing bottlenecks and dependencies in the data pipeline.
  • The ability of DataOps platforms to optimize data deployment, processing, and integration for initiating the quick delivery of real-time solutions is anticipated to drive demand.

Competitive Landscape

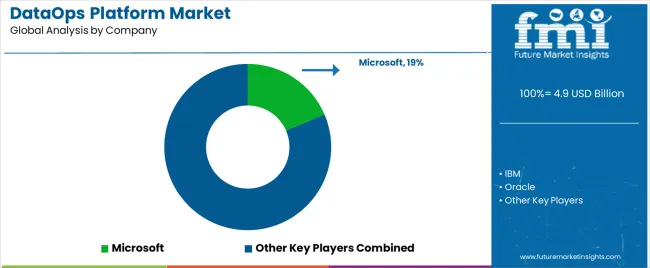
Leading companies in the DataOps platform market are focusing on the constant innovation of their in-house platforms to provide new features, including high data volume management, automated workflows, real-time monitoring, machine learning capabilities, and AI tools.

They are also engaging in collaborations with consulting firms and technology providers to provide customized solutions & help clients use complementary technologies. At the same time, they are focusing on offering smooth troubleshooting, customization, and onboarding processes to clients by investing in customer support.

For instance
  • In December 2023, Translab Technologies Pvt Ltd, a Bengaluru-based software company, unveiled its Tantor Data Platform. The company aims to transform the way firms evolve, manage, and use data.
  • In September 2023, the Big Data London conference witnessed the launch of ‘Data Products for Dummies,’ a new book by DataOps.live. The book is expected to be the go-to resource for those looking to expand the value of their data assets, both personally and professionally.
  • In June 2023, DataOps.live introduced its latest DataOps platform. The DataOps.live platform is uniquely positioned to offer observability throughout the duration of a data product's lifespan.

Key Companies Profiled in the DataOps Platform Market

  • Microsoft
  • IBM
  • Oracle
  • AWS
  • Informatica
  • Teradata
  • Wipro

DataOps Platform Market Outlook by Category

By Type:

  • Agile Development
  • DevOps
  • Lean Manufacturing

By Component:

  • Platform
  • Services

By Application:

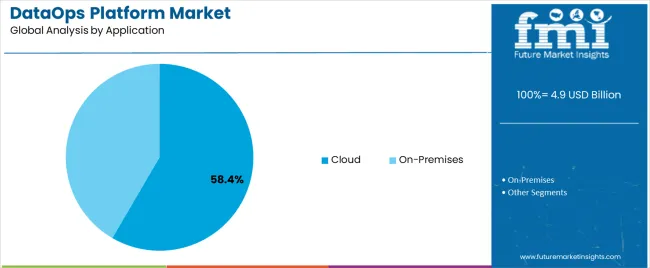
  • Cloud
  • On-premises

By Region:

  • North America
  • Latin America
  • Western Europe
  • Eastern Europe
  • South Asia and Pacific
  • East Asia
  • Middle East and Africa

Frequently Asked Questions

How big is the DataOps platform market?

The DataOps platform market is set to reach US$ 32.7 billion by 2034.

What is a DataOps platform?

Data teams employ a single command center called a DataOps platform to coordinate data pipelines.

What is DataOps vs DevOps?

Product development is the primary focus of DevOps, but DataOps aim to shorten the time between data requirement and data success.

What are the two main roles of tests in DataOps?

Automated deployment and validation are the two key roles of tests in DataOps.

At what CAGR is the DataOps platform market expected to rise?

The DataOps platform market is set to rise at a 23.3% CAGR from 2024 to 2034.

What would be the DataOps platform market value by 2024?

The DataOps platform market is anticipated to reach US$ 4.0 billion by 2024.

Table of Content

1. Executive Summary

    1.1. Global Market Outlook

    1.2. Demand-side Trends

    1.3. Supply-side Trends

    1.4. Technology Roadmap Analysis

    1.5. Analysis and Recommendations

2. Market Overview

    2.1. Market Coverage / Taxonomy

    2.2. Market Definition / Scope / Limitations

3. Market Background

    3.1. Market Dynamics

        3.1.1. Drivers

        3.1.2. Restraints

        3.1.3. Opportunity

        3.1.4. Trends

    3.2. Scenario Forecast

        3.2.1. Demand in Optimistic Scenario

        3.2.2. Demand in Likely Scenario

        3.2.3. Demand in Conservative Scenario

    3.3. Opportunity Map Analysis

    3.4. Investment Feasibility Matrix

    3.5. PESTLE and Porter’s Analysis

    3.6. Regulatory Landscape

        3.6.1. By Key Regions

        3.6.2. By Key Countries

    3.7. Regional Parent Market Outlook

4. Global Market Analysis 2019 to 2023 and Forecast, 2024 to 2034

    4.1. Historical Market Size Value (US$ billion) Analysis, 2019 to 2023

    4.2. Current and Future Market Size Value (US$ billion) Projections, 2024 to 2034

        4.2.1. Y-o-Y Growth Trend Analysis

        4.2.2. Absolute $ Opportunity Analysis

5. Global Market Analysis 2019 to 2023 and Forecast 2024 to 2034, By Type

    5.1. Introduction / Key Findings

    5.2. Historical Market Size Value (US$ billion) Analysis By Type, 2019 to 2023

    5.3. Current and Future Market Size Value (US$ billion) Analysis and Forecast By Type, 2024 to 2034

        5.3.1. Agile Development

        5.3.2. DevOps

        5.3.3. Lean Manufacturing

    5.4. Y-o-Y Growth Trend Analysis By Type, 2019 to 2023

    5.5. Absolute $ Opportunity Analysis By Type, 2024 to 2034

6. Global Market Analysis 2019 to 2023 and Forecast 2024 to 2034, By Component

    6.1. Introduction / Key Findings

    6.2. Historical Market Size Value (US$ billion) Analysis By Component, 2019 to 2023

    6.3. Current and Future Market Size Value (US$ billion) Analysis and Forecast By Component, 2024 to 2034

        6.3.1. Platform

        6.3.2. Services

    6.4. Y-o-Y Growth Trend Analysis By Component, 2019 to 2023

    6.5. Absolute $ Opportunity Analysis By Component, 2024 to 2034

7. Global Market Analysis 2019 to 2023 and Forecast 2024 to 2034, By Application

    7.1. Introduction / Key Findings

    7.2. Historical Market Size Value (US$ billion) Analysis By Application, 2019 to 2023

    7.3. Current and Future Market Size Value (US$ billion) Analysis and Forecast By Application, 2024 to 2034

        7.3.1. Cloud

        7.3.2. On-premises

    7.4. Y-o-Y Growth Trend Analysis By Application, 2019 to 2023

    7.5. Absolute $ Opportunity Analysis By Application, 2024 to 2034

8. Global Market Analysis 2019 to 2023 and Forecast 2024 to 2034, By Region

    8.1. Introduction

    8.2. Historical Market Size Value (US$ billion) Analysis By Region, 2019 to 2023

    8.3. Current Market Size Value (US$ billion) Analysis and Forecast By Region, 2024 to 2034

        8.3.1. North America

        8.3.2. Latin America

        8.3.3. Western Europe

        8.3.4. Eastern Europe

        8.3.5. South Asia and Pacific

        8.3.6. East Asia

        8.3.7. Middle East and Africa

    8.4. Market Attractiveness Analysis By Region

9. North America Market Analysis 2019 to 2023 and Forecast 2024 to 2034, By Country

    9.1. Historical Market Size Value (US$ billion) Trend Analysis By Market Taxonomy, 2019 to 2023

    9.2. Market Size Value (US$ billion) Forecast By Market Taxonomy, 2024 to 2034

        9.2.1. By Country

            9.2.1.1. United States

            9.2.1.2. Canada

        9.2.2. By Type

        9.2.3. By Component

        9.2.4. By Application

    9.3. Market Attractiveness Analysis

        9.3.1. By Country

        9.3.2. By Type

        9.3.3. By Component

        9.3.4. By Application

    9.4. Key Takeaways

10. Latin America Market Analysis 2019 to 2023 and Forecast 2024 to 2034, By Country

    10.1. Historical Market Size Value (US$ billion) Trend Analysis By Market Taxonomy, 2019 to 2023

    10.2. Market Size Value (US$ billion) Forecast By Market Taxonomy, 2024 to 2034

        10.2.1. By Country

            10.2.1.1. Brazil

            10.2.1.2. Mexico

            10.2.1.3. Rest of Latin America

        10.2.2. By Type

        10.2.3. By Component

        10.2.4. By Application

    10.3. Market Attractiveness Analysis

        10.3.1. By Country

        10.3.2. By Type

        10.3.3. By Component

        10.3.4. By Application

    10.4. Key Takeaways

11. Western Europe Market Analysis 2019 to 2023 and Forecast 2024 to 2034, By Country

    11.1. Historical Market Size Value (US$ billion) Trend Analysis By Market Taxonomy, 2019 to 2023

    11.2. Market Size Value (US$ billion) Forecast By Market Taxonomy, 2024 to 2034

        11.2.1. By Country

            11.2.1.1. Germany

            11.2.1.2. United Kingdom

            11.2.1.3. France

            11.2.1.4. Spain

            11.2.1.5. Italy

            11.2.1.6. Rest of Western Europe

        11.2.2. By Type

        11.2.3. By Component

        11.2.4. By Application

    11.3. Market Attractiveness Analysis

        11.3.1. By Country

        11.3.2. By Type

        11.3.3. By Component

        11.3.4. By Application

    11.4. Key Takeaways

12. Eastern Europe Market Analysis 2019 to 2023 and Forecast 2024 to 2034, By Country

    12.1. Historical Market Size Value (US$ billion) Trend Analysis By Market Taxonomy, 2019 to 2023

    12.2. Market Size Value (US$ billion) Forecast By Market Taxonomy, 2024 to 2034

        12.2.1. By Country

            12.2.1.1. Poland

            12.2.1.2. Russia

            12.2.1.3. Czech Republic

            12.2.1.4. Romania

            12.2.1.5. Rest of Eastern Europe

        12.2.2. By Type

        12.2.3. By Component

        12.2.4. By Application

    12.3. Market Attractiveness Analysis

        12.3.1. By Country

        12.3.2. By Type

        12.3.3. By Component

        12.3.4. By Application

    12.4. Key Takeaways

13. South Asia and Pacific Market Analysis 2019 to 2023 and Forecast 2024 to 2034, By Country

    13.1. Historical Market Size Value (US$ billion) Trend Analysis By Market Taxonomy, 2019 to 2023

    13.2. Market Size Value (US$ billion) Forecast By Market Taxonomy, 2024 to 2034

        13.2.1. By Country

            13.2.1.1. India

            13.2.1.2. Bangladesh

            13.2.1.3. Australia

            13.2.1.4. New Zealand

            13.2.1.5. Rest of South Asia and Pacific

        13.2.2. By Type

        13.2.3. By Component

        13.2.4. By Application

    13.3. Market Attractiveness Analysis

        13.3.1. By Country

        13.3.2. By Type

        13.3.3. By Component

        13.3.4. By Application

    13.4. Key Takeaways

14. East Asia Market Analysis 2019 to 2023 and Forecast 2024 to 2034, By Country

    14.1. Historical Market Size Value (US$ billion) Trend Analysis By Market Taxonomy, 2019 to 2023

    14.2. Market Size Value (US$ billion) Forecast By Market Taxonomy, 2024 to 2034

        14.2.1. By Country

            14.2.1.1. China

            14.2.1.2. Japan

            14.2.1.3. South Korea

        14.2.2. By Type

        14.2.3. By Component

        14.2.4. By Application

    14.3. Market Attractiveness Analysis

        14.3.1. By Country

        14.3.2. By Type

        14.3.3. By Component

        14.3.4. By Application

    14.4. Key Takeaways

15. Middle East and Africa Market Analysis 2019 to 2023 and Forecast 2024 to 2034, By Country

    15.1. Historical Market Size Value (US$ billion) Trend Analysis By Market Taxonomy, 2019 to 2023

    15.2. Market Size Value (US$ billion) Forecast By Market Taxonomy, 2024 to 2034

        15.2.1. By Country

            15.2.1.1. GCC Countries

            15.2.1.2. South Africa

            15.2.1.3. Israel

            15.2.1.4. Rest of Middle East & Africa

        15.2.2. By Type

        15.2.3. By Component

        15.2.4. By Application

    15.3. Market Attractiveness Analysis

        15.3.1. By Country

        15.3.2. By Type

        15.3.3. By Component

        15.3.4. By Application

    15.4. Key Takeaways

16. Key Countries Market Analysis

    16.1. United States

        16.1.1. Pricing Analysis

        16.1.2. Market Share Analysis, 2023

            16.1.2.1. By Type

            16.1.2.2. By Component

            16.1.2.3. By Application

    16.2. Canada

        16.2.1. Pricing Analysis

        16.2.2. Market Share Analysis, 2023

            16.2.2.1. By Type

            16.2.2.2. By Component

            16.2.2.3. By Application

    16.3. Brazil

        16.3.1. Pricing Analysis

        16.3.2. Market Share Analysis, 2023

            16.3.2.1. By Type

            16.3.2.2. By Component

            16.3.2.3. By Application

    16.4. Mexico

        16.4.1. Pricing Analysis

        16.4.2. Market Share Analysis, 2023

            16.4.2.1. By Type

            16.4.2.2. By Component

            16.4.2.3. By Application

    16.5. Germany

        16.5.1. Pricing Analysis

        16.5.2. Market Share Analysis, 2023

            16.5.2.1. By Type

            16.5.2.2. By Component

            16.5.2.3. By Application

    16.6. United Kingdom

        16.6.1. Pricing Analysis

        16.6.2. Market Share Analysis, 2023

            16.6.2.1. By Type

            16.6.2.2. By Component

            16.6.2.3. By Application

    16.7. France

        16.7.1. Pricing Analysis

        16.7.2. Market Share Analysis, 2023

            16.7.2.1. By Type

            16.7.2.2. By Component

            16.7.2.3. By Application

    16.8. Spain

        16.8.1. Pricing Analysis

        16.8.2. Market Share Analysis, 2023

            16.8.2.1. By Type

            16.8.2.2. By Component

            16.8.2.3. By Application

    16.9. Italy

        16.9.1. Pricing Analysis

        16.9.2. Market Share Analysis, 2023

            16.9.2.1. By Type

            16.9.2.2. By Component

            16.9.2.3. By Application

    16.10. Poland

        16.10.1. Pricing Analysis

        16.10.2. Market Share Analysis, 2023

            16.10.2.1. By Type

            16.10.2.2. By Component

            16.10.2.3. By Application

    16.11. Russia

        16.11.1. Pricing Analysis

        16.11.2. Market Share Analysis, 2023

            16.11.2.1. By Type

            16.11.2.2. By Component

            16.11.2.3. By Application

    16.12. Czech Republic

        16.12.1. Pricing Analysis

        16.12.2. Market Share Analysis, 2023

            16.12.2.1. By Type

            16.12.2.2. By Component

            16.12.2.3. By Application

    16.13. Romania

        16.13.1. Pricing Analysis

        16.13.2. Market Share Analysis, 2023

            16.13.2.1. By Type

            16.13.2.2. By Component

            16.13.2.3. By Application

    16.14. India

        16.14.1. Pricing Analysis

        16.14.2. Market Share Analysis, 2023

            16.14.2.1. By Type

            16.14.2.2. By Component

            16.14.2.3. By Application

    16.15. Bangladesh

        16.15.1. Pricing Analysis

        16.15.2. Market Share Analysis, 2023

            16.15.2.1. By Type

            16.15.2.2. By Component

            16.15.2.3. By Application

    16.16. Australia

        16.16.1. Pricing Analysis

        16.16.2. Market Share Analysis, 2023

            16.16.2.1. By Type

            16.16.2.2. By Component

            16.16.2.3. By Application

    16.17. New Zealand

        16.17.1. Pricing Analysis

        16.17.2. Market Share Analysis, 2023

            16.17.2.1. By Type

            16.17.2.2. By Component

            16.17.2.3. By Application

    16.18. China

        16.18.1. Pricing Analysis

        16.18.2. Market Share Analysis, 2023

            16.18.2.1. By Type

            16.18.2.2. By Component

            16.18.2.3. By Application

    16.19. Japan

        16.19.1. Pricing Analysis

        16.19.2. Market Share Analysis, 2023

            16.19.2.1. By Type

            16.19.2.2. By Component

            16.19.2.3. By Application

    16.20. South Korea

        16.20.1. Pricing Analysis

        16.20.2. Market Share Analysis, 2023

            16.20.2.1. By Type

            16.20.2.2. By Component

            16.20.2.3. By Application

    16.21. GCC Countries

        16.21.1. Pricing Analysis

        16.21.2. Market Share Analysis, 2023

            16.21.2.1. By Type

            16.21.2.2. By Component

            16.21.2.3. By Application

    16.22. South Africa

        16.22.1. Pricing Analysis

        16.22.2. Market Share Analysis, 2023

            16.22.2.1. By Type

            16.22.2.2. By Component

            16.22.2.3. By Application

    16.23. Israel

        16.23.1. Pricing Analysis

        16.23.2. Market Share Analysis, 2023

            16.23.2.1. By Type

            16.23.2.2. By Component

            16.23.2.3. By Application

17. Market Structure Analysis

    17.1. Competition Dashboard

    17.2. Competition Benchmarking

    17.3. Market Share Analysis of Top Players

        17.3.1. By Regional

        17.3.2. By Type

        17.3.3. By Component

        17.3.4. By Application

18. Competition Analysis

    18.1. Competition Deep Dive

        18.1.1. Microsoft

            18.1.1.1. Overview

            18.1.1.2. Product Portfolio

            18.1.1.3. Profitability by Market Segments

            18.1.1.4. Sales Footprint

            18.1.1.5. Strategy Overview

                18.1.1.5.1. Marketing Strategy

        18.1.2. IBM

            18.1.2.1. Overview

            18.1.2.2. Product Portfolio

            18.1.2.3. Profitability by Market Segments

            18.1.2.4. Sales Footprint

            18.1.2.5. Strategy Overview

                18.1.2.5.1. Marketing Strategy

        18.1.3. Oracle

            18.1.3.1. Overview

            18.1.3.2. Product Portfolio

            18.1.3.3. Profitability by Market Segments

            18.1.3.4. Sales Footprint

            18.1.3.5. Strategy Overview

                18.1.3.5.1. Marketing Strategy

        18.1.4. AWS

            18.1.4.1. Overview

            18.1.4.2. Product Portfolio

            18.1.4.3. Profitability by Market Segments

            18.1.4.4. Sales Footprint

            18.1.4.5. Strategy Overview

                18.1.4.5.1. Marketing Strategy

        18.1.5. Informatica

            18.1.5.1. Overview

            18.1.5.2. Product Portfolio

            18.1.5.3. Profitability by Market Segments

            18.1.5.4. Sales Footprint

            18.1.5.5. Strategy Overview

                18.1.5.5.1. Marketing Strategy

        18.1.6. Teradata

            18.1.6.1. Overview

            18.1.6.2. Product Portfolio

            18.1.6.3. Profitability by Market Segments

            18.1.6.4. Sales Footprint

            18.1.6.5. Strategy Overview

                18.1.6.5.1. Marketing Strategy

        18.1.7. Wipro

            18.1.7.1. Overview

            18.1.7.2. Product Portfolio

            18.1.7.3. Profitability by Market Segments

            18.1.7.4. Sales Footprint

            18.1.7.5. Strategy Overview

                18.1.7.5.1. Marketing Strategy

        18.1.8. Accenture

            18.1.8.1. Overview

            18.1.8.2. Product Portfolio

            18.1.8.3. Profitability by Market Segments

            18.1.8.4. Sales Footprint

            18.1.8.5. Strategy Overview

                18.1.8.5.1. Marketing Strategy

        18.1.9. SAS Institute

            18.1.9.1. Overview

            18.1.9.2. Product Portfolio

            18.1.9.3. Profitability by Market Segments

            18.1.9.4. Sales Footprint

            18.1.9.5. Strategy Overview

                18.1.9.5.1. Marketing Strategy

        18.1.10. Hitachi Vantara

            18.1.10.1. Overview

            18.1.10.2. Product Portfolio

            18.1.10.3. Profitability by Market Segments

            18.1.10.4. Sales Footprint

            18.1.10.5. Strategy Overview

                18.1.10.5.1. Marketing Strategy

19. Assumptions & Acronyms Used

20. Research Methodology

List of Tables

Table 1: Global Market Value (US$ billion) Forecast by Region, 2019 to 2034

Table 2: Global Market Value (US$ billion) Forecast by Type, 2019 to 2034

Table 3: Global Market Value (US$ billion) Forecast by Component, 2019 to 2034

Table 4: Global Market Value (US$ billion) Forecast by Application, 2019 to 2034

Table 5: North America Market Value (US$ billion) Forecast by Country, 2019 to 2034

Table 6: North America Market Value (US$ billion) Forecast by Type, 2019 to 2034

Table 7: North America Market Value (US$ billion) Forecast by Component, 2019 to 2034

Table 8: North America Market Value (US$ billion) Forecast by Application, 2019 to 2034

Table 9: Latin America Market Value (US$ billion) Forecast by Country, 2019 to 2034

Table 10: Latin America Market Value (US$ billion) Forecast by Type, 2019 to 2034

Table 11: Latin America Market Value (US$ billion) Forecast by Component, 2019 to 2034

Table 12: Latin America Market Value (US$ billion) Forecast by Application, 2019 to 2034

Table 13: Western Europe Market Value (US$ billion) Forecast by Country, 2019 to 2034

Table 14: Western Europe Market Value (US$ billion) Forecast by Type, 2019 to 2034

Table 15: Western Europe Market Value (US$ billion) Forecast by Component, 2019 to 2034

Table 16: Western Europe Market Value (US$ billion) Forecast by Application, 2019 to 2034

Table 17: Eastern Europe Market Value (US$ billion) Forecast by Country, 2019 to 2034

Table 18: Eastern Europe Market Value (US$ billion) Forecast by Type, 2019 to 2034

Table 19: Eastern Europe Market Value (US$ billion) Forecast by Component, 2019 to 2034

Table 20: Eastern Europe Market Value (US$ billion) Forecast by Application, 2019 to 2034

Table 21: South Asia and Pacific Market Value (US$ billion) Forecast by Country, 2019 to 2034

Table 22: South Asia and Pacific Market Value (US$ billion) Forecast by Type, 2019 to 2034

Table 23: South Asia and Pacific Market Value (US$ billion) Forecast by Component, 2019 to 2034

Table 24: South Asia and Pacific Market Value (US$ billion) Forecast by Application, 2019 to 2034

Table 25: East Asia Market Value (US$ billion) Forecast by Country, 2019 to 2034

Table 26: East Asia Market Value (US$ billion) Forecast by Type, 2019 to 2034

Table 27: East Asia Market Value (US$ billion) Forecast by Component, 2019 to 2034

Table 28: East Asia Market Value (US$ billion) Forecast by Application, 2019 to 2034

Table 29: Middle East and Africa Market Value (US$ billion) Forecast by Country, 2019 to 2034

Table 30: Middle East and Africa Market Value (US$ billion) Forecast by Type, 2019 to 2034

Table 31: Middle East and Africa Market Value (US$ billion) Forecast by Component, 2019 to 2034

Table 32: Middle East and Africa Market Value (US$ billion) Forecast by Application, 2019 to 2034

List of Charts

Figure 1: Global Market Value (US$ billion) by Type, 2024 to 2034

Figure 2: Global Market Value (US$ billion) by Component, 2024 to 2034

Figure 3: Global Market Value (US$ billion) by Application, 2024 to 2034

Figure 4: Global Market Value (US$ billion) by Region, 2024 to 2034

Figure 5: Global Market Value (US$ billion) Analysis by Region, 2019 to 2034

Figure 6: Global Market Value Share (%) and BPS Analysis by Region, 2024 to 2034

Figure 7: Global Market Y-o-Y Growth (%) Projections by Region, 2024 to 2034

Figure 8: Global Market Value (US$ billion) Analysis by Type, 2019 to 2034

Figure 9: Global Market Value Share (%) and BPS Analysis by Type, 2024 to 2034

Figure 10: Global Market Y-o-Y Growth (%) Projections by Type, 2024 to 2034

Figure 11: Global Market Value (US$ billion) Analysis by Component, 2019 to 2034

Figure 12: Global Market Value Share (%) and BPS Analysis by Component, 2024 to 2034

Figure 13: Global Market Y-o-Y Growth (%) Projections by Component, 2024 to 2034

Figure 14: Global Market Value (US$ billion) Analysis by Application, 2019 to 2034

Figure 15: Global Market Value Share (%) and BPS Analysis by Application, 2024 to 2034

Figure 16: Global Market Y-o-Y Growth (%) Projections by Application, 2024 to 2034

Figure 17: Global Market Attractiveness by Type, 2024 to 2034

Figure 18: Global Market Attractiveness by Component, 2024 to 2034

Figure 19: Global Market Attractiveness by Application, 2024 to 2034

Figure 20: Global Market Attractiveness by Region, 2024 to 2034

Figure 21: North America Market Value (US$ billion) by Type, 2024 to 2034

Figure 22: North America Market Value (US$ billion) by Component, 2024 to 2034

Figure 23: North America Market Value (US$ billion) by Application, 2024 to 2034

Figure 24: North America Market Value (US$ billion) by Country, 2024 to 2034

Figure 25: North America Market Value (US$ billion) Analysis by Country, 2019 to 2034

Figure 26: North America Market Value Share (%) and BPS Analysis by Country, 2024 to 2034

Figure 27: North America Market Y-o-Y Growth (%) Projections by Country, 2024 to 2034

Figure 28: North America Market Value (US$ billion) Analysis by Type, 2019 to 2034

Figure 29: North America Market Value Share (%) and BPS Analysis by Type, 2024 to 2034

Figure 30: North America Market Y-o-Y Growth (%) Projections by Type, 2024 to 2034

Figure 31: North America Market Value (US$ billion) Analysis by Component, 2019 to 2034

Figure 32: North America Market Value Share (%) and BPS Analysis by Component, 2024 to 2034

Figure 33: North America Market Y-o-Y Growth (%) Projections by Component, 2024 to 2034

Figure 34: North America Market Value (US$ billion) Analysis by Application, 2019 to 2034

Figure 35: North America Market Value Share (%) and BPS Analysis by Application, 2024 to 2034

Figure 36: North America Market Y-o-Y Growth (%) Projections by Application, 2024 to 2034

Figure 37: North America Market Attractiveness by Type, 2024 to 2034

Figure 38: North America Market Attractiveness by Component, 2024 to 2034

Figure 39: North America Market Attractiveness by Application, 2024 to 2034

Figure 40: North America Market Attractiveness by Country, 2024 to 2034

Figure 41: Latin America Market Value (US$ billion) by Type, 2024 to 2034

Figure 42: Latin America Market Value (US$ billion) by Component, 2024 to 2034

Figure 43: Latin America Market Value (US$ billion) by Application, 2024 to 2034

Figure 44: Latin America Market Value (US$ billion) by Country, 2024 to 2034

Figure 45: Latin America Market Value (US$ billion) Analysis by Country, 2019 to 2034

Figure 46: Latin America Market Value Share (%) and BPS Analysis by Country, 2024 to 2034

Figure 47: Latin America Market Y-o-Y Growth (%) Projections by Country, 2024 to 2034

Figure 48: Latin America Market Value (US$ billion) Analysis by Type, 2019 to 2034

Figure 49: Latin America Market Value Share (%) and BPS Analysis by Type, 2024 to 2034

Figure 50: Latin America Market Y-o-Y Growth (%) Projections by Type, 2024 to 2034

Figure 51: Latin America Market Value (US$ billion) Analysis by Component, 2019 to 2034

Figure 52: Latin America Market Value Share (%) and BPS Analysis by Component, 2024 to 2034

Figure 53: Latin America Market Y-o-Y Growth (%) Projections by Component, 2024 to 2034

Figure 54: Latin America Market Value (US$ billion) Analysis by Application, 2019 to 2034

Figure 55: Latin America Market Value Share (%) and BPS Analysis by Application, 2024 to 2034

Figure 56: Latin America Market Y-o-Y Growth (%) Projections by Application, 2024 to 2034

Figure 57: Latin America Market Attractiveness by Type, 2024 to 2034

Figure 58: Latin America Market Attractiveness by Component, 2024 to 2034

Figure 59: Latin America Market Attractiveness by Application, 2024 to 2034

Figure 60: Latin America Market Attractiveness by Country, 2024 to 2034

Figure 61: Western Europe Market Value (US$ billion) by Type, 2024 to 2034

Figure 62: Western Europe Market Value (US$ billion) by Component, 2024 to 2034

Figure 63: Western Europe Market Value (US$ billion) by Application, 2024 to 2034

Figure 64: Western Europe Market Value (US$ billion) by Country, 2024 to 2034

Figure 65: Western Europe Market Value (US$ billion) Analysis by Country, 2019 to 2034

Figure 66: Western Europe Market Value Share (%) and BPS Analysis by Country, 2024 to 2034

Figure 67: Western Europe Market Y-o-Y Growth (%) Projections by Country, 2024 to 2034

Figure 68: Western Europe Market Value (US$ billion) Analysis by Type, 2019 to 2034

Figure 69: Western Europe Market Value Share (%) and BPS Analysis by Type, 2024 to 2034

Figure 70: Western Europe Market Y-o-Y Growth (%) Projections by Type, 2024 to 2034

Figure 71: Western Europe Market Value (US$ billion) Analysis by Component, 2019 to 2034

Figure 72: Western Europe Market Value Share (%) and BPS Analysis by Component, 2024 to 2034

Figure 73: Western Europe Market Y-o-Y Growth (%) Projections by Component, 2024 to 2034

Figure 74: Western Europe Market Value (US$ billion) Analysis by Application, 2019 to 2034

Figure 75: Western Europe Market Value Share (%) and BPS Analysis by Application, 2024 to 2034

Figure 76: Western Europe Market Y-o-Y Growth (%) Projections by Application, 2024 to 2034

Figure 77: Western Europe Market Attractiveness by Type, 2024 to 2034

Figure 78: Western Europe Market Attractiveness by Component, 2024 to 2034

Figure 79: Western Europe Market Attractiveness by Application, 2024 to 2034

Figure 80: Western Europe Market Attractiveness by Country, 2024 to 2034

Figure 81: Eastern Europe Market Value (US$ billion) by Type, 2024 to 2034

Figure 82: Eastern Europe Market Value (US$ billion) by Component, 2024 to 2034

Figure 83: Eastern Europe Market Value (US$ billion) by Application, 2024 to 2034

Figure 84: Eastern Europe Market Value (US$ billion) by Country, 2024 to 2034

Figure 85: Eastern Europe Market Value (US$ billion) Analysis by Country, 2019 to 2034

Figure 86: Eastern Europe Market Value Share (%) and BPS Analysis by Country, 2024 to 2034

Figure 87: Eastern Europe Market Y-o-Y Growth (%) Projections by Country, 2024 to 2034

Figure 88: Eastern Europe Market Value (US$ billion) Analysis by Type, 2019 to 2034

Figure 89: Eastern Europe Market Value Share (%) and BPS Analysis by Type, 2024 to 2034

Figure 90: Eastern Europe Market Y-o-Y Growth (%) Projections by Type, 2024 to 2034

Figure 91: Eastern Europe Market Value (US$ billion) Analysis by Component, 2019 to 2034

Figure 92: Eastern Europe Market Value Share (%) and BPS Analysis by Component, 2024 to 2034

Figure 93: Eastern Europe Market Y-o-Y Growth (%) Projections by Component, 2024 to 2034

Figure 94: Eastern Europe Market Value (US$ billion) Analysis by Application, 2019 to 2034

Figure 95: Eastern Europe Market Value Share (%) and BPS Analysis by Application, 2024 to 2034

Figure 96: Eastern Europe Market Y-o-Y Growth (%) Projections by Application, 2024 to 2034

Figure 97: Eastern Europe Market Attractiveness by Type, 2024 to 2034

Figure 98: Eastern Europe Market Attractiveness by Component, 2024 to 2034

Figure 99: Eastern Europe Market Attractiveness by Application, 2024 to 2034

Figure 100: Eastern Europe Market Attractiveness by Country, 2024 to 2034

Figure 101: South Asia and Pacific Market Value (US$ billion) by Type, 2024 to 2034

Figure 102: South Asia and Pacific Market Value (US$ billion) by Component, 2024 to 2034

Figure 103: South Asia and Pacific Market Value (US$ billion) by Application, 2024 to 2034

Figure 104: South Asia and Pacific Market Value (US$ billion) by Country, 2024 to 2034

Figure 105: South Asia and Pacific Market Value (US$ billion) Analysis by Country, 2019 to 2034

Figure 106: South Asia and Pacific Market Value Share (%) and BPS Analysis by Country, 2024 to 2034

Figure 107: South Asia and Pacific Market Y-o-Y Growth (%) Projections by Country, 2024 to 2034

Figure 108: South Asia and Pacific Market Value (US$ billion) Analysis by Type, 2019 to 2034

Figure 109: South Asia and Pacific Market Value Share (%) and BPS Analysis by Type, 2024 to 2034

Figure 110: South Asia and Pacific Market Y-o-Y Growth (%) Projections by Type, 2024 to 2034

Figure 111: South Asia and Pacific Market Value (US$ billion) Analysis by Component, 2019 to 2034

Figure 112: South Asia and Pacific Market Value Share (%) and BPS Analysis by Component, 2024 to 2034

Figure 113: South Asia and Pacific Market Y-o-Y Growth (%) Projections by Component, 2024 to 2034

Figure 114: South Asia and Pacific Market Value (US$ billion) Analysis by Application, 2019 to 2034

Figure 115: South Asia and Pacific Market Value Share (%) and BPS Analysis by Application, 2024 to 2034

Figure 116: South Asia and Pacific Market Y-o-Y Growth (%) Projections by Application, 2024 to 2034

Figure 117: South Asia and Pacific Market Attractiveness by Type, 2024 to 2034

Figure 118: South Asia and Pacific Market Attractiveness by Component, 2024 to 2034

Figure 119: South Asia and Pacific Market Attractiveness by Application, 2024 to 2034

Figure 120: South Asia and Pacific Market Attractiveness by Country, 2024 to 2034

Figure 121: East Asia Market Value (US$ billion) by Type, 2024 to 2034

Figure 122: East Asia Market Value (US$ billion) by Component, 2024 to 2034

Figure 123: East Asia Market Value (US$ billion) by Application, 2024 to 2034

Figure 124: East Asia Market Value (US$ billion) by Country, 2024 to 2034

Figure 125: East Asia Market Value (US$ billion) Analysis by Country, 2019 to 2034

Figure 126: East Asia Market Value Share (%) and BPS Analysis by Country, 2024 to 2034

Figure 127: East Asia Market Y-o-Y Growth (%) Projections by Country, 2024 to 2034

Figure 128: East Asia Market Value (US$ billion) Analysis by Type, 2019 to 2034

Figure 129: East Asia Market Value Share (%) and BPS Analysis by Type, 2024 to 2034

Figure 130: East Asia Market Y-o-Y Growth (%) Projections by Type, 2024 to 2034

Figure 131: East Asia Market Value (US$ billion) Analysis by Component, 2019 to 2034

Figure 132: East Asia Market Value Share (%) and BPS Analysis by Component, 2024 to 2034

Figure 133: East Asia Market Y-o-Y Growth (%) Projections by Component, 2024 to 2034

Figure 134: East Asia Market Value (US$ billion) Analysis by Application, 2019 to 2034

Figure 135: East Asia Market Value Share (%) and BPS Analysis by Application, 2024 to 2034

Figure 136: East Asia Market Y-o-Y Growth (%) Projections by Application, 2024 to 2034

Figure 137: East Asia Market Attractiveness by Type, 2024 to 2034

Figure 138: East Asia Market Attractiveness by Component, 2024 to 2034

Figure 139: East Asia Market Attractiveness by Application, 2024 to 2034

Figure 140: East Asia Market Attractiveness by Country, 2024 to 2034

Figure 141: Middle East and Africa Market Value (US$ billion) by Type, 2024 to 2034

Figure 142: Middle East and Africa Market Value (US$ billion) by Component, 2024 to 2034

Figure 143: Middle East and Africa Market Value (US$ billion) by Application, 2024 to 2034

Figure 144: Middle East and Africa Market Value (US$ billion) by Country, 2024 to 2034

Figure 145: Middle East and Africa Market Value (US$ billion) Analysis by Country, 2019 to 2034

Figure 146: Middle East and Africa Market Value Share (%) and BPS Analysis by Country, 2024 to 2034

Figure 147: Middle East and Africa Market Y-o-Y Growth (%) Projections by Country, 2024 to 2034

Figure 148: Middle East and Africa Market Value (US$ billion) Analysis by Type, 2019 to 2034

Figure 149: Middle East and Africa Market Value Share (%) and BPS Analysis by Type, 2024 to 2034

Figure 150: Middle East and Africa Market Y-o-Y Growth (%) Projections by Type, 2024 to 2034

Figure 151: Middle East and Africa Market Value (US$ billion) Analysis by Component, 2019 to 2034

Figure 152: Middle East and Africa Market Value Share (%) and BPS Analysis by Component, 2024 to 2034

Figure 153: Middle East and Africa Market Y-o-Y Growth (%) Projections by Component, 2024 to 2034

Figure 154: Middle East and Africa Market Value (US$ billion) Analysis by Application, 2019 to 2034

Figure 155: Middle East and Africa Market Value Share (%) and BPS Analysis by Application, 2024 to 2034

Figure 156: Middle East and Africa Market Y-o-Y Growth (%) Projections by Application, 2024 to 2034

Figure 157: Middle East and Africa Market Attractiveness by Type, 2024 to 2034

Figure 158: Middle East and Africa Market Attractiveness by Component, 2024 to 2034

Figure 159: Middle East and Africa Market Attractiveness by Application, 2024 to 2034

Figure 160: Middle East and Africa Market Attractiveness by Country, 2024 to 2034

Recommendations

Technology

Classified Platform Market

Published : July 2023

Technology

Real Time Store Monitoring Platform Market

Published : May 2023

Technology

Low Code Development Platform Market

Published : December 2022

Technology

Platform Architecture Market

Published : October 2022

Explore Technology Insights

View Reports