The No-code AI Platform Market is estimated to be valued at USD 6.7 billion in 2025 and is projected to reach USD 72.9 billion by 2035, registering a compound annual growth rate (CAGR) of 26.9% over the forecast period.
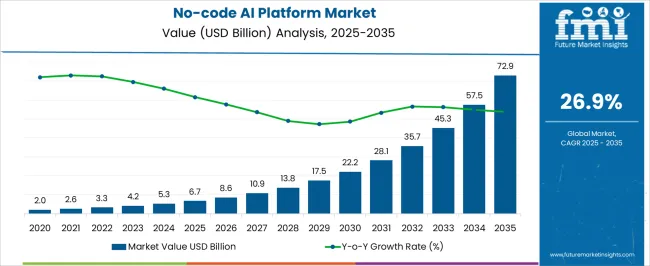
| Metric | Value |
|---|---|
| No-code AI Platform Market Estimated Value in (2025 E) | USD 6.7 billion |
| No-code AI Platform Market Forecast Value in (2035 F) | USD 72.9 billion |
| Forecast CAGR (2025 to 2035) | 26.9% |
The No-Code AI Platform market is experiencing rapid growth driven by the increasing demand for democratized artificial intelligence solutions that enable users without programming expertise to develop, deploy, and scale AI applications. The market expansion is being supported by enterprises seeking to reduce development timelines and costs while maintaining flexibility and adaptability in AI adoption.
Solutions that integrate prebuilt models, drag-and-drop interfaces, and visual workflows have become essential for organizations aiming to accelerate innovation and optimize decision-making processes. The current landscape reflects strong adoption across various sectors, particularly among large enterprises, due to the growing need for automation, data-driven insights, and operational efficiency.
As organizations continue to prioritize AI integration while addressing the shortage of skilled AI professionals, the No-Code AI Platform market is positioned for sustained growth Future opportunities are expected to be shaped by improvements in AI model accessibility, integration with enterprise systems, and advancements in edge computing and cloud-based deployment, enabling rapid experimentation and scaling of AI initiatives without heavy reliance on specialized technical resources.
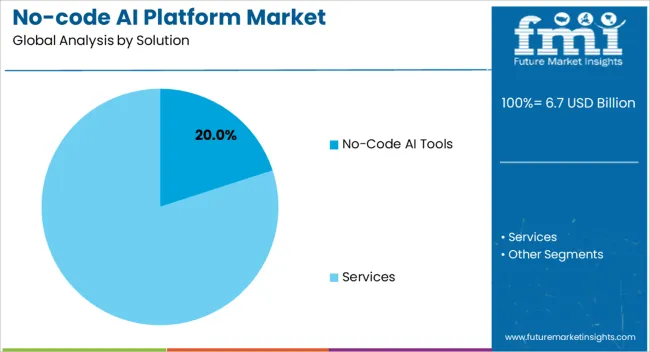
The No-Code AI Tools solution segment is projected to hold 20.00% of the overall No-Code AI Platform market revenue in 2025, making it a leading solution category. This prominence is being driven by the increasing requirement for rapid application development and deployment, allowing organizations to create intelligent workflows without deep technical knowledge.
Adoption has been facilitated by the availability of drag-and-drop interfaces, prebuilt AI models, and automated model training capabilities, which reduce development complexity and time. The segment has been further supported by enterprise demand for self-service AI platforms that empower business users and analysts to derive actionable insights independently.
Organizations have increasingly preferred no-code solutions due to the ability to experiment with AI initiatives while mitigating risk and lowering costs associated with traditional software development As enterprises continue to emphasize operational efficiency, agility, and democratization of AI, the No-Code AI Tools solution segment is expected to maintain its market leadership through ongoing innovation in user-friendly AI capabilities.
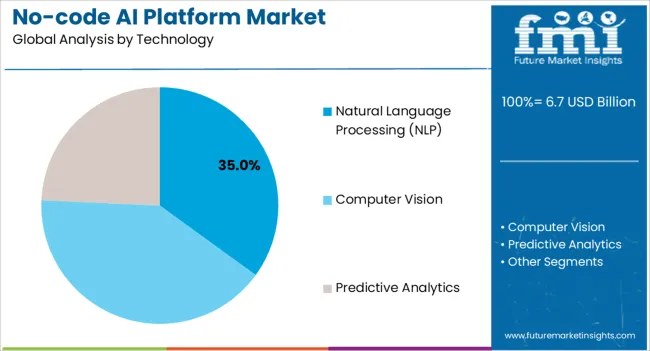
The Natural Language Processing technology segment is anticipated to capture 35.00% of the No-Code AI Platform market revenue in 2025, positioning it as the most significant technology category. Growth has been driven by rising enterprise demand for AI solutions capable of understanding, interpreting, and generating human language to enhance customer engagement, automate workflows, and support data analysis.
The expansion of this segment is also being supported by advancements in pre-trained language models and low-code integration capabilities, which allow organizations to implement NLP applications rapidly. Increasing utilization of chatbots, virtual assistants, sentiment analysis, and automated content generation across industries has further reinforced the adoption of NLP-based no-code platforms.
The flexibility to customize NLP applications without extensive programming has attracted business users seeking immediate insights and operational efficiency As organizations continue to pursue AI-driven communication and data intelligence solutions, the Natural Language Processing technology segment is expected to sustain its leading position in the market, driven by continuous improvements in algorithm accuracy and integration with broader enterprise ecosystems.
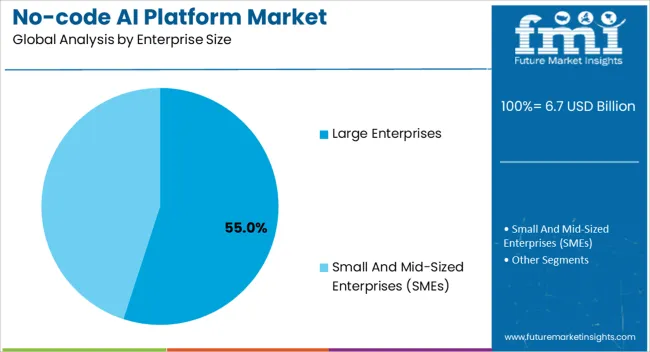
The Large Enterprises end-use segment is projected to hold 55.00% of the No-Code AI Platform market revenue in 2025, establishing it as the dominant consumer category. This leadership is being driven by the significant resources and strategic initiatives of large organizations to accelerate AI adoption while addressing skill shortages.
Large enterprises have increasingly leveraged no-code AI platforms to streamline internal processes, enhance decision-making, and develop scalable AI solutions across multiple departments. The demand is also being influenced by the need for rapid prototyping, operational efficiency, and reduction of dependency on specialized AI engineers.
As these enterprises implement AI-driven transformation strategies, they benefit from the flexibility of no-code solutions that support multi-department collaboration, integration with existing enterprise software, and secure governance of AI workflows The segment’s growth is further supported by the rising emphasis on innovation, competitiveness, and data-driven business strategies, positioning large enterprises as the primary drivers of revenue in the No-Code AI Platform market.
The no-code AI platform market is projected to expand at 28.3% CAGR between 2025 and 2035. As per FMI, the market expanded at a CAGR of 13% in the historical period from 2020 to 2025.
Growth is attributed to the rapid evolution and implementation of AI and machine learning across the globe. Technologies like automated ML are gaining immense popularity as these solutions are meant for businesses that lack ML expertise.
Further, there has also been an increase in the adoption of IoT, edge computing, and data science solutions & services across various industries, which is expected to aid growth.
Urgent Need to Automate Tasks in Organizations to Drive Sales of No-code AI Platforms
Artificial intelligence and machine learning have been implemented in numerous industries and departments such as the human resource department of various companies over the past few years. Further, these technologies are mainly used for automating numerous tasks and developing programs & models to obtain real-time insights about several aspects of a company.
Not every employee in a company that uses AI platforms is aware of the development methods or has the correct technical expertise. To allow such individuals to interact with and develop AI platforms for their work, no-code AI platforms have been an essential tool. It is projected to drive the global market in the forecast period.
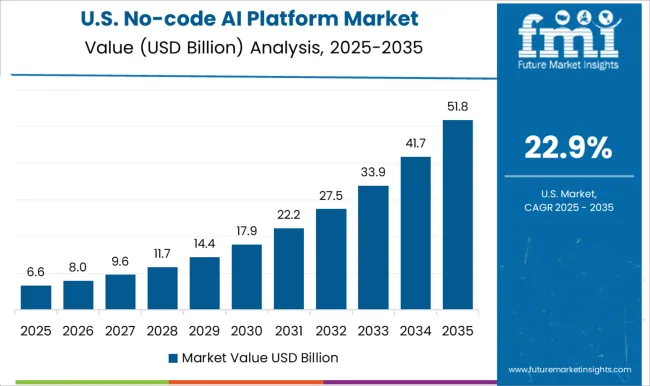
Key Players in the United States are Developing AI without Coding
| Country | The United States |
|---|---|
| Market Share % (2025) | 19.3% |
Several companies in the United States provide novel AI solutions and services for building mobile & desktop apps for businesses, automating workflows, and automated communication. Furthermore, many large-scale technology companies such as Neuralink, IBM, Microsoft, and Google are implementing AI for multiple applications in the United States.
Companies in India are inclined toward Low Code Machine Learning
| Country | India |
|---|---|
| Market CAGR % (2025 to 2035) | 32.3% |
Several enterprises in India have implemented AI solutions and services for their business purposes over the past few years. The majority of these companies had to shift to software and mobile application platforms irrespective of their domain because of the growing penetration of the internet in India.
Software development automation and analytics have witnessed high growth across the country over the last few years. Further, AI implementation has also witnessed growth in the education and government sectors. Owing to the aforementioned factors, India’s no-code AI platform market is expected to showcase a high CAGR of 32.3% in the forecast period.
Government in Japan to Deploy No-code Machine Learning in Educational Institutions
| Country | Japan |
|---|---|
| Market Share % (2025) | 4.3% |
Due to the growing aging population in Japan, the workforce in Japan is experiencing a decline. However, several companies in the country have started offering AI solutions and services to enhance workflow.
AI is also being developed by financial and chemical manufacturers in Japan, as well as government institutions. The government is focusing on equipping educational institutions with AI platforms. Thus, Japan’s no-code AI platform market is likely to expand at a CAGR of 33.8% in the evaluation period.
Demand for No-code AI Tools to Surge among Organizations
| Segment | No-code AI Tools |
|---|---|
| Market Share % (2025) | 64.3% |
The no-code AI tools segment is projected to generate a global market share of more than 64.3% in the assessment period. These tools require programming from users and provide them with compilers, programming assistance, software testing tools, and operation assistance.
Natural Language Processing Technology is Preferred by No-Code AI Tools Users
| Segment | Natural Language Processing |
|---|---|
| Market Share % (2025) | 43.3% |
Natural language processing (NLP) is a technology that is widely implemented in chatbots, language translators, and voice assistants. Chatbots and translators are being widely implemented by companies for their websites and internal use. For instance,
Healthcare Industry is Looking for Advanced No-code AI Builders
AI is being implemented in the healthcare sector to improve healthcare services and operations. Implementation of AI includes algorithms to identify patients’ health conditions, several operations such as booking appointments & filling prescriptions, and patient identification to increase the speed of tasks.
AI implementation can help healthcare workers automate or accelerate tasks that are time-consuming, simple, and require high effort. Also, AI can assist them to improve services for patients. For instance,
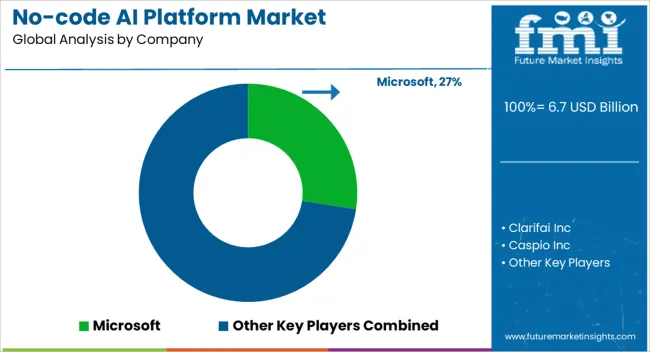
No-code AI platform developers are striving to provide several solution development tools to non-programmers. A few others are launching their platforms equipped with various features for multiple operations or specific purposes. For instance,
Google AutoML, Amazon Sagemaker, Microsoft Lobe: 3 No-code AI Platforms at the Forefront
Considering the need for non-AI experts to test their ideas and processes, many companies are now offering easy-to-access platforms. Google, Amazon, and Lobe are among the leading companies in the no-code AI platform space.
Google’s AutoML enables developers who have limited machine learning expertise to build high-quality models that pertain to their businesses. Additionally, Google announced the launch of this product in 2020 and since then, it has become one of the highly preferred platforms for non-AI experts.
The focus of Google is to develop a unique platform that requires minimal technical expertise. Therefore, it is building its product in such a way that it requires less coding. For instance,
The platform is compatible with 22 compliance programs such as PCI, HIPPA, and FedRAMP. It is currently being used by leading companies such as Aurora, AstraZeneca, Celgene, Lenovo, Hyundai, and Roche.
Amazon is also partnering with many artificial intelligence providers to drive innovation. For instance, Observe.AI is using the Amazon Sagemaker to build an intelligence workforce platform. Microsoft Lobe is another key platform in the no-code AI space.
The platform offers pre-built project templates such as image classification, object detection, and data classification. Lobe.ai was an individual entity and was bought by Microsoft in 2020.
| Attribute | Details |
|---|---|
| Estimated Market Size (2025) | USD 6.7 billion |
| Projected Market Valuation (2035) | USD 72.9 billion |
| Value-based CAGR (2025 to 2035) | 26.9% |
| Forecast Period | 2025 to 2035 |
| Historical Data Available for | 2020 to 2025 |
| Market Analysis | Value (USD million) |
| Key Regions Covered | North America, Latin America, Europe, South Asia & Pacific, East Asia, and the Middle East & Africa |
| Key Countries Covered | The United States, Canada, Germany, The United Kingdom, France, Italy, Spain, Russia, China, Japan, South Korea, India, Australia & New Zealand, GCC Countries, and South Africa |
| Key Segments Covered | Solution, Technology, Enterprise Size, Industry, and Region |
| Key Companies Profiled | Clarifai Inc; Caspio Inc; Google; Amazon; Microsoft; Akkio Inc; Apteo; Runway; QuickBase Inc; AgilePoint Inc; MonkeyLearn; Levity; Intersect Labs; Apple; DataRobot Inc |
| Report Coverage | Market Forecast, Company Share Analysis, Competition Intelligence, Drivers, Restraints, Opportunities and Threats Analysis, Market Dynamics and Challenges, and Strategic Growth Initiatives |
The global no-code ai platform market is estimated to be valued at USD 6.7 billion in 2025.
The market size for the no-code ai platform market is projected to reach USD 72.9 billion by 2035.
The no-code ai platform market is expected to grow at a 26.9% CAGR between 2025 and 2035.
The key product types in no-code ai platform market are no-code ai tools, _cloud-based, _on-premises, services, _professional services and _managed services.
In terms of technology, natural language processing (nlp) segment to command 35.0% share in the no-code ai platform market in 2025.


Our Research Products

The "Full Research Suite" delivers actionable market intel, deep dives on markets or technologies, so clients act faster, cut risk, and unlock growth.

The Leaderboard benchmarks and ranks top vendors, classifying them as Established Leaders, Leading Challengers, or Disruptors & Challengers.

Locates where complements amplify value and substitutes erode it, forecasting net impact by horizon

We deliver granular, decision-grade intel: market sizing, 5-year forecasts, pricing, adoption, usage, revenue, and operational KPIs—plus competitor tracking, regulation, and value chains—across 60 countries broadly.

Spot the shifts before they hit your P&L. We track inflection points, adoption curves, pricing moves, and ecosystem plays to show where demand is heading, why it is changing, and what to do next across high-growth markets and disruptive tech

Real-time reads of user behavior. We track shifting priorities, perceptions of today’s and next-gen services, and provider experience, then pace how fast tech moves from trial to adoption, blending buyer, consumer, and channel inputs with social signals (#WhySwitch, #UX).

Partner with our analyst team to build a custom report designed around your business priorities. From analysing market trends to assessing competitors or crafting bespoke datasets, we tailor insights to your needs.
Supplier Intelligence
Discovery & Profiling
Capacity & Footprint
Performance & Risk
Compliance & Governance
Commercial Readiness
Who Supplies Whom
Scorecards & Shortlists
Playbooks & Docs
Category Intelligence
Definition & Scope
Demand & Use Cases
Cost Drivers
Market Structure
Supply Chain Map
Trade & Policy
Operating Norms
Deliverables
Buyer Intelligence
Account Basics
Spend & Scope
Procurement Model
Vendor Requirements
Terms & Policies
Entry Strategy
Pain Points & Triggers
Outputs
Pricing Analysis
Benchmarks
Trends
Should-Cost
Indexation
Landed Cost
Commercial Terms
Deliverables
Brand Analysis
Positioning & Value Prop
Share & Presence
Customer Evidence
Go-to-Market
Digital & Reputation
Compliance & Trust
KPIs & Gaps
Outputs
Full Research Suite comprises of:
Market outlook & trends analysis
Interviews & case studies
Strategic recommendations
Vendor profiles & capabilities analysis
5-year forecasts
8 regions and 60+ country-level data splits
Market segment data splits
12 months of continuous data updates
DELIVERED AS:
PDF EXCEL ONLINE
AI Platform Market Size and Share Forecast Outlook 2025 to 2035
AI Platform Cloud Service Market Size and Share Forecast Outlook 2025 to 2035
AIOps Platform Market Forecast and Outlook 2025 to 2035
AI Trading Platform Market Forecast Outlook 2025 to 2035
AI Security Platforms Market Size and Share Forecast Outlook 2025 to 2035
AI-Powered CRM Platform Market Forecast Outlook 2025 to 2035
Online Airline Booking Platform Market Size and Share Forecast Outlook 2025 to 2035
AI-Powered Embryo Selection Market Analysis - Size, Share, and Forecast Outlook 2025 to 2035
AI Code Assistant Market Size and Share Forecast Outlook 2025 to 2035
AI-Based Data Observability Software Market Size and Share Forecast Outlook 2025 to 2035
Air Fryer Paper Liners Market Size and Share Forecast Outlook 2025 to 2035
Air Struts Market Size and Share Forecast Outlook 2025 to 2035
AI-powered Wealth Management Solution Market Size and Share Forecast Outlook 2025 to 2035
Airless Paint Spray System Market Size and Share Forecast Outlook 2025 to 2035
AI Powered Software Testing Tool Market Size and Share Forecast Outlook 2025 to 2035
AI Document Generator Market Size and Share Forecast Outlook 2025 to 2035
AI in Fintech Market Size and Share Forecast Outlook 2025 to 2035
Air Caster Skids System Market Size and Share Forecast Outlook 2025 to 2035
AI-Driven HD Mapping Market Size and Share Forecast Outlook 2025 to 2035
AI-powered Spinal Surgery Market Size and Share Forecast Outlook 2025 to 2035

Thank you!
You will receive an email from our Business Development Manager. Please be sure to check your SPAM/JUNK folder too.
Chat With
MaRIA