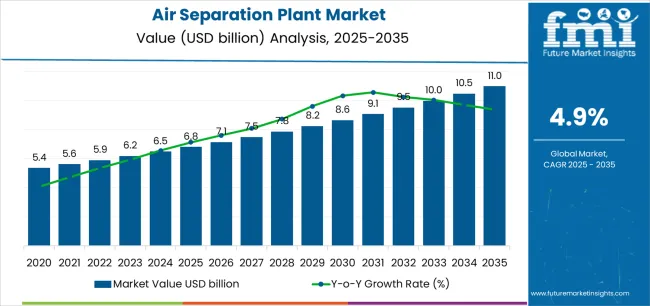
The air separation plant market stands at the threshold of a decade-long expansion trajectory that promises to reshape industrial gas production technology and process optimization solutions. The market's journey from USD 6.8 billion in 2025 to USD 11 billion by 2035 represents substantial growth, demonstrating the accelerating adoption of advanced separation technology and industrial gas supply optimization across steel manufacturing facilities, chemical production operations, and healthcare infrastructure sectors.
The first half of the decade (2025-2030) will witness the market climbing from USD 6.8 billion to approximately USD 8.6 billion, adding USD 1.8 billion in value, which constitutes 43% of the total forecast growth period. This phase will be characterized by the rapid adoption of cryogenic separation systems, driven by increasing steel production volumes and the growing need for high-purity industrial gas solutions worldwide. Enhanced separation capabilities and automated process control systems will become standard expectations rather than premium options.
The latter half (2030-2035) will witness continued growth from USD 8.6 billion to USD 11 billion, representing an addition of USD 2.4 billion or 57% of the decade's expansion. This period will be defined by mass market penetration of energy-efficient separation technologies, integration with comprehensive industrial gas management platforms, and seamless compatibility with existing manufacturing infrastructure. The market trajectory signals fundamental shifts in how industrial facilities approach gas production and supply management, with participants positioned to benefit from growing demand across multiple plant types and capacity segments.
| Period | Primary Revenue Buckets | Share | Notes |
|---|---|---|---|
| Today | New plant construction & engineering | 42% | Capex-led, capacity-driven investments |
| On-site plant operations (BOO/BOT) | 28% | Long-term supply contracts, integrated models | |
| Plant upgrades & capacity expansions | 16% | Efficiency enhancement, output optimization | |
| Spare parts & maintenance services | 14% | Compressors, cold boxes, control systems | |
| Future (3-5 yrs) | Modular & scalable ASU systems | 38-42% | Rapid deployment, Industry 4.0 integration |
| Digital monitoring & optimization | 18-22% | Real-time efficiency tracking, predictive maintenance | |
| Energy-as-a-service models | 15-19% | Performance guarantees, energy optimization | |
| High-purity specialty gases | 12-16% | Electronics, medical applications | |
| Decarbonization & hydrogen services | 8-12% | Low-carbon steel, hydrogen production support | |
| Data & analytics services | 5-8% | Benchmarking for industrial operators |
| Metric | Value |
|---|---|
| Market Value (2025) | USD 6.8 billion |
| Market Forecast (2035) | USD 11 billion |
| Growth Rate | 4.9% CAGR |
| Leading Technology | Cryogenic Air Separation |
| Primary Application | Iron & Steel Segment |
The market demonstrates strong fundamentals with Cryogenic Air Separation capturing a dominant 60.2% share through advanced separation capabilities and industrial gas production optimization. Iron & Steel applications drive primary demand with 28% market share, supported by increasing steel production capacity and oxygen enrichment requirements. Geographic expansion remains concentrated in developed markets with established industrial infrastructure, while emerging economies show accelerating adoption rates driven by manufacturing expansion initiatives and rising purity standards.
Primary Classification: The market segments by plant type into Cryogenic Air Separation, PSA (Pressure Swing Adsorption), VPSA (Vacuum PSA), and Membrane Separation, representing the evolution from basic separation equipment to sophisticated production solutions for comprehensive industrial gas supply optimization.
Secondary Classification: Gas output segmentation divides the market into Oxygen, Nitrogen, Argon, and Others (rare gases mix) sectors, reflecting distinct requirements for industrial applications, purity levels, and production volume standards.
Tertiary Classification: End-use industry segmentation spans Iron & Steel, Chemicals, Healthcare, Oil & Gas, Food & Beverage, Electronics, and Pulp & Paper, while capacity classification covers plants with less than 100 TPD, 100-400 TPD, 400-1,000 TPD, and above 1,000 TPD production capabilities.
Regional Classification: Geographic distribution covers North America, Latin America, Western Europe, Eastern Europe, East Asia, South Asia Pacific, and Middle East & Africa, with developed markets leading adoption while emerging economies show accelerating growth patterns driven by industrial manufacturing expansion programs.
The segmentation structure reveals technology progression from standard separation equipment toward sophisticated production systems with enhanced efficiency and automation capabilities, while application diversity spans from steel manufacturing facilities to healthcare operations requiring precise gas separation solutions.
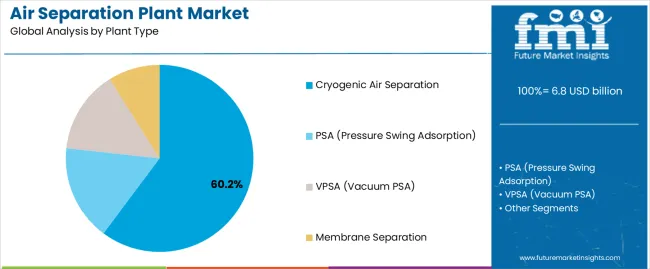
Market Position: Cryogenic air separation systems command the leading position in the air separation plant market with 60.2% market share through advanced separation features, including superior gas purity, operational efficiency, and industrial production optimization that enable manufacturing facilities to achieve optimal gas quality across diverse steel production and chemical manufacturing environments.
Value Drivers: The segment benefits from industrial facility preference for reliable separation systems that provide consistent gas purity performance, high production capacity, and operational efficiency optimization without requiring significant infrastructure modifications. Advanced design features enable automated process control systems, multi-product output capabilities, and integration with existing industrial equipment, where operational performance and gas quality represent critical facility requirements.
Competitive Advantages: Cryogenic Air Separation systems differentiate through proven operational reliability, consistent separation characteristics, and integration with automated industrial gas systems that enhance facility effectiveness while maintaining optimal purity standards suitable for diverse steel and chemical applications.
Key market characteristics:
PSA systems maintain an 18% market position in the air separation plant market due to their balanced separation properties and cost advantages. These systems appeal to facilities requiring moderate gas purity with competitive pricing for small to mid-scale industrial applications. Market growth is driven by industrial expansion, emphasizing reliable separation solutions and operational efficiency through optimized system designs.
VPSA systems capture 12% market share through specialized separation requirements in medical facilities, small-batch production, and distributed gas supply applications. These facilities demand flexible separation systems capable of handling variable load conditions while providing effective gas production capabilities and operational simplicity.
Membrane Separation systems account for 9.8% market share, including low-purity nitrogen generation, food packaging applications, and portable gas supply requiring compact separation capabilities for operational flexibility and cost optimization.
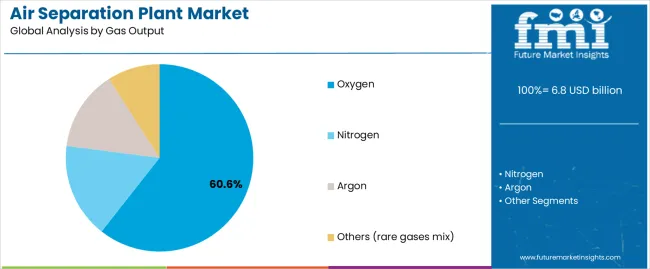
Market Context: Oxygen production demonstrates dominant market position in the air separation plant market with 60.6% market share due to widespread demand in steel manufacturing systems and comprehensive industrial applications supporting oxygen enrichment across metallurgical, chemical, and healthcare operations that maximize process efficiency while maintaining product quality.
Appeal Factors: Oxygen production operators prioritize gas purity, production volume, and integration with existing industrial infrastructure that enables coordinated supply delivery across multiple applications. The segment benefits from substantial steel industry investment and manufacturing expansion programs that emphasize the deployment of oxygen production capacity for process optimization and operational efficiency applications.
Growth Drivers: Steel production expansion programs incorporate oxygen generation as standard requirement for blast furnace operations, while healthcare growth increases demand for medical-grade oxygen capabilities that comply with purity standards and minimize supply chain complexity.
Market Challenges: High energy consumption and liquefaction requirements may limit production economics in smaller facilities or remote scenarios where nitrogen generation provides more cost-effective solutions.
Application dynamics include:
Nitrogen production captures 26% market share through widespread industrial requirements in chemical processing, food packaging operations, and electronics manufacturing applications. These facilities demand reliable nitrogen systems capable of operating with consistent purity while providing effective inerting and blanketing capabilities.
Argon production accounts for 11.4% market share through specialized requirements in metal fabrication, welding operations, and electronics manufacturing requiring inert atmosphere capabilities for operational quality and process optimization.
Other rare gases capture 2% market share through specialized separation requirements in laboratory facilities, semiconductor operations, and research applications requiring ultra-high purity gas production capabilities.
Market Context: Iron & Steel segment dominates the market with 28% market share, reflecting the primary demand source for oxygen enrichment technology in blast furnace operations and steel production processes where high-volume gas supply represents critical operational requirements.
Business Model Advantages: Iron & Steel facilities provide direct market demand for large-scale separation plants, driving technology innovation and capacity deployment while maintaining operational efficiency and production output requirements. Steel manufacturing processes require consistent oxygen supply for optimal furnace performance and metal quality.
Operational Benefits: Steel applications include blast furnace operations, basic oxygen furnace processes, and electric arc furnace systems that drive consistent demand for air separation capacity while providing access to latest production technologies. Manufacturing facilities require reliable oxygen supply to maintain continuous operations and product consistency.
Chemicals applications capture 22% market share through process requirements, chemical synthesis operations, and manufacturing facilities requiring comprehensive gas supply for operational efficiency and product quality.
Healthcare segment maintains 14% market position through medical oxygen requirements, hospital infrastructure systems, and emergency response operations requiring reliable gas supply for patient care and clinical effectiveness.
Oil & Gas facilities account for 12% market share through refinery operations, enhanced oil recovery requirements, and gas processing systems demanding industrial gas supply for process optimization and operational efficiency.
Food & Beverage segment captures 10% market share through modified atmosphere packaging, food freezing requirements, and beverage carbonation operations requiring controlled gas environments for product preservation and quality maintenance.
Electronics facilities account for 7% market share through semiconductor manufacturing, display production requirements, and clean room operations demanding ultra-high purity gas supply for process control and product quality.
Pulp & Paper segment captures 7% market share through delignification processes, bleaching operations, and effluent treatment requiring oxygen supply for chemical processing and environmental compliance.
Market Position: Plants above 1,000 TPD capacity command significant market position with 35% share through large-scale production capabilities that meet high-volume industrial demand and integrated steel manufacturing requirements.
Value Drivers: This capacity segment provides economies of scale and operational efficiency advantages, meeting requirements for major steel complexes, large chemical parks, and industrial gas merchant suppliers without excessive capital intensity or operational complexity.
Growth Characteristics: The segment benefits from steel industry consolidation, centralized gas production strategies, and long-term supply contract models that support widespread adoption and operational efficiency.
Plants with 400-1,000 TPD capacity maintain 32% market share through balanced production scale and operational flexibility suitable for medium-sized industrial complexes and regional gas supply applications.
Plants with 100-400 TPD capacity capture 23% market share through mid-scale production requirements in distributed manufacturing, smaller chemical facilities, and regional merchant gas operations.
Plants below 100 TPD capacity account for 10% market share through on-site generation requirements, remote industrial facilities, and specialized applications demanding compact production capabilities.
| Category | Factor | Impact | Why It Matters |
|---|---|---|---|
| Driver | Steel production growth & blast furnace oxygen demand | ★★★★★ | High-volume oxygen consumption in steel-making requires dedicated ASU capacity; every new integrated mill drives large cryogenic plant investment. |
| Driver | Healthcare infrastructure expansion & medical oxygen requirements | ★★★★★ | Post-pandemic focus on oxygen security; hospitals and emergency systems mandate reliable on-site or nearby ASU capacity with backup capabilities. |
| Driver | Chemical industry expansion & specialty gas requirements | ★★★★☆ | Chemical synthesis, petrochemical cracking, and specialty manufacturing need consistent nitrogen/argon supply; long-term contracts drive ASU builds. |
| Restraint | High capital investment & long payback periods | ★★★★☆ | Large cryogenic plants require USD 50-200 million investments; small manufacturers defer builds; increases reliance on merchant gas suppliers. |
| Restraint | Energy-intensive operations & power cost volatility | ★★★★☆ | Cryogenic separation consumes significant electricity; power price fluctuations impact operating economics and plant utilization rates. |
| Trend | Industry 4.0 integration & digital optimization | ★★★★★ | Real-time monitoring, AI-driven process optimization, and predictive maintenance transform operations; digital twins become standard for new plants. |
| Trend | Decarbonization & low-carbon steel production | ★★★★☆ | Hydrogen-based steel-making and oxy-fuel combustion require modified ASU designs; carbon capture integration drives next-generation plant specifications. |
The air separation plant market demonstrates varied regional dynamics with Growth Leaders including China (5.7% growth rate) and India (5% growth rate) driving expansion through steel manufacturing initiatives and industrial capacity development. Steady Performers encompass South Korea (4.3% growth rate), Canada (3.8% growth rate), and developed regions, benefiting from established industrial infrastructure and specialty gas adoption. Emerging Markets feature United States (3.7% growth rate) and developed regions, where manufacturing reshoring and hydrogen production initiatives support consistent growth patterns.
Regional synthesis reveals Asian markets leading adoption through steel expansion and chemical manufacturing development, while North American countries maintain steady expansion supported by industrial reshoring and low-carbon fuel projects. European markets show moderate growth driven by chemical park modernization and decarbonization pilot applications.
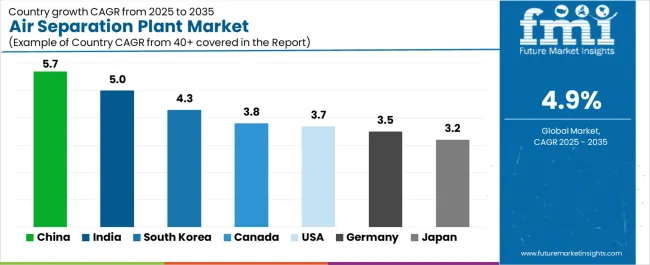
| Region/Country | 2025-2035 Growth | How to win | What to watch out |
|---|---|---|---|
| China | 5.7% | Lead with large cryogenic plants | Policy shifts; overcapacity risks |
| India | 5% | Focus on healthcare + steel | Infrastructure gaps; payment cycles |
| South Korea | 4.3% | Provide ultra-high purity systems | Technology refresh cycles; competition |
| United States | 3.7% | Offer modular + hydrogen-ready | Permitting delays; utility costs |
| Canada | 3.8% | Target mining + LNG projects | Remote logistics; skilled labor |
| Germany | 3.5% | Push efficiency retrofits | Over-engineering; regulatory complexity |
| Japan | 3.2% | Focus on replacement cycles | Aging workforce; conservative adoption |
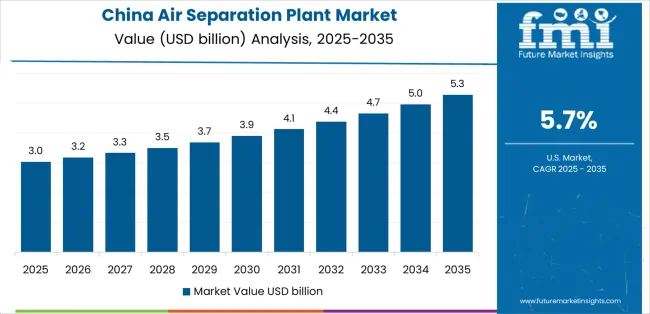
China establishes fastest market growth through aggressive steel manufacturing programs and comprehensive industrial capacity development, integrating advanced air separation plants as standard components in integrated steel mills and chemical production installations. The country's 5.7% growth rate reflects government initiatives promoting industrial self-sufficiency and manufacturing capabilities that mandate the use of large-scale separation systems in steel and chemical facilities. Growth concentrates in major industrial regions, including Hebei, Jiangsu, and Shandong, where steel production showcases integrated cryogenic systems that appeal to steel operators seeking advanced oxygen supply capabilities and production optimization applications.
Chinese manufacturers are developing cost-effective separation solutions that combine domestic engineering advantages with advanced operational features, including automated control systems and enhanced efficiency capabilities. Distribution channels through industrial equipment suppliers and engineering service providers expand market access, while government support for steel production supports adoption across diverse manufacturing and chemical segments.
Strategic Market Indicators:
In Mumbai, Delhi, and Hyderabad, steel facilities and chemical plants are implementing advanced air separation plants as standard equipment for production optimization and gas supply applications, driven by increasing government manufacturing investment and industrial expansion programs that emphasize the importance of oxygen production capabilities. The market holds a 5% growth rate, supported by government steel production initiatives and healthcare infrastructure development programs that promote advanced separation systems for industrial and medical facilities. Indian operators are adopting separation systems that provide consistent operational performance and supply reliability features, particularly appealing in urban regions where production efficiency and healthcare access represent critical operational requirements.
Market expansion benefits from growing steel manufacturing capabilities and international technology partnerships that enable domestic production of advanced separation systems for industrial and healthcare applications. Technology adoption follows patterns established in industrial infrastructure, where reliability and performance drive procurement decisions and operational deployment.
Market Intelligence Brief:
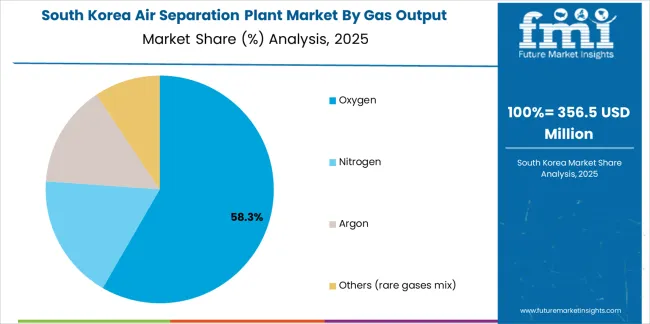
South Korea's advanced manufacturing technology market demonstrates sophisticated air separation plant deployment with documented operational effectiveness in semiconductor fabrication and specialty gas applications through integration with existing production systems and industrial infrastructure. The country leverages engineering expertise in electronics manufacturing and ultra-high purity gas systems to maintain a 4.3% growth rate. Industrial centers, including Gyeonggi, North Chungcheong, and South Gyeongsang, showcase premium installations where separation plants integrate with comprehensive manufacturing platforms and facility management systems to optimize production operations and gas purity effectiveness.
Korean manufacturers prioritize system precision and international standards in separation plant development, creating demand for premium systems with advanced features, including facility monitoring integration and automated purity control systems. The market benefits from established semiconductor technology infrastructure and a willingness to invest in advanced gas production technologies that provide long-term operational benefits and compliance with international manufacturing standards.
Market Intelligence Brief:
United States establishes market leadership through comprehensive manufacturing programs and advanced industrial infrastructure development, integrating air separation plants across steel, chemical, and energy applications. The country's 3.7% growth rate reflects established industrial relationships and mature separation technology adoption that supports widespread use of cryogenic systems in integrated manufacturing facilities. Growth concentrates in major industrial centers, including Texas, Louisiana, and the Midwest, where chemical complexes showcase mature separation deployment that appeals to industrial operators seeking proven gas supply capabilities and operational efficiency applications.
American equipment providers leverage established engineering networks and comprehensive service capabilities, including commissioning programs and maintenance support that create customer relationships and operational advantages. The market benefits from mature industrial standards and safety requirements that mandate separation plant use while supporting technology advancement and operational optimization.
Market Intelligence Brief:
Canada's market expansion benefits from diverse industrial demand, including mining operations in Ontario and Quebec, LNG projects in British Columbia, and metal production facilities that increasingly incorporate separation solutions for oxygen supply applications. The country maintains a 3.8% growth rate, driven by resource extraction activity and increasing recognition of on-site gas production benefits, including supply security and enhanced operational efficiency.
Market dynamics focus on reliable separation solutions that balance advanced operational performance with remote deployment considerations important to Canadian resource operators. Growing LNG infrastructure creates continued demand for modern separation systems in new energy projects and industrial facility installations.
Strategic Market Considerations:
Germany's advanced chemical technology market demonstrates sophisticated air separation plant deployment with documented operational effectiveness in chemical park applications and industrial gas supply through integration with existing production systems and facility infrastructure. The country leverages engineering expertise in chemical processing and energy efficiency to maintain a 3.5% growth rate. Industrial centers, including North Rhine-Westphalia, Bavaria, and Baden-Württemberg, showcase premium installations where separation plants integrate with comprehensive chemical platforms and facility management systems to optimize production operations and gas supply effectiveness.
German manufacturers prioritize system efficiency and EU compliance in separation plant development, creating demand for premium systems with advanced features, including facility monitoring integration and automated energy management systems. The market benefits from established chemical technology infrastructure and a willingness to invest in advanced separation technologies that provide long-term operational benefits and compliance with international environmental standards.
Market Intelligence Brief:
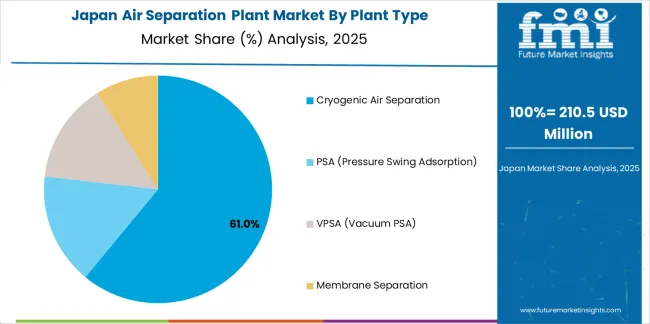
Japan's market development emphasizes aging plant replacement and efficiency enhancement, driven by LNG import growth and specialty gas requirements for pharmaceutical and electronics manufacturing. The country maintains a 3.2% growth rate, supported by quality standards for industrial gas supply and reliability requirements for critical applications that drive separation plant upgrades.
Market characteristics include preference for proven reliability, conservative technology adoption patterns, and emphasis on long-term plant performance that appeal to Japanese industrial operators prioritizing operational continuity and supply security.
Strategic Market Indicators:
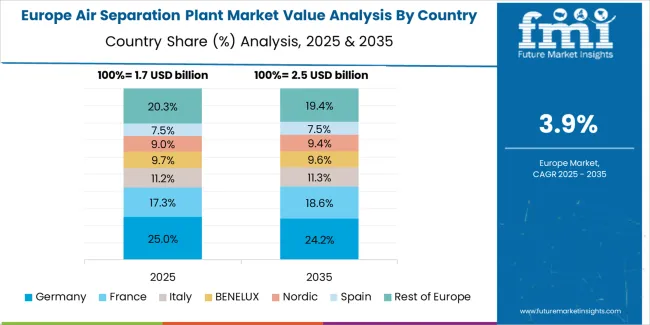
The Europe air separation plant market is estimated at USD 1.8 billion in 2025 and projected to reach USD 2.9 billion by 2035, registering a CAGR of 5% over the forecast period. Germany leads with a 23.5% market share in 2025, easing to 23.2% by 2035 as chemical park retrofits and low-carbon steel pilots sustain large cryogenic builds. France holds 18.8% in 2025, rising to 19.2% on pharma/healthcare gases and hydrogen-adjacent ASUs. The United Kingdom stands at 17.1% in 2025, edging to 17.3% with industrial decarbonization, data center growth, and BOO oxygen/nitrogen projects. Italy moves from 12.7% to 12.9% via steel/petrochemical expansions and merchant liquid capacity. Spain increases from 10.4% to 10.7% on LNG/regas corridors and food processing demand. Rest of Europe shifts from 17.5% to 16.7%, supported by Nordic energy-intensive industries and Eastern Europe's ASU replacements and new builds.
| Stakeholder | What they actually control | Typical strengths | Typical blind spots |
|---|---|---|---|
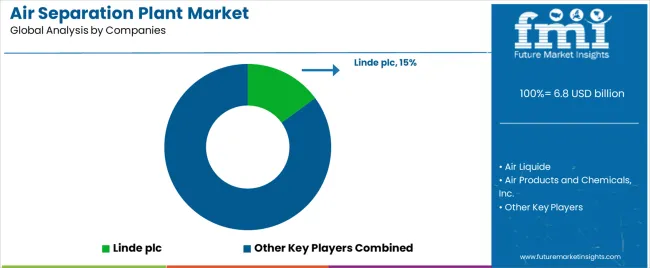
| Global platforms | Engineering reach, comprehensive gas portfolios, global service networks | Broad capabilities, proven reliability, multi-region execution | Technology refresh cycles; emerging market financing |
| Technology innovators | R&D capabilities; modular systems; digital interfaces | Latest features first; attractive energy economics | Service density outside core regions; customization complexity |
| Regional specialists | Local compliance, rapid mobilization, nearby engineering | Close-to-site support; pragmatic pricing; local regulations | Technology gaps; talent retention challenges |
| Service-focused ecosystems | BOO/BOT contracts, maintenance programs, gas supply | Lowest total cost; comprehensive support | Service costs if overpromised; technology obsolescence |
| Niche specialists | Specialized applications, custom designs, ultra-high purity | Win semiconductor/medical applications; flexible configurations | Scalability limitations; narrow market focus |
| Item | Value |
|---|---|
| Quantitative Units | USD Billion |
| Plant Type | Cryogenic Air Separation, PSA (Pressure Swing Adsorption), VPSA (Vacuum PSA), Membrane Separation |
| Gas Output | Oxygen, Nitrogen, Argon, Others (rare gases mix) |
| End-Use Industry | Iron & Steel, Chemicals, Healthcare, Oil & Gas, Food & Beverage, Electronics, Pulp & Paper |
| Capacity (TPD) | <100 TPD, 100-400 TPD, 400-1,000 TPD, >1,000 TPD |
| Regions Covered | North America, Latin America, Western Europe, Eastern Europe, East Asia, South Asia Pacific, Middle East & Africa |
| Countries Covered | United States, China, Germany, India, United Kingdom, Japan, South Korea, Canada, France, Spain, Italy, and 25+ additional countries |
| Key Companies Profiled | Linde plc, Air Liquide, Air Products and Chemicals Inc., Taiyo Nippon Sanso (Nippon Sanso Holdings), Messer Group, Yingde Gases, Hangyang, AMCS Corporation, Technex, Universal Industrial Gases (UIG) |
| Additional Attributes | Dollar sales by plant type and capacity categories, regional adoption trends across East Asia, South Asia Pacific, and North America, competitive landscape with industrial gas producers and engineering contractors, industrial operator preferences for gas purity control and system reliability, integration with manufacturing platforms and process monitoring systems, innovations in separation technology and energy efficiency enhancement, and development of modular plant solutions with enhanced performance and operational optimization capabilities. |
The global air separation plant market is estimated to be valued at USD 6.8 billion in 2025.
The market size for the air separation plant market is projected to reach USD 11.0 billion by 2035.
The air separation plant market is expected to grow at a 4.9% CAGR between 2025 and 2035.
The key product types in air separation plant market are cryogenic air separation, psa (pressure swing adsorption), vpsa (vacuum psa) and membrane separation.
In terms of gas output, oxygen segment to command 60.6% share in the air separation plant market in 2025.


Full Research Suite comprises of:
Market outlook & trends analysis
Interviews & case studies
Strategic recommendations
Vendor profiles & capabilities analysis
5-year forecasts
8 regions and 60+ country-level data splits
Market segment data splits
12 months of continuous data updates
DELIVERED AS:
PDF EXCEL ONLINE
Aircraft Flight Control System Market Size and Share Forecast Outlook 2025 to 2035
Airborne Radar Market Size and Share Forecast Outlook 2025 to 2035
Aircraft Electric Motor Market Forecast Outlook 2025 to 2035
Airport Ground Transportation Market Forecast and Outlook 2025 to 2035
Airless Sprayer Accessories Market Size and Share Forecast Outlook 2025 to 2035
Air Purge Valve Market Size and Share Forecast Outlook 2025 to 2035
Air Flow Sensors Market Size and Share Forecast Outlook 2025 to 2035
Air Cooled Turbo Generators Market Size and Share Forecast Outlook 2025 to 2035
Aircraft Cooling Turbines Market Size and Share Forecast Outlook 2025 to 2035
Air Conditioning Compressor Market Size and Share Forecast Outlook 2025 to 2035
Air Measuring Equipment Market Size and Share Forecast Outlook 2025 to 2035
Aircraft Smoke Detection and Fire Extinguishing System Market Size and Share Forecast Outlook 2025 to 2035
Aircraft Hose Fittings Market Size and Share Forecast Outlook 2025 to 2035
Aircraft Cabin Interior Market Size and Share Forecast Outlook 2025 to 2035
Aircraft Galley Systems Market Size and Share Forecast Outlook 2025 to 2035
Aircraft Interior Lighting Market Size and Share Forecast Outlook 2025 to 2035
Aircraft Battery Market Size and Share Forecast Outlook 2025 to 2035
Aircraft Floor Panels Market Size and Share Forecast Outlook 2025 to 2035
Aircraft Fuel Systems Market Size and Share Forecast Outlook 2025 to 2035
Aircraft Lubricant Market Size and Share Forecast Outlook 2025 to 2035

Thank you!
You will receive an email from our Business Development Manager. Please be sure to check your SPAM/JUNK folder too.
Chat With
MaRIA