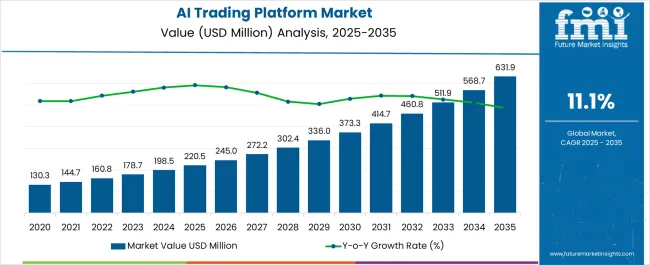
The AI Trading Platform market is experiencing strong growth, driven by the increasing adoption of advanced algorithms, machine learning, and artificial intelligence in financial markets. Trading efficiency, risk mitigation, and predictive analytics are being significantly enhanced through AI-driven decision-making capabilities. The demand is being supported by the growing need for faster, more accurate execution of trades and the integration of real-time market data analysis to support high-frequency and algorithmic trading strategies.
Financial institutions are increasingly investing in platforms that allow automation of trading decisions, reduce human error, and improve portfolio management outcomes. The rising complexity of financial markets, coupled with increasing transaction volumes, is further accelerating adoption.
Regulatory compliance, data security, and risk management requirements are driving the development of secure and scalable platforms As technology continues to evolve, AI trading platforms are expected to become increasingly sophisticated, enabling both retail and institutional investors to enhance trading performance and make data-driven investment decisions while minimizing operational risks.

| Metric | Value |
|---|---|
| AI Trading Platform Market Estimated Value in (2025 E) | USD 220.5 million |
| AI Trading Platform Market Forecast Value in (2035 F) | USD 631.9 million |
| Forecast CAGR (2025 to 2035) | 11.1% |
The market is segmented by Interface Type and End User and region. By Interface Type, the market is divided into Desktop, Web Based, and App Based. In terms of End User, the market is classified into Banking And Financial Institutions, Brokers, and Others. Regionally, the market is classified into North America, Latin America, Western Europe, Eastern Europe, Balkan & Baltic Countries, Russia & Belarus, Central Asia, East Asia, South Asia & Pacific, and the Middle East & Africa.

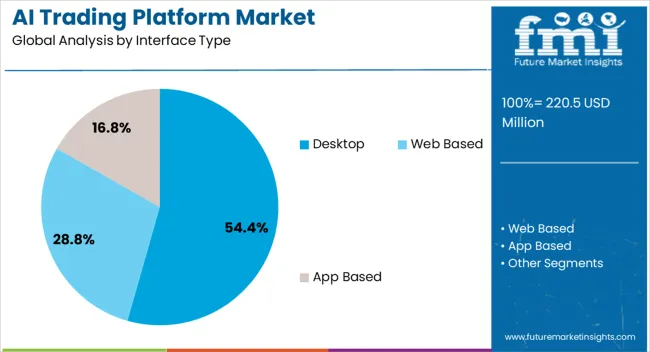
The desktop interface segment is projected to hold 54.4% of the market revenue in 2025, establishing it as the leading interface type. Growth in this segment is being driven by the high demand for robust, feature-rich trading environments that provide extensive analytical tools, charting capabilities, and real-time data feeds. Desktop platforms enable traders to access complex algorithms, back-testing functionalities, and multi-market monitoring in a stable and highly responsive environment.
The ability to integrate AI-driven insights, risk management modules, and customizable dashboards enhances decision-making efficiency. Institutional traders and professional users prefer desktop platforms for their reliability, processing power, and support for high-frequency trading activities.
As market participants increasingly focus on advanced analytics, comprehensive reporting, and automation, desktop interfaces are expected to maintain their leading position The combination of performance, scalability, and integration with AI engines ensures the segment continues to drive adoption across professional and institutional trading applications.

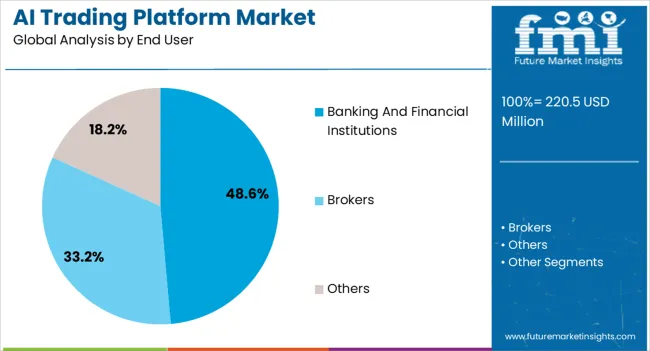
The banking and financial institutions end-user segment is anticipated to account for 48.6% of the market revenue in 2025, making it the largest end-user category. Growth in this segment is being driven by the critical need for automation, real-time analytics, and AI-enabled decision support to optimize trading performance and minimize financial risks.
Institutions are leveraging AI trading platforms to implement algorithmic trading, predictive modeling, and risk management strategies across equities, derivatives, and forex markets. Integration with existing portfolio management and compliance systems enables institutions to maintain regulatory adherence while improving operational efficiency.
The ability to process large volumes of data and execute high-speed trades with minimal latency is enhancing adoption in this segment As financial institutions continue to focus on digital transformation, AI-powered trading solutions are increasingly being deployed to enhance trading accuracy, operational resilience, and overall profitability, positioning this segment as the primary driver of market growth.
The scope for AI trading platform rose at a 10.3% CAGR between 2020 and 2025. The global market is anticipated to grow at a moderate CAGR of 11.1% over the forecast period 2025 to 2035.
The market experienced steady growth during the historical period, driven by rising adoption of AI and machine learning technologies in financial markets, and growing demand for automated trading solutions to enhance efficiency and mitigate risks.
Expansion of algorithmic trading strategies among institutional investors and trading firms, as well as advances in data analytics and alternative data sources for informed decision making are other factors that had driven the market during the historical period.
Factors such as regulatory support for FinTech innovation and AI driven trading technologies also augmented the market growth.
Market players focused on improving algorithm performance, enhancing predictive analytics capabilities, and expanding market reach through strategic partnerships and collaborations.
The forecast period is characterized by sustained growth in the AI trading platform market, propelled by several key factors such as integration of emerging technologies such as blockchain, quantum computing, and natural language processing to enhance trading platform capabilities.
Factors such as rising adoption of AI driven robo advisory services and personalized investment solutions catering to individual investor preferences are anticipated to drive the market prospects in the forthcoming years.
Expansion of high frequency trading strategies and algorithmic trading across diverse asset classes and geographic regions, is also expected to boost the market growth.
The below table showcases revenues in terms of the top 5 leading countries, spearheaded by Australia and New Zealand, and China. The countries are expected to lead the market through 2035.
| Countries | Forecast CAGRs from 2025 to 2035 |
|---|---|
| The United States | 8.0% |
| Germany | 2.6% |
| China | 11.6% |
| Japan | 3.9% |
| Australia and New Zealand | 14.6% |
The AI trading platform market in the United States expected to expand at a CAGR of 8.0% through 2035. The United States financial markets are among the largest and most sophisticated in the world, encompassing equities, fixed income, derivatives, commodities, and forex markets.
The demand for AI trading platforms is driven by the need for faster decision making, improved risk management, and enhanced trading efficiency in the dynamic and competitive market environment.
The United States is a global leader in technological innovation, with a robust ecosystem of AI research institutions, technology companies, and startups. Continuous advancements in AI and machine learning algorithms drive the development of sophisticated trading platforms that offer advanced analytics, predictive modeling, and automation capabilities.
The AI trading platform market in the Germany is anticipated to expand at a CAGR of 2.6% through 2035. Germany has a well-established regulatory framework for financial services, overseen by institutions such as BaFin.
The regulatory environment provides clarity and stability for AI trading platform providers, fostering trust and confidence among investors and ensuring compliance with regulatory requirements.
Institutional investors, including banks, asset managers, insurance companies, and pension funds, play a significant role in the German financial market.
The institutional players seek AI trading platforms equipped with advanced analytics, algorithmic trading strategies, and risk management tools to optimize investment performance and manage market risk effectively.
AI trading platform trends in China are taking a turn for the better. An 11.6% CAGR is forecast for the country from 2025 to 2035. Chinese AI trading platform providers collaborate with international counterparts, technology vendors, and financial institutions to expand their global footprint.
They address cross border trading needs. International partnerships and collaborations drive innovation, knowledge sharing, and market growth in the AI trading platform market in China.
The Chinese government has introduced regulatory reforms to promote innovation and competition in the financial services industry while ensuring market stability and investor protection.
Regulatory support for fintech initiatives and market reforms create opportunities for AI trading platform providers to expand their market presence and offerings.
The AI trading platform market in Japan is poised to expand at a CAGR of 3.9% through 2035. Japan is undergoing a digital transformation in the financial services industry, driven by factors such as changing consumer preferences, technological innovation, and regulatory initiatives.
AI trading platforms enable financial institutions to modernize their trading infrastructure, enhance customer experiences, and stay competitive in a rapidly evolving digital landscape.
Institutional investors, including banks, asset managers, insurance companies, and pension funds, play a significant role in the Japanese financial market.
The institutional players seek AI trading platforms equipped with advanced analytics, algorithmic trading strategies, and risk management tools to optimize investment performance and manage market risk effectively.
The AI trading platform market in Australia and New Zealand is anticipated to expand at a CAGR of 14.6% through 2035. Australia and New Zealand are major exporters of commodities such as minerals, agricultural products, and energy resources.
The commodities market plays a significant role in the economies of both countries, driving demand for AI trading platforms that specialize in commodity trading, price forecasting, and risk management.
Australia and New Zealand serve as strategic gateways to Asia Pacific markets, offering opportunities for cross border trading and investment.
AI trading platforms that facilitate access to regional markets, currencies, and asset classes attract investors and traders seeking diversification and growth opportunities.
The below table highlights how plastic segment is projected to lead the market in terms of material, and is expected to account for a share of 54.4% in 2025.
Based on pallet type, the block pallet segment is expected to account for a share of 48.6% in 2025.
| Category | Shares in 2025 |
|---|---|
| Desktop | 54.4% |
| Banking and Financial Institutions | 48.6% |
Based on interface type, the desktop segment is expected to continue dominating the AI trading platform market.
Desktop trading platforms often provide advanced charting and technical analysis tools that enable traders to analyze market trends, identify patterns, and make informed trading decisions.
Features such as customizable indicators, drawing tools, and multi chart layouts enhance the trading experience and attract professional traders.
Desktop based trading platforms typically offer superior performance and reliability compared to web based or mobile platforms.
Traders require fast and stable access to real time market data, advanced charting tools, and order execution capabilities, which are better served through desktop interfaces.
In terms of end use, the banking and financial institutions segment is expected to continue dominating the AI trading platform market, attributed to several key factors.
AI trading platforms leverage advanced analytics and machine learning algorithms to analyze large volumes of financial data, identify trading patterns, and generate actionable insights.
Financial institutions use these insights to make informed investment decisions, optimize trading strategies, and enhance portfolio performance.
Banking and financial institutions seek to improve operational efficiency and reduce manual processes through automation.
AI trading platforms automate various aspects of trading, including order execution, portfolio management, risk assessment, and compliance monitoring, enabling institutions to streamline operations and achieve cost savings.

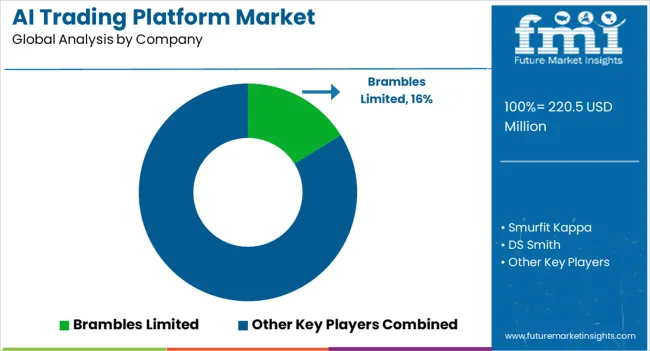
The competitive landscape of the AI trading platform market is dynamic and evolving, characterized by intense competition among a diverse array of players, including established financial institutions, technology companies, fintech startups, and specialized AI vendors.
Company Portfolio
| Attribute | Details |
|---|---|
| Estimated Market Size in 2025 | USD 198.5 million |
| Projected Market Valuation in 2035 | USD 568.8 million |
| Value-based CAGR 2025 to 2035 | 11.1% |
| Forecast Period | 2025 to 2035 |
| Historical Data Available for | 2020 to 2025 |
| Market Analysis | Value in USD million |
| Key Regions Covered | North America; Latin America; Western Europe; Eastern Europe; South Asia and Pacific; East Asia; The Middle East & Africa |
| Key Market Segments Covered | Interface Type, End User, Region |
| Key Countries Profiled | The United States, Canada, Brazil, Mexico, Germany, France, France, Spain, Italy, Russia, Poland, Czech Republic, Romania, India, Bangladesh, Australia, New Zealand, China, Japan, South Korea, GCC countries, South Africa, Israel |
| Key Companies Profiled | Smurfit Kappa; DS Smith; LESTER PACKING; Schoeller Allibert Services B.V.; Buckhorn, Inc.; ORBIS Corporation; TranPak, Inc.; PalletOne, Inc.; Dynawest Limited; Myers Industries Inc.; CABKA Group GmbH.; Palettes Gestion Services; Brambles Limited; Rehrig Pacific Company Inc. |
The global AI trading platform market is estimated to be valued at USD 220.5 million in 2025.
The market size for the AI trading platform market is projected to reach USD 631.9 million by 2035.
The AI trading platform market is expected to grow at a 11.1% CAGR between 2025 and 2035.
The key product types in AI trading platform market are desktop, web based and app based.
In terms of end user, banking and financial institutions segment to command 48.6% share in the AI trading platform market in 2025.


Full Research Suite comprises of:
Market outlook & trends analysis
Interviews & case studies
Strategic recommendations
Vendor profiles & capabilities analysis
5-year forecasts
8 regions and 60+ country-level data splits
Market segment data splits
12 months of continuous data updates
DELIVERED AS:
PDF EXCEL ONLINE
Airless Paint Spray System Market Size and Share Forecast Outlook 2025 to 2035
AI Powered Software Testing Tool Market Size and Share Forecast Outlook 2025 to 2035
AI Document Generator Market Size and Share Forecast Outlook 2025 to 2035
AI in Fintech Market Size and Share Forecast Outlook 2025 to 2035
Air Caster Skids System Market Size and Share Forecast Outlook 2025 to 2035
AI-Driven HD Mapping Market Size and Share Forecast Outlook 2025 to 2035
AI-powered Spinal Surgery Market Size and Share Forecast Outlook 2025 to 2035
AI-Powered Sleep Technologies Market Size and Share Forecast Outlook 2025 to 2035
AI-Powered Gait & Mobility Analytics Market Size and Share Forecast Outlook 2025 to 2035
AI-Powered Behavioral Therapy Market Size and Share Forecast Outlook 2025 to 2035
AI-Enabled Behavioral Therapy Market Size and Share Forecast Outlook 2025 to 2035
AI-powered In-car Assistant Market Forecast and Outlook 2025 to 2035
Airborne Molecular Contamination Control Services Market Forecast and Outlook 2025 to 2035
Airflow Balancer Market Size and Share Forecast Outlook 2025 to 2035
Aircraft Cabin Environment Sensor Market Forecast and Outlook 2025 to 2035
AI-defined Vehicle Market Forecast and Outlook 2025 to 2035
AI in Oil and Gas Market Forecast and Outlook 2025 to 2035
Aircraft Flight Control System Market Size and Share Forecast Outlook 2025 to 2035
Airborne Radar Market Size and Share Forecast Outlook 2025 to 2035
AI-driven Predictive Maintenance Market Forecast and Outlook 2025 to 2035

Thank you!
You will receive an email from our Business Development Manager. Please be sure to check your SPAM/JUNK folder too.
Chat With
MaRIA