The Data Center LV/MV Power Distribution Market is estimated to be valued at USD 3.8 billion in 2025 and is projected to reach USD 10.9 billion by 2035, registering a compound annual growth rate (CAGR) of 11.0% over the forecast period.
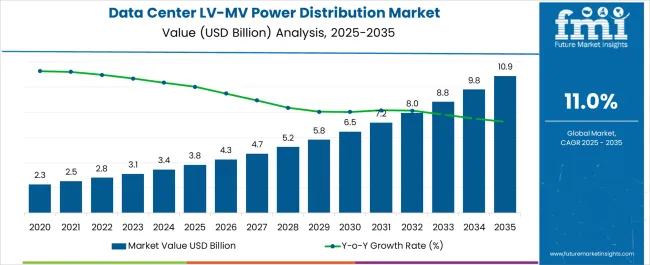
| Metric | Value |
|---|---|
| Data Center LV/MV Power Distribution Market Estimated Value in (2025 E) | USD 3.8 billion |
| Data Center LV/MV Power Distribution Market Forecast Value in (2035 F) | USD 10.9 billion |
| Forecast CAGR (2025 to 2035) | 11.0% |
The data center LV/MV power distribution market is witnessing significant growth driven by the rising global demand for digital infrastructure, cloud computing, and enterprise data services. The proliferation of hyperscale facilities and colocation centers has necessitated robust, scalable, and energy-efficient power distribution solutions capable of supporting uninterrupted operations.
The increasing complexity of IT loads and higher density environments further emphasize the need for precision-engineered LV/MV systems that ensure reliability, safety, and operational continuity. Additionally, growing adoption of AI, IoT, and 5G technologies is escalating power consumption trends, intensifying the focus on efficient power distribution architectures.
Looking ahead, market expansion is expected to be supported by heightened investments in edge computing and green data center initiatives. As operators pursue high availability and compliance with energy efficiency standards, the demand for advanced power distribution solutions is anticipated to remain strong across new and retrofitted facilities globally.
The data center LV/MV power distribution market is segmented by component and application, and geographic regions. The component of the data center LV/MV power distribution market is divided into Hardware and Services. In terms of application of the data center LV/MV power distribution market, it is classified into BFSI, Colocation, Energy, Government, Healthcare, Manufacturing, IT & Telecom, and Others. Regionally, the data center LV/MV power distribution industry is classified into North America, Latin America, Western Europe, Eastern Europe, Balkan & Baltic Countries, Russia & Belarus, Central Asia, East Asia, South Asia & Pacific, and the Middle East & Africa.
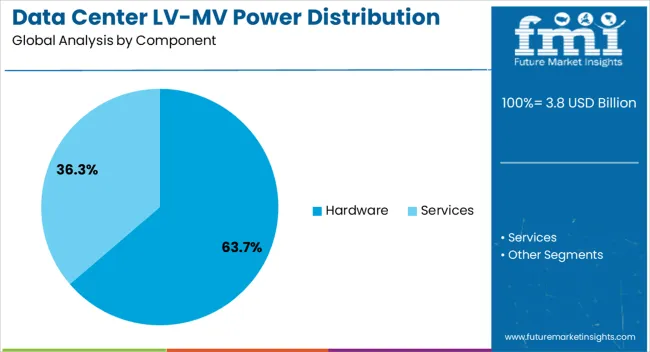
The hardware segment dominates the component category with a 63.7% share, driven by its essential role in ensuring safe, reliable, and efficient power delivery within data center environments. Hardware components such as switchgears, panel boards, busways, and PDUs are critical for managing power loads and protecting infrastructure from electrical faults.
Demand has been bolstered by the surge in construction of hyperscale and modular data centers requiring high-capacity and redundant systems. Innovations in compact and integrated power modules have improved installation flexibility and energy monitoring, aligning with space and efficiency constraints.
Additionally, the need for compliance with safety standards and the integration of intelligent features for remote management is enhancing product value. As data centers scale to accommodate larger workloads and higher uptime requirements, the hardware segment is expected to sustain its leading position through continued infrastructure investment and demand for operational resilience.
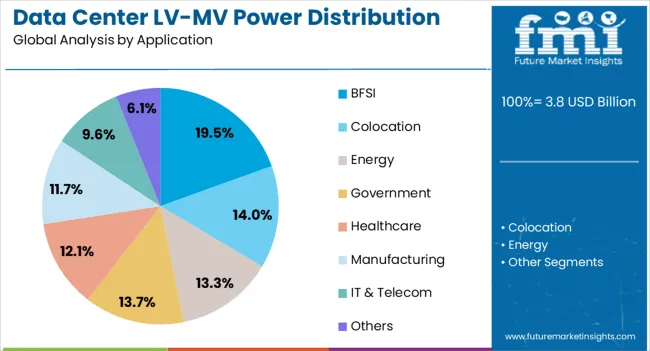
The BFSI segment holds a 19.5% share in the application category, underscoring its critical reliance on secure and uninterrupted digital operations supported by robust power infrastructure. Financial institutions are increasingly dependent on real-time processing, data storage, and online transaction systems, which demand high-availability environments with stringent power continuity.
Data centers serving BFSI entities must meet exacting standards for redundancy, security, and disaster recovery, elevating the importance of advanced LV/MV power distribution systems. Regulatory compliance and cybersecurity considerations further drive investment in resilient infrastructure that mitigates operational risk.
The rapid digital transformation within banking and insurance sectors, coupled with growing reliance on cloud-based financial services, is intensifying the need for scalable and fault-tolerant data center setups. This segment is projected to witness stable growth as BFSI institutions continue modernizing IT infrastructure and reinforcing business continuity strategies through dedicated and secure data center environments.
Data center demand for high-efficiency low- and medium-voltage (LV/MV) power distribution systems is expanding as hyperscale and edge facilities scale up. In 2024, LV/MV switchgear installations rose by approximately 1%, with lithium-tank circuit breakers and power ring mains gaining traction. Asia Pacific and North America lead deployment volumes, driven by new builds in hyperscale, colocation, and telecom edge sites. Redundancy and modular busbar formats now support quicker commissioning and simpler parallel upgrades. Cloud providers and enterprise IT groups are specifying integrated switchgear stages with digital metering, arc-flash protection, and remote diagnostics to improve uptime and power resilience.
Data centers are adopting modular MSC (medium-voltage switchgear cell) and busbar-based architectures to meet uptime targets and simplify upgrades. Deployments using ring main units increased 22 % year-on-year, offering flexible expansion via plug-in breakers and hot-swappable modules. Integrated digital metering and remote monitoring reduced site inspection cycles by 18 %, enabling real-time alerting for overcurrent or phase imbalance. Arc-flash protective relays and fault containment modules are now standard in 60 % of new large data center builds. Cloud and hyperscale deployments leverage segmented LV/MV layouts to support concurrent growth; redundant power paths (2N+1) are integrated with predictive alert systems to manage transformer health and load balancing.
High capital requirements, detailed site coordination, and strict safety validation slow deployment. LV/MV systems with digital controls, substation-grade switchgear, and arc-quenching units cost 20 % more per kVA than traditional transformer-fed layouts. Grid interconnection approvals and utility coordination often delay commissioning by 6-8 weeks, especially where MV contracts require retrofit adaptation. Hardware certification for thermal transport, enclosure ratings, and seismic stability adds another layer of validation. In smaller edge installations, legacy single-phase mains and local building codes limit configurable redundancy options. Equipment delivery lead times for specialized breakers and busbar frames in emerging regions average 10 weeks, extending project timelines and constraining flexibility in modular expansion.
| Country | CAGR |
|---|---|
| China | 14.9% |
| India | 13.8% |
| Germany | 12.7% |
| France | 11.6% |
| UK | 10.5% |
| USA | 9.4% |
| Brazil | 8.3% |
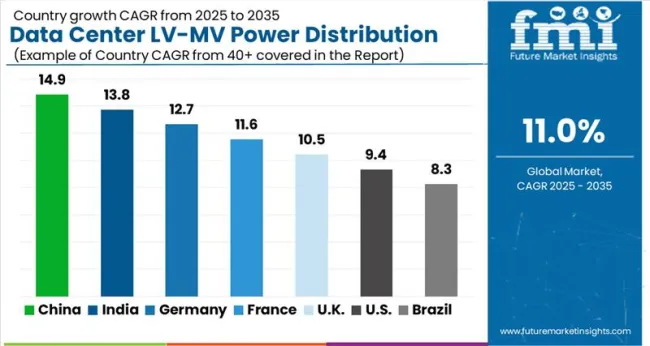
The global market for data center low- and medium-voltage power distribution is forecast to expand at an 11% CAGR from 2025 to 2035. China leads with a 14.9% rate, exceeding the global average by +35%, fueled by hyperscale data center construction and domestic equipment sourcing. India follows at 13.8% (+25%) due to rising investments in Tier III and IV facilities across urban clusters. Germany records 12.7% (+15%) as part of Europe’s colocation expansion and grid modernization. France aligns just above the average at 11.6% (+5%), while the United States lags at 9.4%, marking a -15% difference, constrained by legacy system upgrades and permitting delays. Growth differentials reflect national infrastructure policies, energy transition targets, and scale of cloud computing expansion. The report covers detailed analysis of 40+ countries, with the top five countries shared as a reference.
China's market for low and medium voltage power distribution in data centers is projected to grow at 14.9% CAGR, exceeding the global average by 35%. Hyperscale developments in Hebei, Inner Mongolia, and the Yangtze River Delta are driving large-scale procurement of modular switchgear, trunking systems, and digitally monitored LV panels. Domestic OEMs are expanding supply of gas-insulated MV gear tailored for high-density colocation hubs. Cloud service operators operating across regions are requesting LV dual-feed lines with thermal regulation and auto-transfer switching for continuous service availability.
India’s data center LV/MV power distribution market is growing at 13.8% CAGR. Rising demand in Mumbai, Hyderabad, and Chennai is focused on LV panels with harmonic suppression and load-balancing features. Data center developers are scaling deployment of RMUs and dual-feed transformers to meet Tier III and IV specifications. Modular formats with prefabricated MV enclosures are gaining ground, particularly in colocation builds. Power infrastructure for AI compute clusters is now incorporating advanced protection and filtration systems.
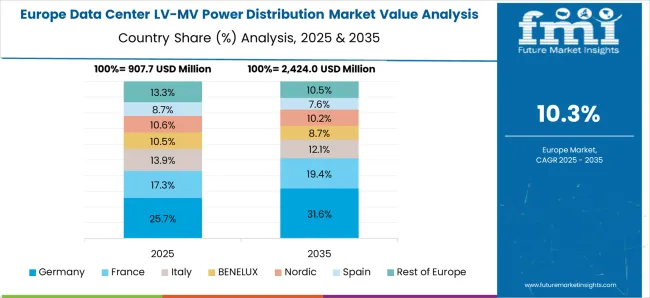
Germany’s LV/MV equipment market is projected to grow at 12.7% CAGR. Data center sites in Berlin, Frankfurt, and Munich are specifying LV bus systems with hot-swap capability, IP-67 MV gear, and diagnostics-integrated switchboards. Retrofit cycles now include replacement of older transformer units with compact solid-state modules. Split-phase LV layouts are preferred for decentralized edge clusters supporting industrial AI loads. Imports of MV switchgear with solid insulation design have grown steadily since Q1 2023.
France’s LV/MV distribution market for data infrastructure is expanding at 11.6% CAGR. Metro-area facilities in Paris, Lyon, and Marseille are deploying vacuum-interrupt MV systems, monitored busbars, and LV control cabinets with remote diagnostics. Specifications are shifting toward IP65-rated MV terminals and LV boards that include power factor correction. AI server rooms with high thermal loads are leading demand for load-share automation and modular fault isolation.
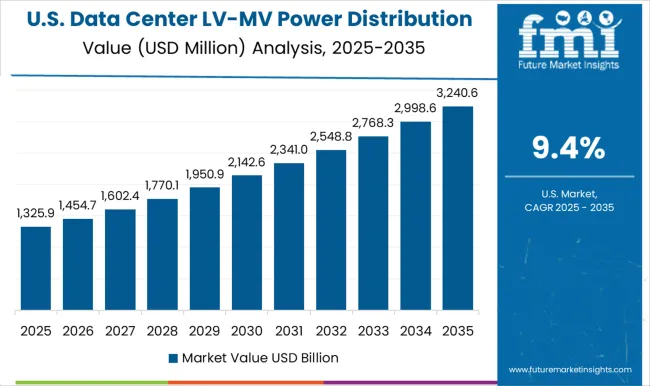
The USA market for data center LV/MV power systems is forecast to grow at 9.4% CAGR, trailing global growth. Virginia, Texas, and Ohio remain the primary zones for infrastructure upgrades. Colocation and hyperscale projects are specifying arc-resistant MV units and sectionalized LV layouts to improve resilience. LV systems with smart feeder zoning and load-shedding logic are replacing legacy gear in high-density environments. Retrofit demand is driving adoption of compact modular vaults suited to existing building envelopes.
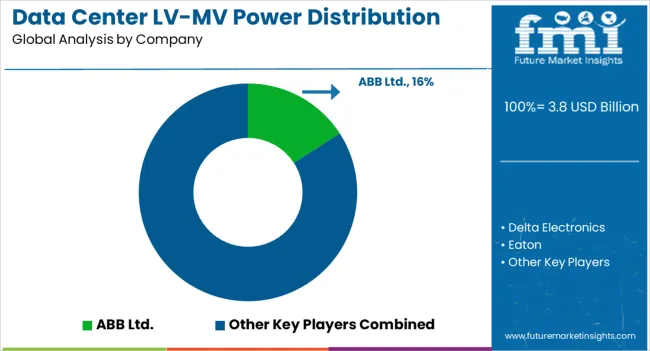
The data center LV/MV power distribution market is highly competitive, with dominant players like ABB Ltd., Schneider Electric, and Siemens AG leading through advanced switchgear, modular UPS systems, and intelligent power monitoring solutions. Key technology providers such as Eaton, GE, and Toshiba specialize in high-efficiency transformers, fault-tolerant designs, and scalable power infrastructure. Emerging innovators including Delta Electronics, HPE, and Huawei are driving digital transformation with AI-powered energy management and lithium-ion battery integration. Market growth is fueled by hyperscale data center expansion, rising renewable energy integration, and demand for 99.999% uptime reliability. Manufacturers focus on eco-efficient designs and DCIM integration, while suppliers enhance edge-compatible solutions and hybrid power systems to support next-gen data center requirements. The industry is shifting toward standardized, prefabricated power distribution modules for rapid deployment.
In 2025, ABB outlined future design shifts toward MV UPS and large power blocks. ABB has formally stated that data center power architectures are evolving away from traditional low-voltage setups toward medium-voltage UPS systems (such as HiPerGuard) and larger modular power blocks better to support rising demand in hyperscale and AI workloads.
| Item | Value |
|---|---|
| Quantitative Units | USD 3.8 Billion |
| Component | Hardware and Services |
| Application | BFSI, Colocation, Energy, Government, Healthcare, Manufacturing, IT & Telecom, and Others |
| Regions Covered | North America, Europe, Asia-Pacific, Latin America, Middle East & Africa |
| Country Covered | United States, Canada, Germany, France, United Kingdom, China, Japan, India, Brazil, South Africa |
| Key Companies Profiled | ABB Ltd., Delta Electronics, Eaton, GE, HPE, Huawei, Schneider Electric, Siemens AG, and Toshiba |
| Additional Attributes | Dollar sales by voltage tier and distribution architecture, growing deployment in hyperscale and colocation facilities, stable integration in enterprise data centers and edge sites, innovations in busway systems and intelligent PDUs enhance load balancing and power reliability under high-density workloads |
The global data center lv/mv power distribution market is estimated to be valued at USD 3.8 billion in 2025.
The market size for the data center lv/mv power distribution market is projected to reach USD 10.9 billion by 2035.
The data center lv/mv power distribution market is expected to grow at a 11.0% CAGR between 2025 and 2035.
The key product types in data center lv/mv power distribution market are hardware and services.
In terms of application, bfsi segment to command 19.5% share in the data center lv/mv power distribution market in 2025.


Our Research Products

The "Full Research Suite" delivers actionable market intel, deep dives on markets or technologies, so clients act faster, cut risk, and unlock growth.

The Leaderboard benchmarks and ranks top vendors, classifying them as Established Leaders, Leading Challengers, or Disruptors & Challengers.

Locates where complements amplify value and substitutes erode it, forecasting net impact by horizon

We deliver granular, decision-grade intel: market sizing, 5-year forecasts, pricing, adoption, usage, revenue, and operational KPIs—plus competitor tracking, regulation, and value chains—across 60 countries broadly.

Spot the shifts before they hit your P&L. We track inflection points, adoption curves, pricing moves, and ecosystem plays to show where demand is heading, why it is changing, and what to do next across high-growth markets and disruptive tech

Real-time reads of user behavior. We track shifting priorities, perceptions of today’s and next-gen services, and provider experience, then pace how fast tech moves from trial to adoption, blending buyer, consumer, and channel inputs with social signals (#WhySwitch, #UX).

Partner with our analyst team to build a custom report designed around your business priorities. From analysing market trends to assessing competitors or crafting bespoke datasets, we tailor insights to your needs.
Supplier Intelligence
Discovery & Profiling
Capacity & Footprint
Performance & Risk
Compliance & Governance
Commercial Readiness
Who Supplies Whom
Scorecards & Shortlists
Playbooks & Docs
Category Intelligence
Definition & Scope
Demand & Use Cases
Cost Drivers
Market Structure
Supply Chain Map
Trade & Policy
Operating Norms
Deliverables
Buyer Intelligence
Account Basics
Spend & Scope
Procurement Model
Vendor Requirements
Terms & Policies
Entry Strategy
Pain Points & Triggers
Outputs
Pricing Analysis
Benchmarks
Trends
Should-Cost
Indexation
Landed Cost
Commercial Terms
Deliverables
Brand Analysis
Positioning & Value Prop
Share & Presence
Customer Evidence
Go-to-Market
Digital & Reputation
Compliance & Trust
KPIs & Gaps
Outputs
Full Research Suite comprises of:
Market outlook & trends analysis
Interviews & case studies
Strategic recommendations
Vendor profiles & capabilities analysis
5-year forecasts
8 regions and 60+ country-level data splits
Market segment data splits
12 months of continuous data updates
DELIVERED AS:
PDF EXCEL ONLINE
Data Center Power Management Industry Analysis in Western Europe Size and Share Forecast Outlook 2025 to 2035
Data Center Power Management Industry Analysis in Korea Size and Share Forecast Outlook 2025 to 2035
Data Center Power Market Size and Share Forecast Outlook 2025 to 2035
Data Center Power Management Market Growth – Demand, Trends & Forecast 2025–2035
Data Center Power Management Market Insights – Demand & Growth 2024-2034
Data Center Power Solutions Market
Power Supply Equipment for Data Center Market Size and Share Forecast Outlook 2025 to 2035
On-Site Solar Power Market Growth – Trends & Forecast 2025 to 2035
Datacenter Infrastructure Services Market Size and Share Forecast Outlook 2025 to 2035
Datacenter Grid Interface Equipment Market Analysis - Size, Share, and Forecast Outlook 2025 to 2035
Data Center Market Forecast and Outlook 2025 to 2035
Data Center Automatic Transfer Switches and Switchgears Market Size and Share Forecast Outlook 2025 to 2035
Data Center Liquid Cooling Market Size and Share Forecast Outlook 2025 to 2035
Data Center RFID Market Size and Share Forecast Outlook 2025 to 2035
Data Center Accelerator Market Size and Share Forecast Outlook 2025 to 2035
Data Center Outsourcing Market Size and Share Forecast Outlook 2025 to 2035
Data Center Refrigerant Market Size and Share Forecast Outlook 2025 to 2035
Data Center Fire Detection And Suppression Market Size and Share Forecast Outlook 2025 to 2035
Data Center Security Market Size and Share Forecast Outlook 2025 to 2035
Data Center Construction Market Size and Share Forecast Outlook 2025 to 2035

Thank you!
You will receive an email from our Business Development Manager. Please be sure to check your SPAM/JUNK folder too.
Chat With
MaRIA