Data Center Power Management Industry Analysis in Western Europe Size and Share Forecast Outlook 2025 to 2035

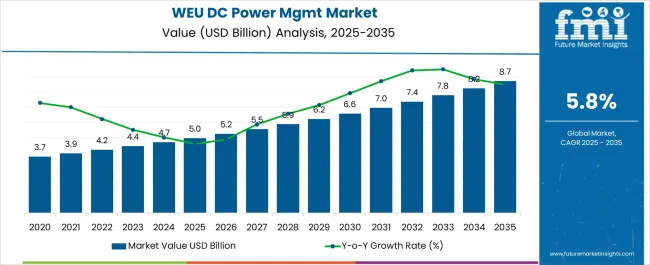
The Data Center Power Management Industry Analysis in Western Europe is estimated to be valued at USD 5.0 billion in 2025 and is projected to reach USD 8.7 billion by 2035, registering a compound annual growth rate (CAGR) of 5.8% over the forecast period.
Quick Stats for Data Center Power Management Industry Analysis in Western Europe

  • Data Center Power Management Industry Analysis in Western Europe Industry Value (2025): USD 5.0 billion
  • Data Center Power Management Industry Analysis in Western Europe Forecast Value (2035): USD 8.7 billion
  • Data Center Power Management Industry Analysis in Western Europe Forecast CAGR: 5.8%
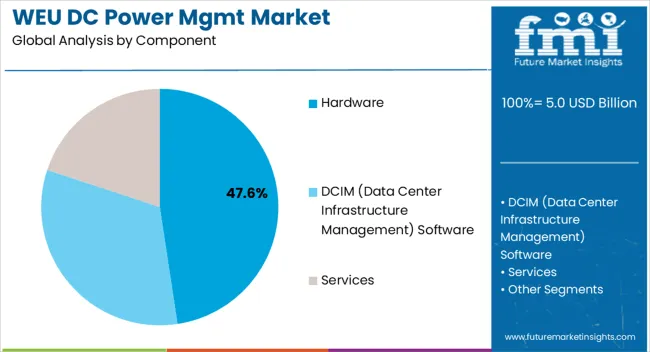
  • Leading Segment in Data Center Power Management Industry Analysis in Western Europe in 2025: Hardware (47.6%)
  • Key Growth Region in Data Center Power Management Industry Analysis in Western Europe: North America, Asia-Pacific, Europe
  • Top Key Players in Data Center Power Management Industry Analysis in Western Europe: Schneider Electric SE, Eaton Corporation, ABB Group, Vertiv Group Corp, Raritan Inc. (Legrand), Siemens AG, Riello Elettronica Group, Server Technology (Legrand), Piller Power Systems, Cyber Power Systems Inc.

Weu Dc Power Mgmt Market Market Value Analysis

Metric Value
Data Center Power Management Industry Analysis in Western Europe Estimated Value in (2025 E) USD 5.0 billion
Data Center Power Management Industry Analysis in Western Europe Forecast Value in (2035 F) USD 8.7 billion
Forecast CAGR (2025 to 2035) 5.8%

Rationale for Segmental Growth in the Data Center Power Management Industry in Western Europe

The data center power management industry in Western Europe is experiencing robust growth. Rising digital transformation, cloud adoption, and regulatory requirements for energy efficiency are driving the demand for advanced power management solutions. Current market conditions reflect significant investment in hyperscale and colocation facilities, with operators prioritizing sustainability and operational resilience.

Stricter energy regulations and carbon reduction commitments are influencing design choices and accelerating adoption of efficient hardware and software systems. Future growth will be shaped by the increasing need for power continuity, integration of renewable energy sources, and innovations in monitoring and control technologies.

The rationale for expansion is supported by the growing importance of reliable power infrastructure in ensuring uptime, the push for green data centers across the region, and the ability of advanced power management systems to reduce costs while enhancing scalability These factors collectively position the market for sustained growth and deeper penetration across both enterprise and service-provider segments.
Segmental Analysis

Insights into the Component Segment

Weu Dc Power Mgmt Market Analysis By Component

The hardware segment, representing 47.60% of the component category, is leading the market due to its essential role in maintaining power reliability and efficiency across large-scale data centers. High demand for UPS systems, switchgear, PDUs, and generators has reinforced the segment’s dominance. Hardware adoption has been supported by continuous infrastructure upgrades and the need to handle rising workloads and higher rack densities.

Innovations in modular and scalable power hardware are improving deployment flexibility and lifecycle management. Regulatory compliance and efficiency targets are also pushing investment toward advanced systems with lower energy losses and higher reliability.

As sustainability becomes a regional priority, hardware integrated with monitoring capabilities is enabling better energy optimization These advancements are expected to maintain the hardware segment’s market share while supporting modernization across hyperscale and colocation facilities.
Insights into the Data Center Type Segment

Weu Dc Power Mgmt Market Analysis By Data Center Type

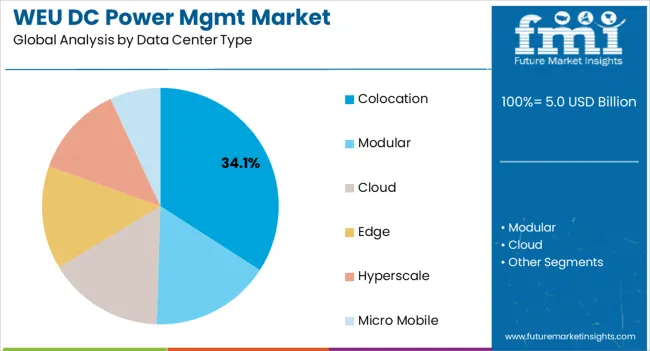
The colocation segment, accounting for 34.10% of the data center type category, has been leading due to strong enterprise outsourcing trends and cost-efficiency benefits. Businesses are increasingly relying on colocation providers to secure scalable, resilient infrastructure without the capital burden of building their own facilities.

Growth in cloud adoption, regulatory compliance needs, and rising data volumes has reinforced reliance on colocation operators. Providers have been enhancing their offerings with advanced power management solutions that ensure uptime, reduce operational risk, and improve energy efficiency.

The segment’s competitiveness has been further supported by strategic investments in renewable integration, modular expansion, and AI-enabled power monitoring With enterprises demanding flexible and sustainable options, colocation data centers are expected to continue holding significant share in the Western European market.
Insights into the Data Center Tier Segment

Weu Dc Power Mgmt Market Analysis By Data Center Tier

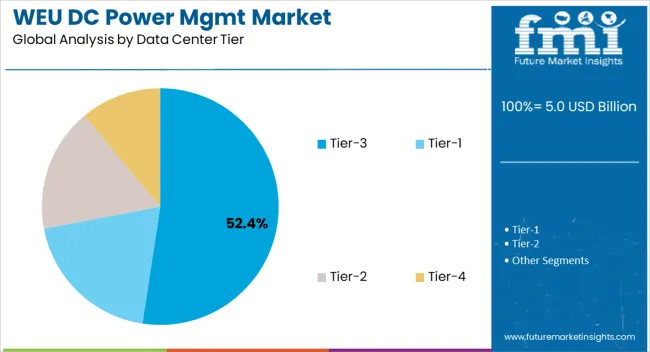
The Tier-3 category, holding 52.40% of the data center tier segment, has maintained leadership due to its balance between cost efficiency and high availability. Tier-3 facilities are designed with redundancy in critical systems, ensuring 99.982% uptime, which meets the reliability requirements of most enterprises while avoiding the higher costs associated with Tier-4 infrastructure.

Adoption has been driven by enterprises and service providers that prioritize resilience without excessive capital expenditure. Regulatory pressure for business continuity and sustainability has further encouraged investments in Tier-3 facilities equipped with advanced power management systems.

The ability of Tier-3 centers to integrate renewable energy sources, support modular scaling, and align with carbon neutrality goals has reinforced their market appeal As digital services expand and demand for dependable mid-range infrastructure grows, Tier-3 data centers are expected to retain their dominant position across the Western European market.

Top Data Center Power Management Market Dynamics and Industry Trends

  • Data center operators are continually seeking ways to enhance energy efficiency, making power management solutions that improve power usage effectiveness (PUE) and reduce energy consumption a top priority.
  • Innovative battery technologies, such as lithium-ion batteries, are gaining traction for energy storage and backup in data centers.
  • Stringent government regulations and standards related to energy efficiency and environmental impact drive the adoption of compliant power management solutions.

Analysis of Top Countries Implementing,Managing,Upgrading,and Investing in Data Center Power Management

Countries Value CAGR from 2025 to 2035
United Kingdom 9.0%
Germany 7.8%

The United Kingdom Data Center Industry Adopts Power Management Solutions for a Sustainable Future

The United Kingdom has witnessed a substantial reduction in energy consumption over the past two decades, projected to witness at a CAGR of 9.0% through 2035. The achievement can be attributed to a concerted effort toward energy efficiency, driven by a growing awareness of the environmental and economic benefits of energy conservation. Both public and private sectors in the United Kingdom have embraced initiatives focused on energy savings, significantly contributing to a decrease in overall energy use.

As data centers play a crucial role in the energy landscape, they have also been influenced by the energy efficiency drive of the country. The United Kingdom data center industry has recognized the importance of optimizing power consumption while maintaining uninterrupted service delivery. The acknowledgment has increased demand for data center power management solutions to ensure efficient energy usage and minimize waste.

Germany's Data Center Industry Adopts Advanced Solutions for Energy-efficient Operations

Germany is a critical player in the European data center landscape and, like its counterparts, places a strong emphasis on energy efficiency and sustainability. The industry in Germany is estimated to register a CAGR of 7.8% through 2035. The country has been actively promoting the responsible and efficient use of power in various sectors, and data centers are no exception.

The German data center industry recognizes the importance of reducing energy consumption, not only to minimize operational costs but also to meet strict environmental regulations and to contribute to the country overall energy-saving goals. This has increased demand for advanced data center power management solutions to monitor and optimize energy usage, resulting in more sustainable and cost-effective operations.

Data Center Power Management Industry Analysis by Top Investment Segments

The table below highlights how the modular data centers and tier-4 data centers are projected to lead the solution-segment and platform-type segments in 2025.

Category Industrial Share in 2025
Modular Data Centers 25.7%
Tier-4 Data Centers 35.9%

Modular Data Centers are Transforming the Data Landscape with Budget-friendly Solutions

The data center landscape has witnessed a surge in the popularity of modular data centers, reflecting a growing preference for a more flexible and cost-effective approach to data infrastructure. The modular data center segment is set to account for a substantial 25.7% industrial share in 2025, and this trend shows no sign of slowing down.

One of the key driving factors behind the rise of modular data centers is their inherent cost-effectiveness. These modular solutions offer a more budget-friendly alternative to traditional data centers, making them an attractive choice for organizations aiming to optimize their IT infrastructure without breaking the bank. The reduced upfront costs and lower energy requirements of modular data centers have garnered significant attention from industries looking to maximize efficiency.

Tier-4 Data Centers Emerged as the Epitome of Security and Reliability

The tier-4 segment has consistently asserted its dominance in the industry and is poised to maintain this lead during the forecast period. In 2025, the tier-4 data centers segment is projected to hold 35.9% industrial share, reflecting the growing demand for their unique capabilities.

One of the primary drivers behind the popularity of tier-4 data centers is their exceptional fault-tolerant functionality. The critical attribute sets them apart by enabling the site infrastructure to withstand unexpected failures, ensuring uninterrupted operations even in the face of unforeseen challenges. The fault-tolerant design of tier-4 data centers is a testament to their unwavering commitment to maintaining the critical load, making them a trusted choice for businesses that cannot afford downtime.
Recent Developments Shaping the Data Center Power Management Market

  • ABB Group offered energy efficiency consulting services to help data centers identify opportunities for reducing energy consumption and operating costs.
  • Siemens offered UPS systems with advanced technology to ensure continuous power supply, safeguarding data center operations against power interruptions and voltage fluctuations.

Key Data Center Power Management Market Players and Concentration

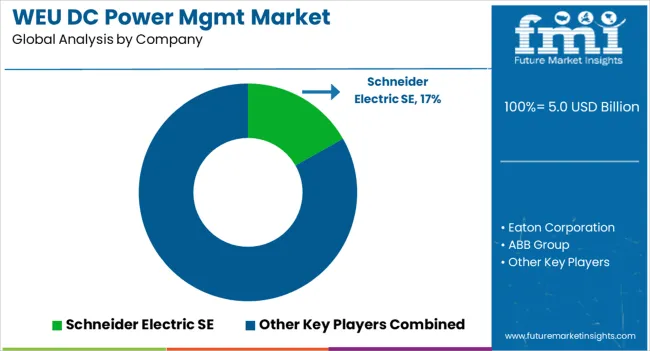
Weu Dc Power Mgmt Market Analysis By Company

  • Schneider Electric SE
  • Eaton Corporation
  • ABB Group
  • Vertiv Group Corp
  • Raritan Inc. (Legrand)
  • Siemens AG
  • Riello Elettronica Group
  • Server Technology (Legrand)
  • Piller Power Systems
  • Cyber Power Systems Inc.

Key Shifting Preferences Covered in Data Center Power Management Market Report

Attribute Details
Estimated Industry Size in 2025 USD 5.0 billion
Projected Industry Size by 2035 USD 8.7 billion
Anticipated CAGR between 2025 to 2035 5.8% CAGR
Demand Forecast for the Data Center Power Management in Western Europe 2025 to 2035
Report Coverage Industry Size, Industry Trends, Analysis of key factors influencing the Data Center Power Management in Western Europe, Insights on Global Players and their Industry Strategy in Western Europe, Ecosystem Analysis of Local and Regional Western Europe Providers
Key Countries Analyzed United Kingdom, Germany, France, The Netherlands, Italy, Spain, Rest of Western Europe
Key Companies Profiled Schneider Electric SE; Eaton Corporation; ABB Group; Vertiv Group Corp; Raritan Inc. (Legrand); Siemens AG; Riello Elettronica Group; Server Technology (Legrand); Piller Power Systems; Cyber Power Systems Inc.

Top Segments Studied in the Data Center Power Management Market Report

By Component:

  • Hardware
  • DCIM (Data Center Infrastructure Management) Software
  • Services

By Data Center Type:

  • Modular
  • Colocation
  • Cloud
  • Edge
  • Hyperscale
  • Micro Mobile

By Data Center Tier:

  • Tier-1
  • Tier-2
  • Tier-3
  • Tier-4

By Installation Type:

  • New Installation
  • Retrofit/Upgrade

By End-user:

  • Cloud Providers
  • Colocation Providers
  • Enterprise
  • Hyperscale

By Industry:

  • BFSI
  • Healthcare
  • Manufacturing
  • IT & Telecom
  • Media & Entertainment
  • Retail
  • Government
  • Others

By Country:

  • United Kingdom
  • Germany
  • France
  • Netherlands
  • Italy

Frequently Asked Questions

How big is the data center power management industry analysis in Western Europe in 2025?

The global data center power management industry analysis in Western Europe is estimated to be valued at USD 5.0 billion in 2025.

What will be the size of data center power management industry analysis in Western Europe in 2035?

The market size for the data center power management industry analysis in Western Europe is projected to reach USD 8.7 billion by 2035.

How much will be the data center power management industry analysis in Western Europe growth between 2025 and 2035?

The data center power management industry analysis in Western Europe is expected to grow at a 5.8% CAGR between 2025 and 2035.

What are the key product types in the data center power management industry analysis in western europe?

The key product types in data center power management industry analysis in Western Europe are hardware, dcim (data center infrastructure management) software and services.

Which data center type segment to contribute significant share in the data center power management industry analysis in Western Europe in 2025?

In terms of data center type, colocation segment to command 34.1% share in the data center power management industry analysis in Western Europe in 2025.

Table of Content

  1. Executive Summary
    • Global Market Outlook
    • Demand-side Trends
    • Supply-side Trends
    • Technology Roadmap Analysis
    • Analysis and Recommendations
  2. Market Overview
    • Market Coverage / Taxonomy
    • Market Definition / Scope / Limitations
  3. Market Background
    • Market Dynamics
      • Drivers
      • Restraints
      • Opportunity
      • Trends
    • Scenario Forecast
      • Demand in Optimistic Scenario
      • Demand in Likely Scenario
      • Demand in Conservative Scenario
    • Opportunity Map Analysis
    • Product Life Cycle Analysis
    • Supply Chain Analysis
    • Investment Feasibility Matrix
    • Value Chain Analysis
    • PESTLE and Porter’s Analysis
    • Regulatory Landscape
    • Regional Parent Market Outlook
    • Production and Consumption Statistics
    • Import and Export Statistics
  4. Global Analysis 2020 to 2024 and Forecast, 2025 to 2035
    • Historical Market Size Value (USD Million) Analysis, 2020 to 2024
    • Current and Future Market Size Value (USD Million) Projections, 2025 to 2035
      • Y-o-Y Growth Trend Analysis
      • Absolute $ Opportunity Analysis
  5. Global Pricing Analysis 2020 to 2024 and Forecast 2025 to 2035
  6. Global Analysis 2020 to 2024 and Forecast 2025 to 2035, By Component
    • Introduction / Key Findings
    • Historical Market Size Value (USD Million) Analysis By Component , 2020 to 2024
    • Current and Future Market Size Value (USD Million) Analysis and Forecast By Component , 2025 to 2035
      • Hardware
      • DCIM (Data Center Infrastructure Management) Software
      • Services
    • Y-o-Y Growth Trend Analysis By Component , 2020 to 2024
    • Absolute $ Opportunity Analysis By Component , 2025 to 2035
  7. Global Analysis 2020 to 2024 and Forecast 2025 to 2035, By Data Center Type
    • Introduction / Key Findings
    • Historical Market Size Value (USD Million) Analysis By Data Center Type, 2020 to 2024
    • Current and Future Market Size Value (USD Million) Analysis and Forecast By Data Center Type, 2025 to 2035
      • Colocation
      • Modular
      • Cloud
      • Edge
      • Hyperscale
      • Micro Mobile
    • Y-o-Y Growth Trend Analysis By Data Center Type, 2020 to 2024
    • Absolute $ Opportunity Analysis By Data Center Type, 2025 to 2035
  8. Global Analysis 2020 to 2024 and Forecast 2025 to 2035, By Data Center Tier
    • Introduction / Key Findings
    • Historical Market Size Value (USD Million) Analysis By Data Center Tier, 2020 to 2024
    • Current and Future Market Size Value (USD Million) Analysis and Forecast By Data Center Tier, 2025 to 2035
      • Tier-3
      • Tier-1
      • Tier-2
      • Tier-4
    • Y-o-Y Growth Trend Analysis By Data Center Tier, 2020 to 2024
    • Absolute $ Opportunity Analysis By Data Center Tier, 2025 to 2035
  9. Global Analysis 2020 to 2024 and Forecast 2025 to 2035, By Installation Type
    • Introduction / Key Findings
    • Historical Market Size Value (USD Million) Analysis By Installation Type, 2020 to 2024
    • Current and Future Market Size Value (USD Million) Analysis and Forecast By Installation Type, 2025 to 2035
      • New Installation
      • Retrofit/Upgrade
    • Y-o-Y Growth Trend Analysis By Installation Type, 2020 to 2024
    • Absolute $ Opportunity Analysis By Installation Type, 2025 to 2035
  10. Global Analysis 2020 to 2024 and Forecast 2025 to 2035, By End-User
    • Introduction / Key Findings
    • Historical Market Size Value (USD Million) Analysis By End-User, 2020 to 2024
    • Current and Future Market Size Value (USD Million) Analysis and Forecast By End-User, 2025 to 2035
      • Cloud Providers
      • Colocation Providers
      • Enterprise
      • Hyperscale
    • Y-o-Y Growth Trend Analysis By End-User, 2020 to 2024
    • Absolute $ Opportunity Analysis By End-User, 2025 to 2035
  11. Global Analysis 2020 to 2024 and Forecast 2025 to 2035, By Industry
    • Introduction / Key Findings
    • Historical Market Size Value (USD Million) Analysis By Industry, 2020 to 2024
    • Current and Future Market Size Value (USD Million) Analysis and Forecast By Industry, 2025 to 2035
      • IT & Telecom
      • BFSI
      • Healthcare
      • Manufacturing
      • Media & Entertainment
      • Retail
      • Government
      • Others
    • Y-o-Y Growth Trend Analysis By Industry, 2020 to 2024
    • Absolute $ Opportunity Analysis By Industry, 2025 to 2035
  12. Global Analysis 2020 to 2024 and Forecast 2025 to 2035, By Region
    • Introduction
    • Historical Market Size Value (USD Million) Analysis By Region, 2020 to 2024
    • Current Market Size Value (USD Million) Analysis and Forecast By Region, 2025 to 2035
      • North America
      • Latin America
      • Western Europe
      • Eastern Europe
      • East Asia
      • South Asia and Pacific
      • Middle East & Africa
    • Market Attractiveness Analysis By Region
  13. North America Analysis 2020 to 2024 and Forecast 2025 to 2035, By Country
    • Historical Market Size Value (USD Million) Trend Analysis By Market Taxonomy, 2020 to 2024
    • Market Size Value (USD Million) Forecast By Market Taxonomy, 2025 to 2035
      • By Country
        • USA
        • Canada
        • Mexico
      • By Component
      • By Data Center Type
      • By Data Center Tier
      • By Installation Type
      • By End-User
      • By Industry
    • Market Attractiveness Analysis
      • By Country
      • By Component
      • By Data Center Type
      • By Data Center Tier
      • By Installation Type
      • By End-User
      • By Industry
    • Key Takeaways
  14. Latin America Analysis 2020 to 2024 and Forecast 2025 to 2035, By Country
    • Historical Market Size Value (USD Million) Trend Analysis By Market Taxonomy, 2020 to 2024
    • Market Size Value (USD Million) Forecast By Market Taxonomy, 2025 to 2035
      • By Country
        • Brazil
        • Chile
        • Rest of Latin America
      • By Component
      • By Data Center Type
      • By Data Center Tier
      • By Installation Type
      • By End-User
      • By Industry
    • Market Attractiveness Analysis
      • By Country
      • By Component
      • By Data Center Type
      • By Data Center Tier
      • By Installation Type
      • By End-User
      • By Industry
    • Key Takeaways
  15. Western Europe Analysis 2020 to 2024 and Forecast 2025 to 2035, By Country
    • Historical Market Size Value (USD Million) Trend Analysis By Market Taxonomy, 2020 to 2024
    • Market Size Value (USD Million) Forecast By Market Taxonomy, 2025 to 2035
      • By Country
        • Germany
        • UK
        • Italy
        • Spain
        • France
        • Nordic
        • BENELUX
        • Rest of Western Europe
      • By Component
      • By Data Center Type
      • By Data Center Tier
      • By Installation Type
      • By End-User
      • By Industry
    • Market Attractiveness Analysis
      • By Country
      • By Component
      • By Data Center Type
      • By Data Center Tier
      • By Installation Type
      • By End-User
      • By Industry
    • Key Takeaways
  16. Eastern Europe Analysis 2020 to 2024 and Forecast 2025 to 2035, By Country
    • Historical Market Size Value (USD Million) Trend Analysis By Market Taxonomy, 2020 to 2024
    • Market Size Value (USD Million) Forecast By Market Taxonomy, 2025 to 2035
      • By Country
        • Russia
        • Poland
        • Hungary
        • Balkan & Baltic
        • Rest of Eastern Europe
      • By Component
      • By Data Center Type
      • By Data Center Tier
      • By Installation Type
      • By End-User
      • By Industry
    • Market Attractiveness Analysis
      • By Country
      • By Component
      • By Data Center Type
      • By Data Center Tier
      • By Installation Type
      • By End-User
      • By Industry
    • Key Takeaways
  17. East Asia Analysis 2020 to 2024 and Forecast 2025 to 2035, By Country
    • Historical Market Size Value (USD Million) Trend Analysis By Market Taxonomy, 2020 to 2024
    • Market Size Value (USD Million) Forecast By Market Taxonomy, 2025 to 2035
      • By Country
        • China
        • Japan
        • South Korea
      • By Component
      • By Data Center Type
      • By Data Center Tier
      • By Installation Type
      • By End-User
      • By Industry
    • Market Attractiveness Analysis
      • By Country
      • By Component
      • By Data Center Type
      • By Data Center Tier
      • By Installation Type
      • By End-User
      • By Industry
    • Key Takeaways
  18. South Asia and Pacific Analysis 2020 to 2024 and Forecast 2025 to 2035, By Country
    • Historical Market Size Value (USD Million) Trend Analysis By Market Taxonomy, 2020 to 2024
    • Market Size Value (USD Million) Forecast By Market Taxonomy, 2025 to 2035
      • By Country
        • India
        • ASEAN
        • Australia & New Zealand
        • Rest of South Asia and Pacific
      • By Component
      • By Data Center Type
      • By Data Center Tier
      • By Installation Type
      • By End-User
      • By Industry
    • Market Attractiveness Analysis
      • By Country
      • By Component
      • By Data Center Type
      • By Data Center Tier
      • By Installation Type
      • By End-User
      • By Industry
    • Key Takeaways
  19. Middle East & Africa Analysis 2020 to 2024 and Forecast 2025 to 2035, By Country
    • Historical Market Size Value (USD Million) Trend Analysis By Market Taxonomy, 2020 to 2024
    • Market Size Value (USD Million) Forecast By Market Taxonomy, 2025 to 2035
      • By Country
        • Kingdom of Saudi Arabia
        • Other GCC Countries
        • Turkiye
        • South Africa
        • Other African Union
        • Rest of Middle East & Africa
      • By Component
      • By Data Center Type
      • By Data Center Tier
      • By Installation Type
      • By End-User
      • By Industry
    • Market Attractiveness Analysis
      • By Country
      • By Component
      • By Data Center Type
      • By Data Center Tier
      • By Installation Type
      • By End-User
      • By Industry
    • Key Takeaways
  20. Key Countries Analysis
    • USA
      • Pricing Analysis
      • Market Share Analysis, 2024
        • By Component
        • By Data Center Type
        • By Data Center Tier
        • By Installation Type
        • By End-User
        • By Industry
    • Canada
      • Pricing Analysis
      • Market Share Analysis, 2024
        • By Component
        • By Data Center Type
        • By Data Center Tier
        • By Installation Type
        • By End-User
        • By Industry
    • Mexico
      • Pricing Analysis
      • Market Share Analysis, 2024
        • By Component
        • By Data Center Type
        • By Data Center Tier
        • By Installation Type
        • By End-User
        • By Industry
    • Brazil
      • Pricing Analysis
      • Market Share Analysis, 2024
        • By Component
        • By Data Center Type
        • By Data Center Tier
        • By Installation Type
        • By End-User
        • By Industry
    • Chile
      • Pricing Analysis
      • Market Share Analysis, 2024
        • By Component
        • By Data Center Type
        • By Data Center Tier
        • By Installation Type
        • By End-User
        • By Industry
    • Germany
      • Pricing Analysis
      • Market Share Analysis, 2024
        • By Component
        • By Data Center Type
        • By Data Center Tier
        • By Installation Type
        • By End-User
        • By Industry
    • UK
      • Pricing Analysis
      • Market Share Analysis, 2024
        • By Component
        • By Data Center Type
        • By Data Center Tier
        • By Installation Type
        • By End-User
        • By Industry
    • Italy
      • Pricing Analysis
      • Market Share Analysis, 2024
        • By Component
        • By Data Center Type
        • By Data Center Tier
        • By Installation Type
        • By End-User
        • By Industry
    • Spain
      • Pricing Analysis
      • Market Share Analysis, 2024
        • By Component
        • By Data Center Type
        • By Data Center Tier
        • By Installation Type
        • By End-User
        • By Industry
    • France
      • Pricing Analysis
      • Market Share Analysis, 2024
        • By Component
        • By Data Center Type
        • By Data Center Tier
        • By Installation Type
        • By End-User
        • By Industry
    • India
      • Pricing Analysis
      • Market Share Analysis, 2024
        • By Component
        • By Data Center Type
        • By Data Center Tier
        • By Installation Type
        • By End-User
        • By Industry
    • ASEAN
      • Pricing Analysis
      • Market Share Analysis, 2024
        • By Component
        • By Data Center Type
        • By Data Center Tier
        • By Installation Type
        • By End-User
        • By Industry
    • Australia & New Zealand
      • Pricing Analysis
      • Market Share Analysis, 2024
        • By Component
        • By Data Center Type
        • By Data Center Tier
        • By Installation Type
        • By End-User
        • By Industry
    • China
      • Pricing Analysis
      • Market Share Analysis, 2024
        • By Component
        • By Data Center Type
        • By Data Center Tier
        • By Installation Type
        • By End-User
        • By Industry
    • Japan
      • Pricing Analysis
      • Market Share Analysis, 2024
        • By Component
        • By Data Center Type
        • By Data Center Tier
        • By Installation Type
        • By End-User
        • By Industry
    • South Korea
      • Pricing Analysis
      • Market Share Analysis, 2024
        • By Component
        • By Data Center Type
        • By Data Center Tier
        • By Installation Type
        • By End-User
        • By Industry
    • Russia
      • Pricing Analysis
      • Market Share Analysis, 2024
        • By Component
        • By Data Center Type
        • By Data Center Tier
        • By Installation Type
        • By End-User
        • By Industry
    • Poland
      • Pricing Analysis
      • Market Share Analysis, 2024
        • By Component
        • By Data Center Type
        • By Data Center Tier
        • By Installation Type
        • By End-User
        • By Industry
    • Hungary
      • Pricing Analysis
      • Market Share Analysis, 2024
        • By Component
        • By Data Center Type
        • By Data Center Tier
        • By Installation Type
        • By End-User
        • By Industry
    • Kingdom of Saudi Arabia
      • Pricing Analysis
      • Market Share Analysis, 2024
        • By Component
        • By Data Center Type
        • By Data Center Tier
        • By Installation Type
        • By End-User
        • By Industry
    • Turkiye
      • Pricing Analysis
      • Market Share Analysis, 2024
        • By Component
        • By Data Center Type
        • By Data Center Tier
        • By Installation Type
        • By End-User
        • By Industry
    • South Africa
      • Pricing Analysis
      • Market Share Analysis, 2024
        • By Component
        • By Data Center Type
        • By Data Center Tier
        • By Installation Type
        • By End-User
        • By Industry
  21. Market Structure Analysis
    • Competition Dashboard
    • Competition Benchmarking
    • Market Share Analysis of Top Players
      • By Regional
      • By Component
      • By Data Center Type
      • By Data Center Tier
      • By Installation Type
      • By End-User
      • By Industry
  22. Competition Analysis
    • Competition Deep Dive
      • Schneider Electric SE
        • Overview
        • Product Portfolio
        • Profitability by Market Segments (Product/Age /Sales Channel/Region)
        • Sales Footprint
        • Strategy Overview
          • Marketing Strategy
          • Product Strategy
          • Channel Strategy
      • Eaton Corporation
      • ABB Group
      • Vertiv Group Corp
      • Raritan Inc. (Legrand)
      • Siemens AG
      • Riello Elettronica Group
      • Server Technology (Legrand)
      • Piller Power Systems
      • Cyber Power Systems Inc.
  23. Assumptions & Acronyms Used
  24. Research Methodology

List of Tables

  • Table 1: Global Value (USD Million) Forecast by Region, 2020-2035
  • Table 2: Global Value (USD Million) Forecast by Component , 2020-2035
  • Table 3: Global Value (USD Million) Forecast by Data Center Type, 2020-2035
  • Table 4: Global Value (USD Million) Forecast by Data Center Tier, 2020-2035
  • Table 5: Global Value (USD Million) Forecast by Installation Type, 2020-2035
  • Table 6: Global Value (USD Million) Forecast by End-User, 2020-2035
  • Table 7: Global Value (USD Million) Forecast by Industry, 2020-2035
  • Table 8: North America Value (USD Million) Forecast by Country, 2020-2035
  • Table 9: North America Value (USD Million) Forecast by Component , 2020-2035
  • Table 10: North America Value (USD Million) Forecast by Data Center Type, 2020-2035
  • Table 11: North America Value (USD Million) Forecast by Data Center Tier, 2020-2035
  • Table 12: North America Value (USD Million) Forecast by Installation Type, 2020-2035
  • Table 13: North America Value (USD Million) Forecast by End-User, 2020-2035
  • Table 14: North America Value (USD Million) Forecast by Industry, 2020-2035
  • Table 15: Latin America Value (USD Million) Forecast by Country, 2020-2035
  • Table 16: Latin America Value (USD Million) Forecast by Component , 2020-2035
  • Table 17: Latin America Value (USD Million) Forecast by Data Center Type, 2020-2035
  • Table 18: Latin America Value (USD Million) Forecast by Data Center Tier, 2020-2035
  • Table 19: Latin America Value (USD Million) Forecast by Installation Type, 2020-2035
  • Table 20: Latin America Value (USD Million) Forecast by End-User, 2020-2035
  • Table 21: Latin America Value (USD Million) Forecast by Industry, 2020-2035
  • Table 22: Western Europe Value (USD Million) Forecast by Country, 2020-2035
  • Table 23: Western Europe Value (USD Million) Forecast by Component , 2020-2035
  • Table 24: Western Europe Value (USD Million) Forecast by Data Center Type, 2020-2035
  • Table 25: Western Europe Value (USD Million) Forecast by Data Center Tier, 2020-2035
  • Table 26: Western Europe Value (USD Million) Forecast by Installation Type, 2020-2035
  • Table 27: Western Europe Value (USD Million) Forecast by End-User, 2020-2035
  • Table 28: Western Europe Value (USD Million) Forecast by Industry, 2020-2035
  • Table 29: Eastern Europe Value (USD Million) Forecast by Country, 2020-2035
  • Table 30: Eastern Europe Value (USD Million) Forecast by Component , 2020-2035
  • Table 31: Eastern Europe Value (USD Million) Forecast by Data Center Type, 2020-2035
  • Table 32: Eastern Europe Value (USD Million) Forecast by Data Center Tier, 2020-2035
  • Table 33: Eastern Europe Value (USD Million) Forecast by Installation Type, 2020-2035
  • Table 34: Eastern Europe Value (USD Million) Forecast by End-User, 2020-2035
  • Table 35: Eastern Europe Value (USD Million) Forecast by Industry, 2020-2035
  • Table 36: East Asia Value (USD Million) Forecast by Country, 2020-2035
  • Table 37: East Asia Value (USD Million) Forecast by Component , 2020-2035
  • Table 38: East Asia Value (USD Million) Forecast by Data Center Type, 2020-2035
  • Table 39: East Asia Value (USD Million) Forecast by Data Center Tier, 2020-2035
  • Table 40: East Asia Value (USD Million) Forecast by Installation Type, 2020-2035
  • Table 41: East Asia Value (USD Million) Forecast by End-User, 2020-2035
  • Table 42: East Asia Value (USD Million) Forecast by Industry, 2020-2035
  • Table 43: South Asia and Pacific Value (USD Million) Forecast by Country, 2020-2035
  • Table 44: South Asia and Pacific Value (USD Million) Forecast by Component , 2020-2035
  • Table 45: South Asia and Pacific Value (USD Million) Forecast by Data Center Type, 2020-2035
  • Table 46: South Asia and Pacific Value (USD Million) Forecast by Data Center Tier, 2020-2035
  • Table 47: South Asia and Pacific Value (USD Million) Forecast by Installation Type, 2020-2035
  • Table 48: South Asia and Pacific Value (USD Million) Forecast by End-User, 2020-2035
  • Table 49: South Asia and Pacific Value (USD Million) Forecast by Industry, 2020-2035
  • Table 50: Middle East & Africa Value (USD Million) Forecast by Country, 2020-2035
  • Table 51: Middle East & Africa Value (USD Million) Forecast by Component , 2020-2035
  • Table 52: Middle East & Africa Value (USD Million) Forecast by Data Center Type, 2020-2035
  • Table 53: Middle East & Africa Value (USD Million) Forecast by Data Center Tier, 2020-2035
  • Table 54: Middle East & Africa Value (USD Million) Forecast by Installation Type, 2020-2035
  • Table 55: Middle East & Africa Value (USD Million) Forecast by End-User, 2020-2035
  • Table 56: Middle East & Africa Value (USD Million) Forecast by Industry, 2020-2035

List of Figures

  • Figure 1: Global Pricing Analysis
  • Figure 2: Global Value (USD Million) Forecast 2020-2035
  • Figure 3: Global Value Share and BPS Analysis by Component , 2025 and 2035
  • Figure 4: Global Y-o-Y Growth Comparison by Component , 2025-2035
  • Figure 5: Global Attractiveness Analysis by Component
  • Figure 6: Global Value Share and BPS Analysis by Data Center Type, 2025 and 2035
  • Figure 7: Global Y-o-Y Growth Comparison by Data Center Type, 2025-2035
  • Figure 8: Global Attractiveness Analysis by Data Center Type
  • Figure 9: Global Value Share and BPS Analysis by Data Center Tier, 2025 and 2035
  • Figure 10: Global Y-o-Y Growth Comparison by Data Center Tier, 2025-2035
  • Figure 11: Global Attractiveness Analysis by Data Center Tier
  • Figure 12: Global Value Share and BPS Analysis by Installation Type, 2025 and 2035
  • Figure 13: Global Y-o-Y Growth Comparison by Installation Type, 2025-2035
  • Figure 14: Global Attractiveness Analysis by Installation Type
  • Figure 15: Global Value Share and BPS Analysis by End-User, 2025 and 2035
  • Figure 16: Global Y-o-Y Growth Comparison by End-User, 2025-2035
  • Figure 17: Global Attractiveness Analysis by End-User
  • Figure 18: Global Value Share and BPS Analysis by Industry, 2025 and 2035
  • Figure 19: Global Y-o-Y Growth Comparison by Industry, 2025-2035
  • Figure 20: Global Attractiveness Analysis by Industry
  • Figure 21: Global Value (USD Million) Share and BPS Analysis by Region, 2025 and 2035
  • Figure 22: Global Y-o-Y Growth Comparison by Region, 2025-2035
  • Figure 23: Global Attractiveness Analysis by Region
  • Figure 24: North America Incremental Dollar Opportunity, 2025-2035
  • Figure 25: Latin America Incremental Dollar Opportunity, 2025-2035
  • Figure 26: Western Europe Incremental Dollar Opportunity, 2025-2035
  • Figure 27: Eastern Europe Incremental Dollar Opportunity, 2025-2035
  • Figure 28: East Asia Incremental Dollar Opportunity, 2025-2035
  • Figure 29: South Asia and Pacific Incremental Dollar Opportunity, 2025-2035
  • Figure 30: Middle East & Africa Incremental Dollar Opportunity, 2025-2035
  • Figure 31: North America Value Share and BPS Analysis by Country, 2025 and 2035
  • Figure 32: North America Value Share and BPS Analysis by Component , 2025 and 2035
  • Figure 33: North America Y-o-Y Growth Comparison by Component , 2025-2035
  • Figure 34: North America Attractiveness Analysis by Component
  • Figure 35: North America Value Share and BPS Analysis by Data Center Type, 2025 and 2035
  • Figure 36: North America Y-o-Y Growth Comparison by Data Center Type, 2025-2035
  • Figure 37: North America Attractiveness Analysis by Data Center Type
  • Figure 38: North America Value Share and BPS Analysis by Data Center Tier, 2025 and 2035
  • Figure 39: North America Y-o-Y Growth Comparison by Data Center Tier, 2025-2035
  • Figure 40: North America Attractiveness Analysis by Data Center Tier
  • Figure 41: North America Value Share and BPS Analysis by Installation Type, 2025 and 2035
  • Figure 42: North America Y-o-Y Growth Comparison by Installation Type, 2025-2035
  • Figure 43: North America Attractiveness Analysis by Installation Type
  • Figure 44: North America Value Share and BPS Analysis by End-User, 2025 and 2035
  • Figure 45: North America Y-o-Y Growth Comparison by End-User, 2025-2035
  • Figure 46: North America Attractiveness Analysis by End-User
  • Figure 47: North America Value Share and BPS Analysis by Industry, 2025 and 2035
  • Figure 48: North America Y-o-Y Growth Comparison by Industry, 2025-2035
  • Figure 49: North America Attractiveness Analysis by Industry
  • Figure 50: Latin America Value Share and BPS Analysis by Country, 2025 and 2035
  • Figure 51: Latin America Value Share and BPS Analysis by Component , 2025 and 2035
  • Figure 52: Latin America Y-o-Y Growth Comparison by Component , 2025-2035
  • Figure 53: Latin America Attractiveness Analysis by Component
  • Figure 54: Latin America Value Share and BPS Analysis by Data Center Type, 2025 and 2035
  • Figure 55: Latin America Y-o-Y Growth Comparison by Data Center Type, 2025-2035
  • Figure 56: Latin America Attractiveness Analysis by Data Center Type
  • Figure 57: Latin America Value Share and BPS Analysis by Data Center Tier, 2025 and 2035
  • Figure 58: Latin America Y-o-Y Growth Comparison by Data Center Tier, 2025-2035
  • Figure 59: Latin America Attractiveness Analysis by Data Center Tier
  • Figure 60: Latin America Value Share and BPS Analysis by Installation Type, 2025 and 2035
  • Figure 61: Latin America Y-o-Y Growth Comparison by Installation Type, 2025-2035
  • Figure 62: Latin America Attractiveness Analysis by Installation Type
  • Figure 63: Latin America Value Share and BPS Analysis by End-User, 2025 and 2035
  • Figure 64: Latin America Y-o-Y Growth Comparison by End-User, 2025-2035
  • Figure 65: Latin America Attractiveness Analysis by End-User
  • Figure 66: Latin America Value Share and BPS Analysis by Industry, 2025 and 2035
  • Figure 67: Latin America Y-o-Y Growth Comparison by Industry, 2025-2035
  • Figure 68: Latin America Attractiveness Analysis by Industry
  • Figure 69: Western Europe Value Share and BPS Analysis by Country, 2025 and 2035
  • Figure 70: Western Europe Value Share and BPS Analysis by Component , 2025 and 2035
  • Figure 71: Western Europe Y-o-Y Growth Comparison by Component , 2025-2035
  • Figure 72: Western Europe Attractiveness Analysis by Component
  • Figure 73: Western Europe Value Share and BPS Analysis by Data Center Type, 2025 and 2035
  • Figure 74: Western Europe Y-o-Y Growth Comparison by Data Center Type, 2025-2035
  • Figure 75: Western Europe Attractiveness Analysis by Data Center Type
  • Figure 76: Western Europe Value Share and BPS Analysis by Data Center Tier, 2025 and 2035
  • Figure 77: Western Europe Y-o-Y Growth Comparison by Data Center Tier, 2025-2035
  • Figure 78: Western Europe Attractiveness Analysis by Data Center Tier
  • Figure 79: Western Europe Value Share and BPS Analysis by Installation Type, 2025 and 2035
  • Figure 80: Western Europe Y-o-Y Growth Comparison by Installation Type, 2025-2035
  • Figure 81: Western Europe Attractiveness Analysis by Installation Type
  • Figure 82: Western Europe Value Share and BPS Analysis by End-User, 2025 and 2035
  • Figure 83: Western Europe Y-o-Y Growth Comparison by End-User, 2025-2035
  • Figure 84: Western Europe Attractiveness Analysis by End-User
  • Figure 85: Western Europe Value Share and BPS Analysis by Industry, 2025 and 2035
  • Figure 86: Western Europe Y-o-Y Growth Comparison by Industry, 2025-2035
  • Figure 87: Western Europe Attractiveness Analysis by Industry
  • Figure 88: Eastern Europe Value Share and BPS Analysis by Country, 2025 and 2035
  • Figure 89: Eastern Europe Value Share and BPS Analysis by Component , 2025 and 2035
  • Figure 90: Eastern Europe Y-o-Y Growth Comparison by Component , 2025-2035
  • Figure 91: Eastern Europe Attractiveness Analysis by Component
  • Figure 92: Eastern Europe Value Share and BPS Analysis by Data Center Type, 2025 and 2035
  • Figure 93: Eastern Europe Y-o-Y Growth Comparison by Data Center Type, 2025-2035
  • Figure 94: Eastern Europe Attractiveness Analysis by Data Center Type
  • Figure 95: Eastern Europe Value Share and BPS Analysis by Data Center Tier, 2025 and 2035
  • Figure 96: Eastern Europe Y-o-Y Growth Comparison by Data Center Tier, 2025-2035
  • Figure 97: Eastern Europe Attractiveness Analysis by Data Center Tier
  • Figure 98: Eastern Europe Value Share and BPS Analysis by Installation Type, 2025 and 2035
  • Figure 99: Eastern Europe Y-o-Y Growth Comparison by Installation Type, 2025-2035
  • Figure 100: Eastern Europe Attractiveness Analysis by Installation Type
  • Figure 101: Eastern Europe Value Share and BPS Analysis by End-User, 2025 and 2035
  • Figure 102: Eastern Europe Y-o-Y Growth Comparison by End-User, 2025-2035
  • Figure 103: Eastern Europe Attractiveness Analysis by End-User
  • Figure 104: Eastern Europe Value Share and BPS Analysis by Industry, 2025 and 2035
  • Figure 105: Eastern Europe Y-o-Y Growth Comparison by Industry, 2025-2035
  • Figure 106: Eastern Europe Attractiveness Analysis by Industry
  • Figure 107: East Asia Value Share and BPS Analysis by Country, 2025 and 2035
  • Figure 108: East Asia Value Share and BPS Analysis by Component , 2025 and 2035
  • Figure 109: East Asia Y-o-Y Growth Comparison by Component , 2025-2035
  • Figure 110: East Asia Attractiveness Analysis by Component
  • Figure 111: East Asia Value Share and BPS Analysis by Data Center Type, 2025 and 2035
  • Figure 112: East Asia Y-o-Y Growth Comparison by Data Center Type, 2025-2035
  • Figure 113: East Asia Attractiveness Analysis by Data Center Type
  • Figure 114: East Asia Value Share and BPS Analysis by Data Center Tier, 2025 and 2035
  • Figure 115: East Asia Y-o-Y Growth Comparison by Data Center Tier, 2025-2035
  • Figure 116: East Asia Attractiveness Analysis by Data Center Tier
  • Figure 117: East Asia Value Share and BPS Analysis by Installation Type, 2025 and 2035
  • Figure 118: East Asia Y-o-Y Growth Comparison by Installation Type, 2025-2035
  • Figure 119: East Asia Attractiveness Analysis by Installation Type
  • Figure 120: East Asia Value Share and BPS Analysis by End-User, 2025 and 2035
  • Figure 121: East Asia Y-o-Y Growth Comparison by End-User, 2025-2035
  • Figure 122: East Asia Attractiveness Analysis by End-User
  • Figure 123: East Asia Value Share and BPS Analysis by Industry, 2025 and 2035
  • Figure 124: East Asia Y-o-Y Growth Comparison by Industry, 2025-2035
  • Figure 125: East Asia Attractiveness Analysis by Industry
  • Figure 126: South Asia and Pacific Value Share and BPS Analysis by Country, 2025 and 2035
  • Figure 127: South Asia and Pacific Value Share and BPS Analysis by Component , 2025 and 2035
  • Figure 128: South Asia and Pacific Y-o-Y Growth Comparison by Component , 2025-2035
  • Figure 129: South Asia and Pacific Attractiveness Analysis by Component
  • Figure 130: South Asia and Pacific Value Share and BPS Analysis by Data Center Type, 2025 and 2035
  • Figure 131: South Asia and Pacific Y-o-Y Growth Comparison by Data Center Type, 2025-2035
  • Figure 132: South Asia and Pacific Attractiveness Analysis by Data Center Type
  • Figure 133: South Asia and Pacific Value Share and BPS Analysis by Data Center Tier, 2025 and 2035
  • Figure 134: South Asia and Pacific Y-o-Y Growth Comparison by Data Center Tier, 2025-2035
  • Figure 135: South Asia and Pacific Attractiveness Analysis by Data Center Tier
  • Figure 136: South Asia and Pacific Value Share and BPS Analysis by Installation Type, 2025 and 2035
  • Figure 137: South Asia and Pacific Y-o-Y Growth Comparison by Installation Type, 2025-2035
  • Figure 138: South Asia and Pacific Attractiveness Analysis by Installation Type
  • Figure 139: South Asia and Pacific Value Share and BPS Analysis by End-User, 2025 and 2035
  • Figure 140: South Asia and Pacific Y-o-Y Growth Comparison by End-User, 2025-2035
  • Figure 141: South Asia and Pacific Attractiveness Analysis by End-User
  • Figure 142: South Asia and Pacific Value Share and BPS Analysis by Industry, 2025 and 2035
  • Figure 143: South Asia and Pacific Y-o-Y Growth Comparison by Industry, 2025-2035
  • Figure 144: South Asia and Pacific Attractiveness Analysis by Industry
  • Figure 145: Middle East & Africa Value Share and BPS Analysis by Country, 2025 and 2035
  • Figure 146: Middle East & Africa Value Share and BPS Analysis by Component , 2025 and 2035
  • Figure 147: Middle East & Africa Y-o-Y Growth Comparison by Component , 2025-2035
  • Figure 148: Middle East & Africa Attractiveness Analysis by Component
  • Figure 149: Middle East & Africa Value Share and BPS Analysis by Data Center Type, 2025 and 2035
  • Figure 150: Middle East & Africa Y-o-Y Growth Comparison by Data Center Type, 2025-2035
  • Figure 151: Middle East & Africa Attractiveness Analysis by Data Center Type
  • Figure 152: Middle East & Africa Value Share and BPS Analysis by Data Center Tier, 2025 and 2035
  • Figure 153: Middle East & Africa Y-o-Y Growth Comparison by Data Center Tier, 2025-2035
  • Figure 154: Middle East & Africa Attractiveness Analysis by Data Center Tier
  • Figure 155: Middle East & Africa Value Share and BPS Analysis by Installation Type, 2025 and 2035
  • Figure 156: Middle East & Africa Y-o-Y Growth Comparison by Installation Type, 2025-2035
  • Figure 157: Middle East & Africa Attractiveness Analysis by Installation Type
  • Figure 158: Middle East & Africa Value Share and BPS Analysis by End-User, 2025 and 2035
  • Figure 159: Middle East & Africa Y-o-Y Growth Comparison by End-User, 2025-2035
  • Figure 160: Middle East & Africa Attractiveness Analysis by End-User
  • Figure 161: Middle East & Africa Value Share and BPS Analysis by Industry, 2025 and 2035
  • Figure 162: Middle East & Africa Y-o-Y Growth Comparison by Industry, 2025-2035
  • Figure 163: Middle East & Africa Attractiveness Analysis by Industry
  • Figure 164: Global - Tier Structure Analysis
  • Figure 165: Global - Company Share Analysis
Dashboard
Dashboard
Dashboard
Dashboard
Dashboard
Dashboard

Full Research Suite comprises of:

Market outlook & trends analysis

Market outlook & trends analysis

Interviews & case studies

Interviews & case studies

Strategic recommendations

Strategic recommendations

Vendor profiles & capabilities analysis

Vendor profiles & capabilities analysis

5-year forecasts

5-year forecasts

8 regions and 60+ country-level data splits

8 regions and 60+ country-level data splits

Market segment data splits

Market segment data splits

12 months of continuous data updates

12 months of continuous data updates

DELIVERED AS:

PDF EXCEL ONLINE

Full Research Suite


$5000

$7500

$10000

Buy Report Now
Similar Industry Reports

Similar Industry Reports

DataOps Platform Market

DataOps Platform Market Size and Share Forecast Outlook 2025 to 2035

Data Acquisition Hardware Market

Data Acquisition Hardware Market Size and Share Forecast Outlook 2025 to 2035

Data Discovery Market

Data Discovery Market Size and Share Forecast Outlook 2025 to 2035

Data Centre Rack Server Market

Data Centre Rack Server Market Size and Share Forecast Outlook 2025 to 2035

Data Centre Colocation Market

Data Centre Colocation Market Size and Share Forecast Outlook 2025 to 2035

Data Lake Market
Data Lake Market

Data Lake Market Size and Share Forecast Outlook 2025 to 2035

Data Lakehouse Market

Data Lakehouse Market Size and Share Forecast Outlook 2025 to 2035

Data Centre UPS Market

Data Centre UPS Market Size and Share Forecast Outlook 2025 to 2035

Data-Driven Retail Solution Market

Data-Driven Retail Solution Market Size and Share Forecast Outlook 2025 to 2035

Data Science Platform Market

Data Science Platform Market Size and Share Forecast Outlook 2025 to 2035

Data Monetization Platform Market

Data Monetization Platform Market Size and Share Forecast Outlook 2025 to 2035

Data Conversion Services Market

Data Conversion Services Market Size and Share Forecast Outlook 2025 to 2035

Data Exfiltration Market

Data Exfiltration Market Size and Share Forecast Outlook 2025 to 2035

Data Virtualization Cloud Market

Data Virtualization Cloud Market Analysis – Growth & Forecast 2025 to 2035

Data Fabric Market
Data Fabric Market

Data Fabric Market Analysis - Trends, Size & Forecast 2025 to 2035

Data Warehouse as a Service (DWaaS) Market

Data Warehouse as a Service Market - Cloud Trends & Forecast 2025 to 2035

Data Catalog Market
Data Catalog Market

Data Catalog Market Trends - Growth & Forecast 2025 to 2035

Data As A Service (DaaS) Market

Data as a Service (DaaS) Market Analysis by Pricing Model, Deployment Type, End User, and Region Through 2035

Data Governance Market

Data Governance – AI-Driven Compliance & Security

Data Orchestration Tool Market

Cloud-Based Data Orchestration – AI for Smarter Insights

Future Market Insights

Data Center Power Management Industry Analysis in Western Europe

Chat With MaRIA

Chat With

MaRIA

Hi There, I am MaRIA, Your Market Research Intelligence Assistant. How may I help you?