Data Center Liquid Cooling Market Outlook (2023 to 2033)

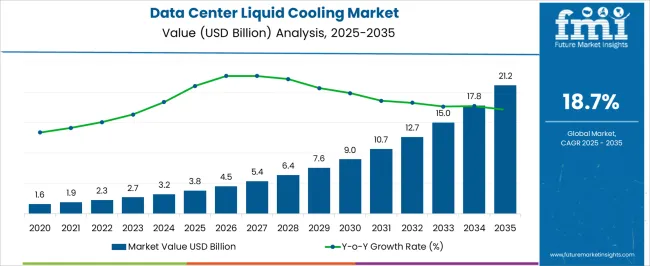
The global data center liquid cooling market size is anticipated to witness phenomenal growth from 2023 to 2033. According to the research report published by Future Market Insights, the global market is expected to surpass a valuation of USD 2,660.1 million in 2023. It is predicted to reach a valuation of USD 15,974.3 million by 2033. The market is foreseen to thrive at an astronomical CAGR of 19.6% from 2023 to 2033.

Emerging technologies and the rising need for energy-efficient cooling solutions are all contributing to the growth of the data center liquid cooling industry.

Growing demand for energy-efficient cooling solutions, compact and noise-free solutions, the need for lower operating costs, and improved overclocking capability are all prominent reasons driving market expansion. Furthermore, variables such as artificial intelligence developments, blockchain, and other emerging technologies, as well as high-density cooling, are likely to provide significant prospects for data center liquid cooling manufacturers.

Attribute Details
Data Center Liquid Cooling Market Share (2022) USD 2,254.3 million
Data Center Liquid Cooling Market Share (2023) USD 2,660.1 million
Data Center Liquid Cooling Market Share (2033) USD 15,974.3 million
Data Center Liquid Cooling Market Share (2023 to 2033) 19.6%

Data Center Liquid Cooling Market Historical Analysis (2018 to 2022) Vs. Forecast Outlook (2023 to 2033)

The global data center liquid cooling industry size expanded at a CAGR of 17.5% from 2018 to 2022. In 2018, the global market size stood at USD 1,180.7 million. In the following years, the market witnessed significant growth, accounting for USD 2,254.3 million in 2022.

Higher processing density could potentially be achieved in data centers within the same physical footprint through liquid cooling. Liquid cooling technologies enable the installation of more equipment in a smaller area by effectively eliminating heat. This is especially important in settings where space is expensive or scarce since it enables data centers to increase their processing power without changing their physical infrastructure.

Data centers are under pressure to lower their carbon footprint and energy use as environmental sustainability is becoming more and more of a concern. Compared to conventional air cooling, liquid cooling is a more ecologically friendly option since it increases energy efficiency and lessens the need for power-hungry cooling equipment. Data centers may aid in the development of a greener, more sustainable IT infrastructure by implementing liquid cooling technology.

What is Driving the Growth of the Market?

High-performance, great-frequency, and intensive workload conditions, multi-core computing, such as artificial intelligence, machine learning, and end-to-end data center solutions, are in high demand in data centers. Data center owners may address a wide range of needs across the company, with the newest developments in indirect or direct-on-chip liquid cooling and system integrator services.

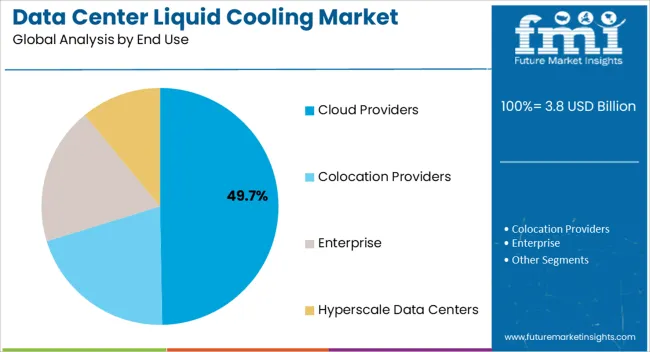
The increasing adoption of cold plates, direct liquid cooling (DLC), indirect liquid cooling, and rack liquid cooling by various end users. Such as cloud providers, colocation providers, hyperscale data centers, and others, are expected to drive demand for data center liquid cooling technology.

Data centers are experiencing unprecedented computation and core count-hungry applications in today's era. As traditional air cooling hits its limits, data center operators and owners must rethink rising density and the challenges they entail.

What are the Key Trends in the Market?

More than simply, mainframes and supercomputers benefit from liquid cooling in data centers.

Water and other liquids are far more efficient at carrying heat than air, and they can also remove some problems that come with air cooling systems. Especially as computer density rises and data centers grow, boosting the demand in the market. Liquid cooling technology has a far higher heat capacity than air; water is 4,000 times more efficient than air. This method provides improved energy efficiency across the data center when compared to air-cooled sites, with rack density estimates north of 50 kW.

Category-wise Insights

What is the Segmentation Outlook for the Market?

The market is segmented into data center type, component, end-use, and region.

Enterprises favor liquid cooling systems for end users, which can be ascribed to customers' growing IT demands. By lowering downtime and enhancing disaster recovery capabilities, data center services assist save costs and preserving server availability. Due to these advantages, businesses are increasingly using data center liquid cooling in their data centers. As a result, the data center cooling market is anticipated to reach USD 3.2 billion by 2024.

Which Component is Leading the Market?

By component, the FMI study finds that the solution component has a high revenue potential through 2033.

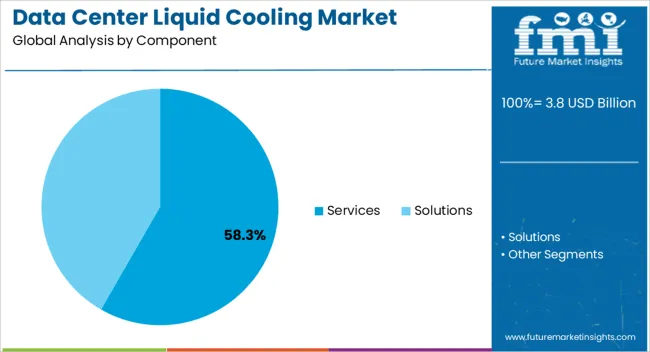
The adoption of the solution system is expected to be a CAGR of 18.6% during the forecast period. In 2022, the solution segment by component captured 55.4% shares in the global market. Key suppliers offer a variety of liquid cooling options, while niche and developing vendors offer niche and emerging liquid cooling solutions. Due to their usefulness in high-density cooling, data center liquid cooling technologies are garnering a lot of interest from large end-users.

Which Data Center Type Holds a Huge Market Share?

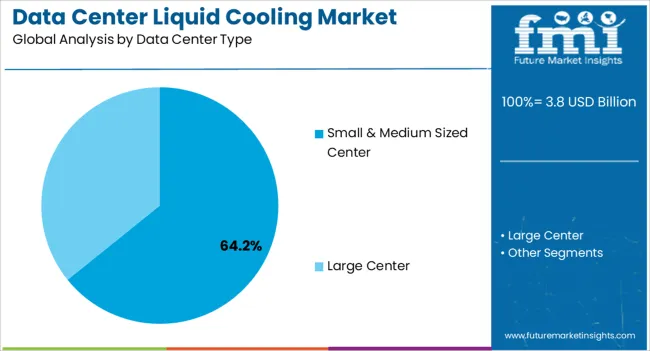
Based on data centers, large data centers are predicted to grow at a rapid rate, with a CAGR of 17.7% through 2023. In 2022, the large data center type segment captured 61.2% shares in the global market. Large data centers are distinguished by their extensive use of processing power to meet the data center needs of large corporations. These data centers are distinguished by stringent operational cost limits and a stronger demand for energy efficiency. Currently, these data centers are seeing a lot of rack- and row-based cooling solutions, but immersion cooling technologies are expected to see a lot more acceptance. Because of the higher cooling requirements of high-density server racks.

Country-wise Insights

Which is the Leading Region in the Market?

North America, Asia Pacific (APAC), Europe, the Middle East and Africa (MEA), and Latin America are the five key geographic regions that make up the global market.

Increasing technology adoption among North American organizations for reducing data center energy consumption, as well as the presence of data center liquid cooling vendors, are predicted to account for a huge market size of USD 4.1 billion over the projection period. In 2022, North America captured 34.3% shares in the global market, while the United States garnered 24.3% of global market shares. Individuals and businesses using the Internet in the United States of America are rapidly increasing. The country is a huge market for data center operations, and it is expected to continue to grow due to increased data consumption by end users.

The growing popularity of the Internet of Things (IoT) is a prominent driver for the hyper-scale data center market in the United States. Resulting in the construction of new facilities capable of handling exabytes of data generated by both commercial and consumer users.

Several sectors are experiencing a digital transformation, with enterprises migrating from traditional physical documents to digital services during the pandemic. According to the United Kingdom data center liquid cooling market, is expected to have a CAGR of 18.2% through 2033. In 2022, the United Kingdom captured 16.5% shares in the global market. Increased use of online payments in the BFSI industry has sparked demand for data centers with sophisticated cooling capabilities for servers to provide continuous and reliable services.
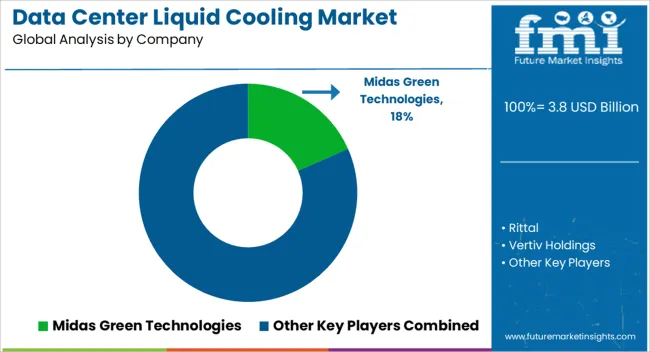
How Competition Intensifies the Market?

Companies provide effective thermal management systems to keep data centers running smoothly and with minimal downtime. Some benefits that are encouraging cloud service providers to use data center liquid cooling technologies include network reliability, security and compliance, hybrid cloud, and scalability.

The market leaders are concentrating their efforts on growing their consumer base to include international countries. To improve their market share and profitability, these companies are relying on strategic cooperation projects.

Recent Developments Observed by FMI:

  • In November 2022, Nxtra Data Limited, a subsidiary of Bharti Airtel (Airtel) invested INR 600 crores towards developing East Asia’s prime data center.
  • In May 2022, Huawei announced PowerPOD 3.0, a completely new power supply system, in Dongguan, China, along with the description of the Next-Generation Data Center Facility. The recent rollouts, which are the result of the collective knowledge and cooperative efforts of the Huawei Data Center Facility Team and industry experts, confirm Huawei's dedication to developing intelligent, low-carbon data centers.
  • Liquid Stack attends the Supercomputing '21 Conference in St. Louis in November 2021. The business unveiled its first OCP open accelerator infrastructure (OAI) servers that are optimized for two-phase liquid immersion-cooled. Wiwynn's sophisticated hardware, combined with Liquid Stack's two-phase immersion cooling technology, provides unparalleled levels of processing power, efficiency, and space savings.

Key Players in the Global Market

  • Midas Green Technologies
  • Rittal
  • Vertive Holdings
  • Green Revolution Cooling (GRC)
  • Schneider Electric

Scope of the Report

Attribute Details
Forecast Period 2023 to 2033
Historical Data Available for 2018 to 2022
Market Analysis USD million for Value
Key Regions Covered North America; Latin America; Europe; Asia Pacific; The Middle East & Africa (MEA)
Key Countries Covered United States, Canada, Germany, United Kingdom, Nordic, Russia, BENELUX, Poland, France, Spain, Italy, Czech Republic, Hungary, Rest of EMEAI, Brazil, Peru, Argentina, Mexico, South Africa, Northern Africa, GCC Countries, China, Japan, South Korea, India, ASEAN, Thailand, Malaysia, Indonesia, Australia, New Zealand, Others
Key Segments Covered Component, Data Center Type, End Use, Region
Report Coverage Market Forecast, Company Share Analysis, Competition Intelligence, Trend Analysis, Market Dynamics and Challenges, and Strategic Growth Initiatives

Data Center Liquid Cooling Market Segmentation

By Component:

  • Services
  • Solutions

By Data Center Type:

  • Small & Medium Sized Center
  • Large Center

By End Use:

  • Cloud Providers
  • Colocation Providers
  • Enterprise
  • Hyperscale Data Centers

By Region:

  • North America
  • Latin America
  • Europe
  • Asia Pacific
  • The Middle East & Africa (MEA)

Table of Content

  • 1. Executive Summary
  • 2. Market Overview
  • 3. Market Background
  • 4. Global Market Analysis 2018 to 2022 and Forecast, 2023 to 2033
  • 5. Global Market Analysis 2018 to 2022 and Forecast 2023 to 2033, By Component
    • 5.1. Services
    • 5.2. Solution
  • 6. Global Market Analysis 2018 to 2022 and Forecast 2023 to 2033, By Data Center Type
    • 6.1. Small & Medium Sized Center
    • 6.2. Large Center
  • 7. Global Market Analysis 2018 to 2022 and Forecast 2023 to 2033, By End Use
    • 7.1. Cloud Providers
    • 7.2. Colocation Providers
    • 7.3. Enterprise
    • 7.4. Hyperscale Data Centers
  • 8. Global Market Analysis 2018 to 2022 and Forecast 2023 to 2033, By Region
    • 8.1. North America
    • 8.2. Latin America
    • 8.3. Europe
    • 8.4. Asia Pacific
    • 8.5. MEA
  • 9. North America Market Analysis 2018 to 2022 and Forecast 2023 to 2033, By Country
  • 10. Latin America Market Analysis 2018 to 2022 and Forecast 2023 to 2033, By Country
  • 11. Europe Market Analysis 2018 to 2022 and Forecast 2023 to 2033, By Country
  • 12. Asia Pacific Market Analysis 2018 to 2022 and Forecast 2023 to 2033, By Country
  • 13. MEA Market Analysis 2018 to 2022 and Forecast 2023 to 2033, By Country
  • 14. Key Countries Market Analysis
  • 15. Market Structure Analysis
  • 16. Competition Analysis
    • 16.1. Midas Green Technologies
    • 16.2. Rittal
    • 16.3. Vertiv Holdings
    • 16.4. Green Revolution Cooling (GRC)
    • 16.5. Schneider Electric
    • 16.6. Alfa Laval AB
    • 16.7. Asetek
    • 16.8. Chilldyne
    • 16.9. Asperitas
    • 16.10. CoolIT Systems
    • 16.11. DCX
  • 17. Assumptions & Acronyms Used
  • 18. Research Methodology

List of Tables

Table 1: Global Market Value (US$ Million) Forecast by Region, 2018 to 2033

Table 2: Global Market Volume (Units) Forecast by Region, 2018 to 2033

Table 3: Global Market Value (US$ Million) Forecast by Component, 2018 to 2033

Table 4: Global Market Volume (Units) Forecast by Component, 2018 to 2033

Table 5: Global Market Value (US$ Million) Forecast by Data Center Type, 2018 to 2033

Table 6: Global Market Volume (Units) Forecast by Data Center Type, 2018 to 2033

Table 7: Global Market Value (US$ Million) Forecast by End Use, 2018 to 2033

Table 8: Global Market Volume (Units) Forecast by End Use, 2018 to 2033

Table 9: North America Market Value (US$ Million) Forecast by Country, 2018 to 2033

Table 10: North America Market Volume (Units) Forecast by Country, 2018 to 2033

Table 11: North America Market Value (US$ Million) Forecast by Component, 2018 to 2033

Table 12: North America Market Volume (Units) Forecast by Component, 2018 to 2033

Table 13: North America Market Value (US$ Million) Forecast by Data Center Type, 2018 to 2033

Table 14: North America Market Volume (Units) Forecast by Data Center Type, 2018 to 2033

Table 15: North America Market Value (US$ Million) Forecast by End Use, 2018 to 2033

Table 16: North America Market Volume (Units) Forecast by End Use, 2018 to 2033

Table 17: Latin America Market Value (US$ Million) Forecast by Country, 2018 to 2033

Table 18: Latin America Market Volume (Units) Forecast by Country, 2018 to 2033

Table 19: Latin America Market Value (US$ Million) Forecast by Component, 2018 to 2033

Table 20: Latin America Market Volume (Units) Forecast by Component, 2018 to 2033

Table 21: Latin America Market Value (US$ Million) Forecast by Data Center Type, 2018 to 2033

Table 22: Latin America Market Volume (Units) Forecast by Data Center Type, 2018 to 2033

Table 23: Latin America Market Value (US$ Million) Forecast by End Use, 2018 to 2033

Table 24: Latin America Market Volume (Units) Forecast by End Use, 2018 to 2033

Table 25: Europe Market Value (US$ Million) Forecast by Country, 2018 to 2033

Table 26: Europe Market Volume (Units) Forecast by Country, 2018 to 2033

Table 27: Europe Market Value (US$ Million) Forecast by Component, 2018 to 2033

Table 28: Europe Market Volume (Units) Forecast by Component, 2018 to 2033

Table 29: Europe Market Value (US$ Million) Forecast by Data Center Type, 2018 to 2033

Table 30: Europe Market Volume (Units) Forecast by Data Center Type, 2018 to 2033

Table 31: Europe Market Value (US$ Million) Forecast by End Use, 2018 to 2033

Table 32: Europe Market Volume (Units) Forecast by End Use, 2018 to 2033

Table 33: Asia Pacific Market Value (US$ Million) Forecast by Country, 2018 to 2033

Table 34: Asia Pacific Market Volume (Units) Forecast by Country, 2018 to 2033

Table 35: Asia Pacific Market Value (US$ Million) Forecast by Component, 2018 to 2033

Table 36: Asia Pacific Market Volume (Units) Forecast by Component, 2018 to 2033

Table 37: Asia Pacific Market Value (US$ Million) Forecast by Data Center Type, 2018 to 2033

Table 38: Asia Pacific Market Volume (Units) Forecast by Data Center Type, 2018 to 2033

Table 39: Asia Pacific Market Value (US$ Million) Forecast by End Use, 2018 to 2033

Table 40: Asia Pacific Market Volume (Units) Forecast by End Use, 2018 to 2033

Table 41: MEA Market Value (US$ Million) Forecast by Country, 2018 to 2033

Table 42: MEA Market Volume (Units) Forecast by Country, 2018 to 2033

Table 43: MEA Market Value (US$ Million) Forecast by Component, 2018 to 2033

Table 44: MEA Market Volume (Units) Forecast by Component, 2018 to 2033

Table 45: MEA Market Value (US$ Million) Forecast by Data Center Type, 2018 to 2033

Table 46: MEA Market Volume (Units) Forecast by Data Center Type, 2018 to 2033

Table 47: MEA Market Value (US$ Million) Forecast by End Use, 2018 to 2033

Table 48: MEA Market Volume (Units) Forecast by End Use, 2018 to 2033

List of Figures

Figure 1: Global Market Value (US$ Million) by Component, 2023 to 2033

Figure 2: Global Market Value (US$ Million) by Data Center Type, 2023 to 2033

Figure 3: Global Market Value (US$ Million) by End Use, 2023 to 2033

Figure 4: Global Market Value (US$ Million) by Region, 2023 to 2033

Figure 5: Global Market Value (US$ Million) Analysis by Region, 2018 to 2033

Figure 6: Global Market Volume (Units) Analysis by Region, 2018 to 2033

Figure 7: Global Market Value Share (%) and BPS Analysis by Region, 2023 to 2033

Figure 8: Global Market Y-o-Y Growth (%) Projections by Region, 2023 to 2033

Figure 9: Global Market Value (US$ Million) Analysis by Component, 2018 to 2033

Figure 10: Global Market Volume (Units) Analysis by Component, 2018 to 2033

Figure 11: Global Market Value Share (%) and BPS Analysis by Component, 2023 to 2033

Figure 12: Global Market Y-o-Y Growth (%) Projections by Component, 2023 to 2033

Figure 13: Global Market Value (US$ Million) Analysis by Data Center Type, 2018 to 2033

Figure 14: Global Market Volume (Units) Analysis by Data Center Type, 2018 to 2033

Figure 15: Global Market Value Share (%) and BPS Analysis by Data Center Type, 2023 to 2033

Figure 16: Global Market Y-o-Y Growth (%) Projections by Data Center Type, 2023 to 2033

Figure 17: Global Market Value (US$ Million) Analysis by End Use, 2018 to 2033

Figure 18: Global Market Volume (Units) Analysis by End Use, 2018 to 2033

Figure 19: Global Market Value Share (%) and BPS Analysis by End Use, 2023 to 2033

Figure 20: Global Market Y-o-Y Growth (%) Projections by End Use, 2023 to 2033

Figure 21: Global Market Attractiveness by Component, 2023 to 2033

Figure 22: Global Market Attractiveness by Data Center Type, 2023 to 2033

Figure 23: Global Market Attractiveness by End Use, 2023 to 2033

Figure 24: Global Market Attractiveness by Region, 2023 to 2033

Figure 25: North America Market Value (US$ Million) by Component, 2023 to 2033

Figure 26: North America Market Value (US$ Million) by Data Center Type, 2023 to 2033

Figure 27: North America Market Value (US$ Million) by End Use, 2023 to 2033

Figure 28: North America Market Value (US$ Million) by Country, 2023 to 2033

Figure 29: North America Market Value (US$ Million) Analysis by Country, 2018 to 2033

Figure 30: North America Market Volume (Units) Analysis by Country, 2018 to 2033

Figure 31: North America Market Value Share (%) and BPS Analysis by Country, 2023 to 2033

Figure 32: North America Market Y-o-Y Growth (%) Projections by Country, 2023 to 2033

Figure 33: North America Market Value (US$ Million) Analysis by Component, 2018 to 2033

Figure 34: North America Market Volume (Units) Analysis by Component, 2018 to 2033

Figure 35: North America Market Value Share (%) and BPS Analysis by Component, 2023 to 2033

Figure 36: North America Market Y-o-Y Growth (%) Projections by Component, 2023 to 2033

Figure 37: North America Market Value (US$ Million) Analysis by Data Center Type, 2018 to 2033

Figure 38: North America Market Volume (Units) Analysis by Data Center Type, 2018 to 2033

Figure 39: North America Market Value Share (%) and BPS Analysis by Data Center Type, 2023 to 2033

Figure 40: North America Market Y-o-Y Growth (%) Projections by Data Center Type, 2023 to 2033

Figure 41: North America Market Value (US$ Million) Analysis by End Use, 2018 to 2033

Figure 42: North America Market Volume (Units) Analysis by End Use, 2018 to 2033

Figure 43: North America Market Value Share (%) and BPS Analysis by End Use, 2023 to 2033

Figure 44: North America Market Y-o-Y Growth (%) Projections by End Use, 2023 to 2033

Figure 45: North America Market Attractiveness by Component, 2023 to 2033

Figure 46: North America Market Attractiveness by Data Center Type, 2023 to 2033

Figure 47: North America Market Attractiveness by End Use, 2023 to 2033

Figure 48: North America Market Attractiveness by Country, 2023 to 2033

Figure 49: Latin America Market Value (US$ Million) by Component, 2023 to 2033

Figure 50: Latin America Market Value (US$ Million) by Data Center Type, 2023 to 2033

Figure 51: Latin America Market Value (US$ Million) by End Use, 2023 to 2033

Figure 52: Latin America Market Value (US$ Million) by Country, 2023 to 2033

Figure 53: Latin America Market Value (US$ Million) Analysis by Country, 2018 to 2033

Figure 54: Latin America Market Volume (Units) Analysis by Country, 2018 to 2033

Figure 55: Latin America Market Value Share (%) and BPS Analysis by Country, 2023 to 2033

Figure 56: Latin America Market Y-o-Y Growth (%) Projections by Country, 2023 to 2033

Figure 57: Latin America Market Value (US$ Million) Analysis by Component, 2018 to 2033

Figure 58: Latin America Market Volume (Units) Analysis by Component, 2018 to 2033

Figure 59: Latin America Market Value Share (%) and BPS Analysis by Component, 2023 to 2033

Figure 60: Latin America Market Y-o-Y Growth (%) Projections by Component, 2023 to 2033

Figure 61: Latin America Market Value (US$ Million) Analysis by Data Center Type, 2018 to 2033

Figure 62: Latin America Market Volume (Units) Analysis by Data Center Type, 2018 to 2033

Figure 63: Latin America Market Value Share (%) and BPS Analysis by Data Center Type, 2023 to 2033

Figure 64: Latin America Market Y-o-Y Growth (%) Projections by Data Center Type, 2023 to 2033

Figure 65: Latin America Market Value (US$ Million) Analysis by End Use, 2018 to 2033

Figure 66: Latin America Market Volume (Units) Analysis by End Use, 2018 to 2033

Figure 67: Latin America Market Value Share (%) and BPS Analysis by End Use, 2023 to 2033

Figure 68: Latin America Market Y-o-Y Growth (%) Projections by End Use, 2023 to 2033

Figure 69: Latin America Market Attractiveness by Component, 2023 to 2033

Figure 70: Latin America Market Attractiveness by Data Center Type, 2023 to 2033

Figure 71: Latin America Market Attractiveness by End Use, 2023 to 2033

Figure 72: Latin America Market Attractiveness by Country, 2023 to 2033

Figure 73: Europe Market Value (US$ Million) by Component, 2023 to 2033

Figure 74: Europe Market Value (US$ Million) by Data Center Type, 2023 to 2033

Figure 75: Europe Market Value (US$ Million) by End Use, 2023 to 2033

Figure 76: Europe Market Value (US$ Million) by Country, 2023 to 2033

Figure 77: Europe Market Value (US$ Million) Analysis by Country, 2018 to 2033

Figure 78: Europe Market Volume (Units) Analysis by Country, 2018 to 2033

Figure 79: Europe Market Value Share (%) and BPS Analysis by Country, 2023 to 2033

Figure 80: Europe Market Y-o-Y Growth (%) Projections by Country, 2023 to 2033

Figure 81: Europe Market Value (US$ Million) Analysis by Component, 2018 to 2033

Figure 82: Europe Market Volume (Units) Analysis by Component, 2018 to 2033

Figure 83: Europe Market Value Share (%) and BPS Analysis by Component, 2023 to 2033

Figure 84: Europe Market Y-o-Y Growth (%) Projections by Component, 2023 to 2033

Figure 85: Europe Market Value (US$ Million) Analysis by Data Center Type, 2018 to 2033

Figure 86: Europe Market Volume (Units) Analysis by Data Center Type, 2018 to 2033

Figure 87: Europe Market Value Share (%) and BPS Analysis by Data Center Type, 2023 to 2033

Figure 88: Europe Market Y-o-Y Growth (%) Projections by Data Center Type, 2023 to 2033

Figure 89: Europe Market Value (US$ Million) Analysis by End Use, 2018 to 2033

Figure 90: Europe Market Volume (Units) Analysis by End Use, 2018 to 2033

Figure 91: Europe Market Value Share (%) and BPS Analysis by End Use, 2023 to 2033

Figure 92: Europe Market Y-o-Y Growth (%) Projections by End Use, 2023 to 2033

Figure 93: Europe Market Attractiveness by Component, 2023 to 2033

Figure 94: Europe Market Attractiveness by Data Center Type, 2023 to 2033

Figure 95: Europe Market Attractiveness by End Use, 2023 to 2033

Figure 96: Europe Market Attractiveness by Country, 2023 to 2033

Figure 97: Asia Pacific Market Value (US$ Million) by Component, 2023 to 2033

Figure 98: Asia Pacific Market Value (US$ Million) by Data Center Type, 2023 to 2033

Figure 99: Asia Pacific Market Value (US$ Million) by End Use, 2023 to 2033

Figure 100: Asia Pacific Market Value (US$ Million) by Country, 2023 to 2033

Figure 101: Asia Pacific Market Value (US$ Million) Analysis by Country, 2018 to 2033

Figure 102: Asia Pacific Market Volume (Units) Analysis by Country, 2018 to 2033

Figure 103: Asia Pacific Market Value Share (%) and BPS Analysis by Country, 2023 to 2033

Figure 104: Asia Pacific Market Y-o-Y Growth (%) Projections by Country, 2023 to 2033

Figure 105: Asia Pacific Market Value (US$ Million) Analysis by Component, 2018 to 2033

Figure 106: Asia Pacific Market Volume (Units) Analysis by Component, 2018 to 2033

Figure 107: Asia Pacific Market Value Share (%) and BPS Analysis by Component, 2023 to 2033

Figure 108: Asia Pacific Market Y-o-Y Growth (%) Projections by Component, 2023 to 2033

Figure 109: Asia Pacific Market Value (US$ Million) Analysis by Data Center Type, 2018 to 2033

Figure 110: Asia Pacific Market Volume (Units) Analysis by Data Center Type, 2018 to 2033

Figure 111: Asia Pacific Market Value Share (%) and BPS Analysis by Data Center Type, 2023 to 2033

Figure 112: Asia Pacific Market Y-o-Y Growth (%) Projections by Data Center Type, 2023 to 2033

Figure 113: Asia Pacific Market Value (US$ Million) Analysis by End Use, 2018 to 2033

Figure 114: Asia Pacific Market Volume (Units) Analysis by End Use, 2018 to 2033

Figure 115: Asia Pacific Market Value Share (%) and BPS Analysis by End Use, 2023 to 2033

Figure 116: Asia Pacific Market Y-o-Y Growth (%) Projections by End Use, 2023 to 2033

Figure 117: Asia Pacific Market Attractiveness by Component, 2023 to 2033

Figure 118: Asia Pacific Market Attractiveness by Data Center Type, 2023 to 2033

Figure 119: Asia Pacific Market Attractiveness by End Use, 2023 to 2033

Figure 120: Asia Pacific Market Attractiveness by Country, 2023 to 2033

Figure 121: MEA Market Value (US$ Million) by Component, 2023 to 2033

Figure 122: MEA Market Value (US$ Million) by Data Center Type, 2023 to 2033

Figure 123: MEA Market Value (US$ Million) by End Use, 2023 to 2033

Figure 124: MEA Market Value (US$ Million) by Country, 2023 to 2033

Figure 125: MEA Market Value (US$ Million) Analysis by Country, 2018 to 2033

Figure 126: MEA Market Volume (Units) Analysis by Country, 2018 to 2033

Figure 127: MEA Market Value Share (%) and BPS Analysis by Country, 2023 to 2033

Figure 128: MEA Market Y-o-Y Growth (%) Projections by Country, 2023 to 2033

Figure 129: MEA Market Value (US$ Million) Analysis by Component, 2018 to 2033

Figure 130: MEA Market Volume (Units) Analysis by Component, 2018 to 2033

Figure 131: MEA Market Value Share (%) and BPS Analysis by Component, 2023 to 2033

Figure 132: MEA Market Y-o-Y Growth (%) Projections by Component, 2023 to 2033

Figure 133: MEA Market Value (US$ Million) Analysis by Data Center Type, 2018 to 2033

Figure 134: MEA Market Volume (Units) Analysis by Data Center Type, 2018 to 2033

Figure 135: MEA Market Value Share (%) and BPS Analysis by Data Center Type, 2023 to 2033

Figure 136: MEA Market Y-o-Y Growth (%) Projections by Data Center Type, 2023 to 2033

Figure 137: MEA Market Value (US$ Million) Analysis by End Use, 2018 to 2033

Figure 138: MEA Market Volume (Units) Analysis by End Use, 2018 to 2033

Figure 139: MEA Market Value Share (%) and BPS Analysis by End Use, 2023 to 2033

Figure 140: MEA Market Y-o-Y Growth (%) Projections by End Use, 2023 to 2033

Figure 141: MEA Market Attractiveness by Component, 2023 to 2033

Figure 142: MEA Market Attractiveness by Data Center Type, 2023 to 2033

Figure 143: MEA Market Attractiveness by End Use, 2023 to 2033

Figure 144: MEA Market Attractiveness by Country, 2023 to 2033

Frequently Asked Questions

What is the Market Size in 2023? 

The market is valued at USD 2.6 billion in 2023. 

Which are the Key Market Players? 

Rittal, Vertive Holdings, and Schneider Electric are key market players. 

What will the market size be in 2033? 

The market will reach USD 15.9 billion by 2033. 

What drives the sales of data center liquid cooling? 

Rising focus on implementing energy-efficient solutions will drive sales. 

How is the historical performance of the market? 

From 2018 to 2022, the market registered a CAGR of 17.5%. 

Explore Similar Insights

Future Market Insights

Data Center Liquid Cooling Market