Global Probiotic Serum Market Size and Share Forecast Outlook 2025 to 2035

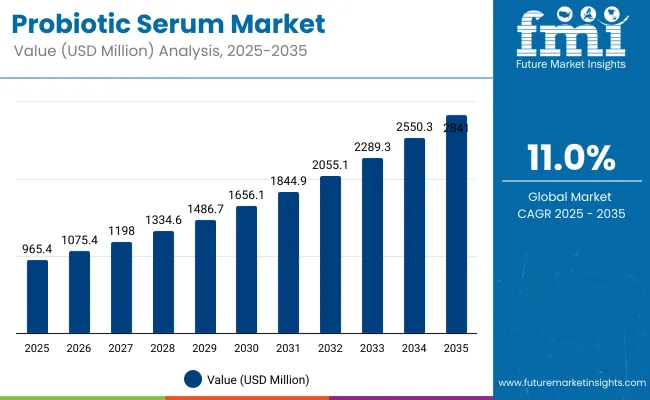
The Global Probiotic Serum Market is expected to record a valuation of USD 965.4 million in 2025 and USD 2,841 million in 2035, with an increase of USD 1,875.6 million, which equals a growth of 194.2% over the decade. The overall expansion represents a CAGR of 11.0% and reflects a nearly 3X increase in market size.
Quick Stats for Global Probiotic Serum Market

  • Global Probiotic Serum Market Value (2025): USD 965.4 million
  • Global Probiotic Serum Forecast Value (2035): USD 2,841 million
  • Global Probiotic Serum Forecast CAGR: 11.0%
  • Leading Segment in 2025: Anti-aging Probiotic Serum (38.1%)
  • Key Growth Regions: Asia-Pacific, North America, Western Europe
  • Top Key Players: L’Oréal S.A., Estée Lauder Companies Inc., Unilever PLC, Aurelia London, Esse Skincare, Gallinée Ltd., TULA Skincare, Glowbiotics, Mother Dirt, Codex Labs, Andalou Naturals, Eminence Organics, LaFlore, H&H Group, REN Clean Skincare

Probiotic Serum Market

Global Probiotic Serum Market Key Takeaways

Metric Value
Market Estimated Value in (2025E) USD 965.4 million
Market Forecast Value in (2035F) USD 2,841 million
Forecast CAGR (2025 to 2035) 11.0%

During the first five-year period from 2025 to 2030, the market increases from USD 965.4 million to USD 1,656.1 million, adding USD 690.7 million, which accounts for 36.8% of the total decade growth. This phase records steady adoption in anti-aging skincare, hydrating barrier-repair routines, and acne-prevention dermocosmetics, driven by growing demand for microbiome-safe solutions. Anti-aging serums dominate this period as they cater to over 38.1% of consumer demand for mature skin-targeting formulations.

The second half from 2030 to 2035 contributes USD 1,184.9 million, equal to 63.2% of total growth, as the market jumps from USD 1,656.1 million to USD 2,841 million. This acceleration is powered by widespread deployment of postbiotic and encapsulated probiotic technologies, AI-personalized skincare routines, and diagnostic-driven serum customization. Multi-benefit, synbiotic, and refillable packaging-based formulations capture a larger share by the end of the decade. Tech-integrated product lines and microbiome-testing kits increase recurring brand loyalty, expanding premium segment penetration beyond 50% of total value.

From 2020 to 2024, the Global Probiotic Cosmetics Market steadily matured, laying the foundation for targeted functional skincare. While creams and moisturizers dominated sales during this phase, serum-based probiotic formulations began gaining traction, contributing to the emergence of niche microbiome-centered brands. The landscape was led by established players such as Unilever, Estée Lauder, and L’Oréal, who leveraged their distribution muscle and brand trust to introduce early probiotic SKUs.

However, serum formats made up a relatively smaller share, as adoption was still limited to dermatological and premium skincare channels. Demand for probiotic serums is projected to reach USD 965.4 million in 2025, shifting the revenue mix toward functional, high-efficacy skincare formats. By 2035, the market will reach USD 2,841 million, driven by innovation in postbiotic, encapsulated, and synbiotic formulations. Traditional cosmetic giants are now facing growing competition from microbiome-first brands such as Esse Skincare, Aurelia London, and Gallinée, which offer scientifically backed, minimalist formulations.

The competitive edge is moving away from traditional cosmetic appeal to clinical validation, ingredient transparency, and digital customization platforms. Emerging players are adopting AI-personalized skincare, cloud-based diagnostic integrations, and subscription models, reflecting the industry's transition toward ecosystem-driven, consumer-centric strategies.

Why the Global Probiotic Serum Market is Growing?

The Global Probiotic Serum Market is expanding steadily due to rising consumer awareness of skin microbiome health and demand for dermatologist-formulated skincare. Postbiotic and encapsulated probiotic technologies have improved product stability and shelf life, making serums more viable for mass and premium retail channels.

Unlike earlier topical probiotics that faced formulation challenges, non-living bioactives like fermented lysates and bacterially derived peptides now allow for real-time skin balancing and barrier restoration, which are increasingly favored by both consumers and formulators. Increased preference for anti-aging skincare routines is also fueling growth. The anti-aging probiotic serum segment alone accounted for 43.6% of the market in 2025, indicating high consumer interest in wrinkle reduction, firmness restoration, and inflammation control via probiotic actives.

The development of AI-personalized skincare platforms, microbiome-testing kits, and subscription-based probiotic regimens are enhancing product stickiness and encouraging brand loyalty in the serum category. Market expansion is further propelled by innovations in ingredient sourcing, such as plant-based and vegan probiotics, and hybrid formulations that blend prebiotics, probiotics, and postbiotics (synbiotics) for cumulative skin benefits.

These advancements have paved the way for broader application in sensitive skin, acne-prone conditions, and hyperpigmentation care. With increasing scientific validation and clinical backing, probiotic serums are being integrated into both retail skincare lines and professional dermatology-based treatments.

Segmental Analysis

The Global Probiotic Serum Market is segmented by product type, formulation type, packaging format, ingredient source, distribution channel, and region. Product type includes hydrating, anti-aging, skin brightening, anti-acne, firming & lifting, calming/sensitive skin, and multi-benefit/all-in-one probiotic serums, each addressing specific skincare concerns like hydration, anti-wrinkle, and blemish control. Formulation type encompasses live probiotics, postbiotics, synbiotics (probiotics + prebiotics), encapsulated probiotics, water-based, gel-based, and oil-based serums, reflecting advancements in ingredient stability and microbiome delivery.

Packaging format covers dropper bottles, airless pump bottles, tubes, sachets & ampoules, refillable bottles, and customizable skincare kits designed to optimize shelf life, usability, and sustainability. Ingredient source includes dairy-based, plant-based/vegan, marine-derived, yeast-derived, and fermented herbal probiotics, aligning with clean-label and ethical beauty trends.

Distribution channels span brand-owned e-commerce, third-party online retailers, pharmacies, dermatology clinics, supermarkets, specialty retailers, and subscription-based skincare platforms, capturing omnichannel shifts in consumer access. Regionally, the market covers North America, Latin America, Western and Eastern Europe, East Asia, South Asia and Pacific, Oceania, and the Middle East and Africa, reflecting global demand growth across mature and emerging skincare economies.
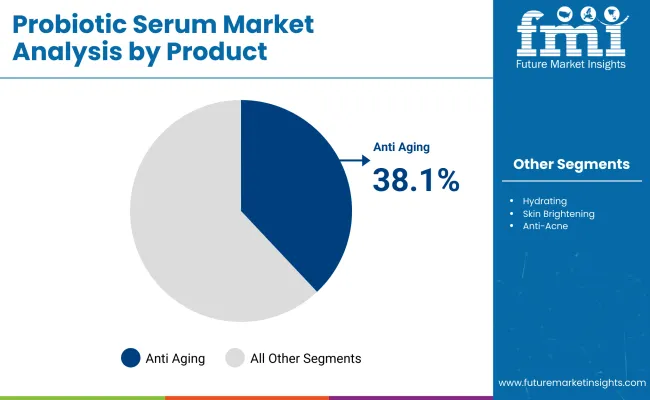
Insights into the Skin concern segmentwith anti aging probiotic serum Leading in Market Share

Probiotic Serum Market By Product

Skin Concern Market Value Share, 2025
Anti aging probiotic serum 38.1%
Others 61.9%

The anti-aging probiotic serum segment is projected to contribute 38.1% of the Global Probiotic Serum Market revenue in 2025, maintaining its lead as the dominant product category. This growth is driven by the increasing consumer shift toward microbiome-safe solutions that address age-related concerns such as fine lines, wrinkles, and loss of skin firmness. Consumers over the age of 30 are actively seeking serums with clinically supported anti-aging benefits, and probiotic activesparticularly postbiotics and encapsulated strainsare gaining traction due to their restorative properties.

The segment’s strong performance is further reinforced by innovation in ingredient delivery systems that enhance penetration and effectiveness without compromising skin sensitivity. As awareness around skin barrier health and inflammation grows, anti-aging formulations that combine probiotics with hyaluronic acid, peptides, or antioxidant complexes are becoming increasingly popular. With clinical trials validating their efficacy and premium skincare brands investing heavily in marketing, the anti-aging probiotic serum segment is expected to remain the cornerstone of product development and revenue generation across global skincare portfolios.
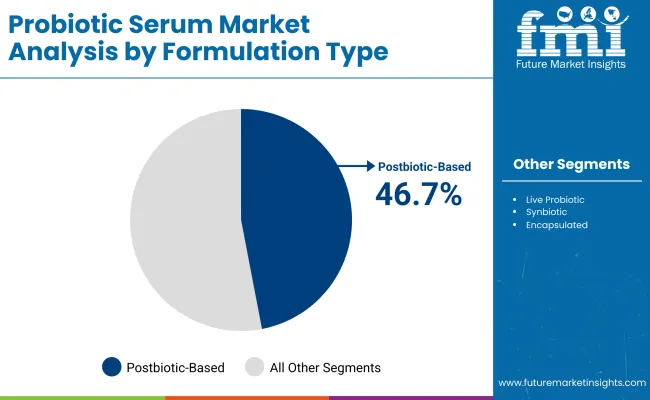
Insights into the product typeSegment with Postbiotic-Based Serums Dominating the Demand

Probiotic Serum Market By Formulation

Product Type Segment Market Value Share, 2025
Postbiotic -Based Serums 46.7%
Others 53.3%

Postbiotic-Based Serums are forecasted to dominate the global probiotic serum market in 2025 with a commanding 46.7% market share. This leadership stems from their superior shelf stability, lower contamination risk, and compatibility with broader formulation matrices compared to live probiotic variants. Their ability to deliver targeted skin microbiome benefits without live bacterial strains has led to greater acceptance among formulators and dermatologists.

As consumers become more aware of skin barrier health and microbiome protection, postbiotic formulations are gaining strong traction across skincare lines. This dominance is also supported by strong innovation pipelines from key players and increased incorporation in anti-aging and calming serum formats. Moving forward, the segment is expected to maintain its leadership due to its scientific validation and expanding cosmetic claims portfolio.

Insights into the Packaging Formatwith Focus on Airless Pump Bottles

Packaging Format Market Value Share, 2025
Airless Pump Bottles 41.4%
Others 58.6%

Airless pump bottles follow closely with a 41.4% market share, driven by their ability to preserve formulation integrity, especially in probiotic-based products. These pumps prevent air exposure and contamination, extending product shelf life and improving dosage precision. The rising focus on formulation efficacy and hygiene is pushing brands to adopt airless solutions.

The ‘Others’ packaging category, which includes dropper bottles, tubes, sachets & ampoules, refillable bottles, and customizable skincare kits, is projected to account for 58.6% of the global probiotic serum market revenue in 2025, establishing it as the leading packaging format. This broad format category caters to diverse consumer preferences, ranging from ease of use in sachets to sustainability in refillables.

What are the Drivers, Restraints, and Key Trends of the Global Probiotic Serum Market?

Drivers Convergence of Anti-Aging & Microbiome Claims

With anti-aging probiotic serums holding 38.1% share in 2025, brands are fusing probiotic lysates with collagen-boosting actives (peptides, bakuchiol) to deliver anti-wrinkle benefits without disturbing skin flora. This dual-function appeal is particularly strong in mature skincare segments in North America, Western Europe, and Japan, where clinical validation drives purchase decisions.

Acceleration from Asia-Pacific High-Growth Markets

India (13.6% CAGR) and China (10.8% CAGR) are the fastest-growing geographies, supported by strong consumer receptiveness to fermented beauty, K-beauty/J-beauty influence, and local production capabilities that reduce cost barriers. Rising urban middle-class spending and a cultural inclination toward “skin health” over purely cosmetic claims are propelling probiotic serum adoption beyond luxury channels.

Restraints

Shelf-Life & Stability Challenges

Live probiotic serums degrade quickly in high-heat, high-humidity markets, reducing active potency before the end of shelf life. Without encapsulation or postbiotic conversion, efficacy claims weaken a critical concern in tropical markets like India and Southeast Asia, limiting retail shelf exposure.

Regulatory Fragmentation in Labeling & Claims

The absence of a standardized global definition for topical “probiotics” creates launch delays and reformulation costs. For example, the EU requires strain ID and viability data, while the USA allows broader cosmetic positioning. This forces multinational brands like L’Oréal and Unilever to develop region-specific SKUs, adding complexity to scaling.

Key Trends

Transition from Live Probiotics to Postbiotic & Encapsulated Formats

The 2030-2035 growth phase (adding USD 1,184.9 Million) is expected to lean heavily on encapsulated lysates and postbiotic actives that maintain potency without cold chain logistics. These formats also align with clean-label and sensitive-skin positioning, opening opportunities for mass-premium distribution.

Tech-Integrated Skincare Ecosystems

Brands are merging probiotic serums with AI skin diagnostics, microbiome testing kits, and subscription refills. This creates personalized formulations that evolve with a customer’s skin condition, increasing lifetime value. Markets like Japan, South Korea, and Tier-1 Chinese cities are already adopting this approach, boosting premium penetration past 50% of category value by 2035.
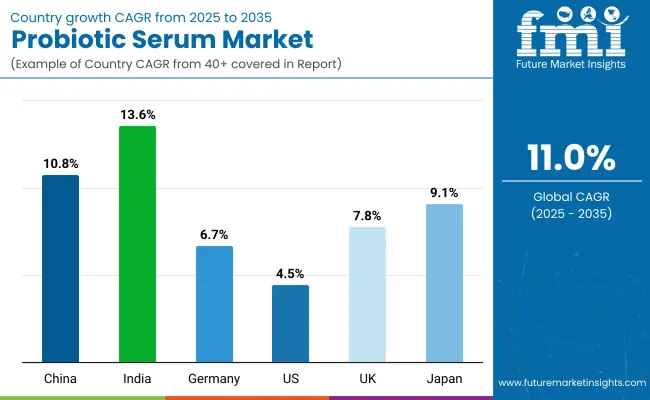
Analysis of Global Probiotic Serum Marketby Key Countries

Probiotic Serum Market By Country

Countries CAGR (2025 to 2035)
China 10.8%
India 13.6%
Germany 6.7%
USA 4.5%
UK 7.8%
Japan 9.1%

The global Probiotic Serum Market exhibits pronounced regional growth disparities, influenced by evolving consumer awareness, urban skincare adoption, and product innovation cycles. Asia-Pacific leads the global expansion, with China growing at a CAGR of 10.8%, making it one of the fastest-growing country markets. Growth in China is driven by rising disposable income, Gen Z-led skincare trends, and domestic innovation in probiotic skincare formulations.

India’s CAGR of 13.6% is the highest among all markets, supported by rapid growth in direct-to-consumer beauty channels and K-beauty inspired demand for microbiome-friendly serums. Europe remains a mature but steadily advancing region, with Germany, the UK, and France contributing to rising clean beauty compliance and sustainability labeling, prompting more probiotic-based product launches.

Germany and the UK show CAGRs of 6.7% and 7.8%, respectively, indicating solid growth in a regulated and ingredients-conscious consumer base. The USA remains the most valuable national market, growing from USD 236.52 million in 2025 to USD 627.86 million by 2035, translating to a CAGR of 4.5%. The market in the USA is shaped by high brand competition, clinically-backed product endorsements, and retailer-led expansion of sensitive-skin probiotics.

In contrast, Japan maintains a steady but modest trajectory with a CAGR of 9.1%, due to the dominance of traditional skincare formats and low penetration of live/encapsulated probiotic formulations. North America as a whole sees a moderate expansion, led by a premiumization trend rather than mass-scale adoption.

Sales Outlook for Probiotic Serum in the United States

Year USA Probiotic Serum Market (USD Million)
2025 236.52
2026 260.78
2027 287.52
2028 317.01
2029 349.52
2030 385.36
2031 424.88
2032 468.45
2033 516.49
2034 569.46
2035 627.86

The Probiotic Serum Market in the United States is projected to grow at a CAGR of 4.5%, increasing from USD 236.52 million in 2025 to USD 627.86 million by 2035, fueled by heightened consumer awareness of skin microbiome health and growing demand for dermatologist-formulated clean beauty products. A significant surge in preference for anti-aging probiotic serums is observed among consumers aged 35-60, with leading brands emphasizing clinical backing and pH-balanced formulations.

Furthermore, premium skincare retailers are expanding probiotic serum offerings under sensitive skin, anti-acne, and multi-benefit categories. Anti-aging use case leads product demand, accounting for the largest market share in 2025 (44.1%), due to consumer focus on microbiome balance, wrinkle reduction, and skin barrier repair.

  • Online and specialty retailers are driving faster adoption, as platforms like Sephora, Ulta, and DTC brands push educational marketing around probiotic skincare.
  • Clinical-grade and lysate-based serums are gaining traction, with dermatologists recommending them for post-treatment skin restoration, fueling premium segment growth.
  • Bundled probiotic regimens and subscription skincare models are becoming popular, encouraging recurring revenue and long-term brand loyalty in the USA market.

Growth and Expansion Outlook for Probiotic Serum Market in the United Kingdom

The Probiotic Serum Market in the United Kingdom is expected to grow at a CAGR of 7.8% from 2025 to 2035. The market share is projected to slightly decline from 8.1% in 2025 to 7.8% in 2035, reflecting stable growth momentum in a competitive premium skincare landscape. The adoption of probiotic skincare is supported by expanding demand for dermatologically approved and clean-label serums, especially among aging and sensitive skin demographics.

UK-based brands are increasingly incorporating postbiotic and live strain innovations to strengthen consumer trust in microbiome-centric skincare. Government-supported sustainability goals and increased vegan product registrations are also contributing to premium product line extensions.

  • Clinical skincare firms are focusing on advanced probiotic formulations targeting mature and sensitive skin.
  • Museums and medical institutes are supporting R&D partnerships for microbiome-focused applications.
  • Retailers are merging AR and skin diagnostic tools to tailor probiotic serum recommendations.

Growth and Expansion Outlook for Probiotic Serum Market in India

India’s Probiotic Serum Market is forecast to grow at a CAGR of 13.6% during 2025-2035, with its global market share rising from 5.1% in 2025 to 6.2% in 2035. This growth is driven by rising consumer awareness of skin microbiome health, especially among millennials and Gen Z in urban and Tier-2 markets.

Local skincare startups and wellness brands are launching cost-effective, Ayurvedic-infused probiotic serums targeting hydration and barrier repair. Increased e-commerce penetration, dermatology-led content on social media, and partnerships with dermatological clinics are further accelerating adoption.

  • MSMEs are expanding affordable product lines featuring Indian herbs with probiotics.
  • Dermatologists are promoting probiotic serums for urban skin concerns like pollution and stress.
  • Regional online platforms are driving adoption in Tier-2 and Tier-3 cities through vernacular campaigns.

Sales Outlook for Probiotic Serum Market in China

Market Share 2025
China 12.2%
India 5.1%
Germany 11.2%
USA 24.5%
UK 8.1%
Japan 7.2%
Market Share 2035
China 13.8%
India 6.2%
Germany 10.4%
USA 22.1%
UK 7.8%
Japan 8.1%

China is expected to record a CAGR of 10.8% in the Probiotic Serum Market, with its global market share growing from 12.2% in 2025 to 13.8% in 2035. This rapid expansion is supported by strong demand for skin resilience and microbiome-balancing products among beauty-conscious consumers.

Homegrown cosmetic companies are leading R&D in live biotic and synbiotic formulations while leveraging TCM (Traditional Chinese Medicine) in hybrid skincare solutions. The popularity of “science-backed beauty” and integration of AI diagnostics on local e-commerce platforms is enabling hyper-personalized probiotic serum recommendations.

  • Smart beauty platforms are using AI tools to guide probiotic serum selection for targeted skin needs.
  • Domestic R&D labs are investing in patented postbiotic and synbiotic combinations.
  • Youth-targeted marketing in Tier-1 cities is driving volume growth, especially in hydrating and anti-aging categories.

Opportunity Analysis of USA Probiotic Serum Market

Skin Concern Segment Market Value Share, 2025
Anti-Aging Probiotic Serum 44.1%
Others 55.9%

The USA Probiotic Serum Market is valued at USD 236.52 million in 2025, with anti-aging probiotic serums leading at 44.1% (USD 104.31 million). This dominance is fueled by the high adoption rate among consumers aged 35-60, who prioritize wrinkle reduction, skin barrier restoration, and microbiome balance. Clinically backed formulations and pH-balanced innovations are driving trust, especially in dermatologist-recommended brands.

Premium skincare retailers such as Sephora and Ulta are expanding probiotic offerings under anti-aging, sensitive skin, and multi-benefit categories, often paired with educational campaigns to highlight microbiome health benefits. This positions anti-aging probiotic serums as a long-term growth anchor in the USA market, with subscription skincare models and bundled regimens ensuring recurring revenue streams.

Opportunity Analysis of China Probiotic Serum Market

Product Segment Market Value Share, 2025
Probiotic Lysate Serums 47.6%
Others 53.4%

The China Probiotic Serum Market is valued at USD 117.78 million in 2025, with probiotic lysate serums leading at 47.6% (USD 56.06 million). This leadership reflects the country’s growing preference for science-backed, microbiome-balancing skincare that offers stability and efficacy over live probiotics. Domestic brands are rapidly innovating lysate-based and synbiotic hybrid formulations, often combining them with Traditional Chinese Medicine (TCM) extracts for holistic skin health benefits.

Integration of AI-powered beauty diagnostics on leading e-commerce platforms is enabling hyper-personalized product recommendations, further boosting lysate serum adoption. Probiotic lysate serums have become a go-to category for urban consumers seeking hydration, anti-aging, and pollution defense in a single formulation.
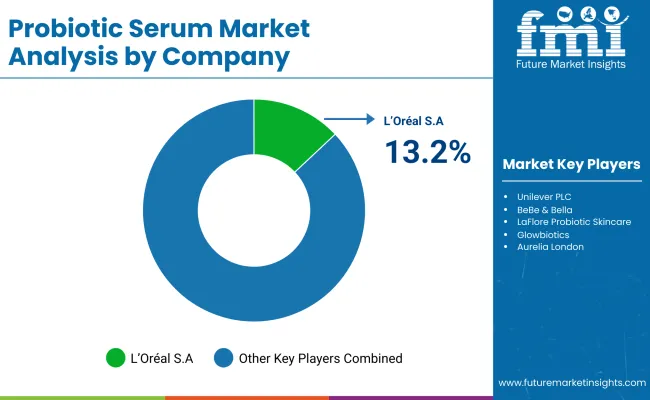
Competitive Landscape of Global Probiotic Serum Market

Probiotic Serum Market By Company

L’Oréal S.A. leads the global probiotic serum market with a dominant 13.2% share in 2025, supported by its strong dermatological skincare portfolio under brands such as La Roche-Posay, Vichy, and SkinCeuticals. The company’s leadership position is reinforced by its Active Cosmetics Division, which focuses on microbiome-safe formulations and clinically backed probiotic lysate technologies.

L’Oréal’s market strength is further anchored in its global omnichannel distribution, robust R&D investments in skin microbiome science, and early adoption of AI-driven skin diagnostics and personalized serum customization tools. The remaining 86.8% of the market is fragmented across multiple dynamic players, including Codex Labs, H&H Group, Clinique Laboratories, Andalou Naturals, Mother Dirt, and LaFlore Probiotic Skincare, among others.

These companies compete by emphasizing clean-label formulations, targeted skin concerns (e.g., calming, anti-aging, hydration), and direct engagement through niche e-commerce platforms and influencer-led campaigns. The “Others” category also reflects the growth of indie skincare brands and regional innovators that prioritize ingredient transparency, live probiotic technology, and novel delivery systems like encapsulated strains and synbiotic complexes.

As the market matures, competitive differentiation is expected to shift toward clinically validated efficacy, microbiome-specific ingredient innovation, and sustainability credentials in both formulation and packaging. L’Oréal’s strategic edge lies in its ability to integrate science, personalization, and premium retail execution at a global scale.

Key Developments in Global Probiotic Serum Market

  • On April 15, 2025, Unilever launched Cif Infinite Clean, a probiotic-based cleaning spray under its mainstream brand portfolio. The product uses dormant microbial spores that remain active for 72 hours on surfaces, signaling Unilever’s broader commitment to microbiome-driven innovation. While not a skincare item, analysts view it as a precursor to translatable delivery systems for probiotic beauty and personal care products in future pipelines.
  • On May 20, 2025, Codex Labs was granted USA Patent No. 12,194,068 for its ShaantClearSkin Probiotic 2.0 supplement formulated for oily and acne-prone skin. In an 8-week open-label clinical study, the product demonstrated a 58% reduction in inflammatory lesions and a 49% reduction in non-inflammatory lesions, supporting its claim as a science-backed, ingestible skincare breakthrough targeting the gut-skin axis.

Scope of the Report

Item Value
Quantitative Units USD 965.4 million
Product Type Hydrating Probiotic Serum, Anti-aging Probiotic Serum, Skin Brightening Probiotic Serum, Anti-acne Probiotic Serum, Firming & Lifting Probiotic Serum, Calming/Sensitive Skin Probiotic Serum, Multi-Benefit/All-in-One Probiotic Serum
Formulation Type Live Probiotic Serums, Postbiotic - Based Serums, Synbiotic Serums, Encapsulated Probiotic Serums, Water-Based Probiotic Serums, Gel-Based Probiotic Serums, Oil-Based Probiotic Serums
Packaging Format Glass Bottles with Droppers, Airless Pump Bottles, Tubes, Ampoules/Vials, Sachets
Sales Channel Online (Brand-Owned E-commerce, Third-Party Marketplaces), Offline (Supermarkets/Hypermarkets, Specialty Stores, Pharmacies, Departmental Stores)
Regions Covered North America, Europe, Asia-Pacific, Latin America, Middle East & Africa
Country Covered United States, Canada, Germany, France, United Kingdom, China, Japan, India, Brazil, South Africa
Key Companies Profiled Unilever PLC, BeBe & Bella, LaFlore Probiotic Skincare, Codex Labs, Esse Skincare, Gallinée, TULA Skincare, Glowbiotics, Aurelia London, Mother Dirt
Additional Attributes Dollar sales by product type and end-use channel, adoption trends in anti-aging, hydrating, and microbiome-repair routines, rising demand for travel-sized and refillable probiotic serum packaging, sector-specific growth in dermatology clinics, premium beauty retail, and wellness subscription services, digital platform-driven revenue segmentation via AI skin profiling and app-connected diagnostics, integration with AR-based virtual try-on tools and microbiome-mapping wearables, regional trends influenced by e-commerce personalization and K-beauty innovation cycles, and advancements in postbiotic stabilization, synbiotic complex delivery systems, and microencapsulation technologies are defining the evolving contours of the probiotic serum market landscape.

Key Segments

By Skin Concern:

  • Hydrating Probiotic Serums
  • Anti-Aging Probiotic Serums
  • Soothing / Anti-Redness Probiotic Serums
  • Brightening Probiotic Serums
  • Acne-Fighting Probiotic Serums

By Product Type:

  • Live Probiotic Serums
  • Probiotic Lysate Serums
  • Prebiotic Serums

By Packaging type:

  • Dropper Bottles
  • Airless Pump Bottles
  • Tubes
  • Sachets & Ampoules
  • Refillable Bottles
  • Customizable Skincare Kits

By Ingredient Source:

  • Dairy-Based Probiotics
  • Plant-Based/Vegan Probiotics
  • Marine-Derived Probiotics
  • Yeast-Derived Probiotics
  • Fermented Herbal Extracts

By Distribution Channel:

  • Online Channel
    • Brand-owned Online Platforms
    • Third-party E-commerce
  • Offline Channel
    • Hypermarkets & Supermarkets
    • Specialty Beauty Retailers
    • Pharmacies & Drugstores
    • Dermatology & Aesthetic Clinics
    • Subscription-based D2C Skincare Platforms

By Region:

  • North America
  • Latin America
  • Europe
  • East Asia
  • South Asia & Pacific
  • Middle East and Africa

Table of Content

  1. Executive Summary
    • Global Market Outlook
    • Demand-side Trends
    • Supply-side Trends
    • Technology Roadmap Analysis
    • Analysis and Recommendations
  2. Market Overview
    • Market Coverage / Taxonomy
    • Market Definition / Scope / Limitations
  3. Market Background
    • Market Dynamics
      • Drivers
      • Restraints
      • Opportunity
      • Trends
    • Scenario Forecast
      • Demand in Optimistic Scenario
      • Demand in Likely Scenario
      • Demand in Conservative Scenario
    • Opportunity Map Analysis
    • Product Life Cycle Analysis
    • Supply Chain Analysis
      • Supply Side Participants and their Roles
        • Producers
        • Mid-Level Participants (Traders/ Agents/ Brokers)
        • Wholesalers and Distributors
      • Value Added and Value Created at Node in the Supply Chain
      • List of Raw Material Suppliers
      • List of Existing and Potential Buyer’s
    • Investment Feasibility Matrix
    • Value Chain Analysis
      • Profit Margin Analysis
      • Wholesalers and Distributors
      • Retailers
    • PESTLE and Porter’s Analysis
    • Regulatory Landscape
      • By Key Regions
      • By Key Countries
    • Regional Parent Market Outlook
    • Production and Consumption Statistics
    • Import and Export Statistics
  4. Global Market Analysis 2020 to 2024 and Forecast, 2025 to 2035
    • Historical Market Size Value (USD Million) & Volume (Units) Analysis, 2020 to 2024
    • Current and Future Market Size Value (USD Million) & Volume (Units) Projections, 2025 to 2035
      • Y-o-Y Growth Trend Analysis
      • Absolute $ Opportunity Analysis
  5. Global Market Analysis 2020 to 2024 and Forecast 2025 to 2035, By Skin Concern
    • Introduction / Key Findings
    • Historical Market Size Value (USD Million) & Volume (Units) Analysis By Skin Concern, 2020 to 2024
    • Current and Future Market Size Value (USD Million) & Volume (Units) Analysis and Forecast By Skin Concern, 2025 to 2035
      • Hydrating Probiotic Serums
      • Anti-Aging Probiotic Serums
      • Soothing / Anti-Redness Probiotic Serums
      • Brightening Probiotic Serums
      • Acne-Fighting Probiotic Serums
    • Y-o-Y Growth Trend Analysis By Skin Concern, 2020 to 2024
    • Absolute $ Opportunity Analysis By Skin Concern, 2025 to 2035
  6. Global Market Analysis 2020 to 2024 and Forecast 2025 to 2035, By Product Type
    • Introduction / Key Findings
    • Historical Market Size Value (USD Million) & Volume (Units) Analysis By Product Type , 2020 to 2024
    • Current and Future Market Size Value (USD Million) & Volume (Units) Analysis and Forecast By Product Type , 2025 to 2035
      • Live Probiotic Serums
      • Probiotic Lysate Serums
      • Prebiotic Serums
    • Y-o-Y Growth Trend Analysis By Product Type , 2020 to 2024
    • Absolute $ Opportunity Analysis By Product Type , 2025 to 2035
  7. Global Market Analysis 2020 to 2024 and Forecast 2025 to 2035, By Packaging type
    • Introduction / Key Findings
    • Historical Market Size Value (USD Million) & Volume (Units) Analysis By Packaging type, 2020 to 2024
    • Current and Future Market Size Value (USD Million) & Volume (Units) Analysis and Forecast By Packaging type, 2025 to 2035
      • Dropper Bottles
      • Airless Pump Bottles
      • Tubes
      • Sachets & Ampoules
      • Refillable Bottles
      • Customizable Skincare Kits
    • Y-o-Y Growth Trend Analysis By Packaging type, 2020 to 2024
    • Absolute $ Opportunity Analysis By Packaging type, 2025 to 2035
  8. Global Market Analysis 2020 to 2024 and Forecast 2025 to 2035, By Ingredient Source
    • Introduction / Key Findings
    • Historical Market Size Value (USD Million) & Volume (Units) Analysis By Ingredient Source, 2020 to 2024
    • Current and Future Market Size Value (USD Million) & Volume (Units) Analysis and Forecast By Ingredient Source, 2025 to 2035
      • Dairy-Based Probiotics
      • Plant-Based/Vegan Probiotics
      • Marine-Derived Probiotics
      • Yeast-Derived Probiotics
      • Fermented Herbal Extracts
    • Y-o-Y Growth Trend Analysis By Ingredient Source, 2020 to 2024
    • Absolute $ Opportunity Analysis By Ingredient Source, 2025 to 2035
  9. Global Market Analysis 2020 to 2024 and Forecast 2025 to 2035, By Distribution Channel
    • Introduction / Key Findings
    • Historical Market Size Value (USD Million) & Volume (Units) Analysis By Distribution Channel, 2020 to 2024
    • Current and Future Market Size Value (USD Million) & Volume (Units) Analysis and Forecast By Distribution Channel, 2025 to 2035
      • Online Channel
        • Brand-owned Online Platforms
        • Third-party E-commerce
      • Offline Channel
        • Hypermarkets & Supermarkets
        • Specialty Beauty Retailers
        • Pharmacies & Drugstores
        • Dermatology & Aesthetic Clinics
        • Subscription-based D2C Skincare Platforms
    • Y-o-Y Growth Trend Analysis By Distribution Channel, 2020 to 2024
    • Absolute $ Opportunity Analysis By Distribution Channel, 2025 to 2035
  10. Global Market Analysis 2020 to 2024 and Forecast 2025 to 2035, By Region
    • Introduction
    • Historical Market Size Value (USD Million) & Volume (Units) Analysis By Region, 2020 to 2024
    • Current Market Size Value (USD Million) & Volume (Units) Analysis and Forecast By Region, 2025 to 2035
      • North America
      • Latin America
      • Europe
      • East Asia
      • South Asia & Pacific
      • Middle East and Africa
    • Market Attractiveness Analysis By Region
  11. North America Market Analysis 2020 to 2024 and Forecast 2025 to 2035, By Country
    • Historical Market Size Value (USD Million) & Volume (Units) Trend Analysis By Market Taxonomy, 2020 to 2024
    • Market Size Value (USD Million) & Volume (Units) Forecast By Market Taxonomy, 2025 to 2035
      • By Country
        • USA
        • Canada
      • By Skin Concern
      • By Product Type
      • By Packaging type
      • By Ingredient Source
      • By Distribution Channel
    • Market Attractiveness Analysis
      • By Country
      • By Skin Concern
      • By Product Type
      • By Packaging type
      • By Ingredient Source
      • By Distribution Channel
    • Key Takeaways
  12. Latin America Market Analysis 2020 to 2024 and Forecast 2025 to 2035, By Country
    • Historical Market Size Value (USD Million) & Volume (Units) Trend Analysis By Market Taxonomy, 2020 to 2024
    • Market Size Value (USD Million) & Volume (Units) Forecast By Market Taxonomy, 2025 to 2035
      • By Country
        • Brazil
        • Mexico
        • Colombia
        • Rest of Latin America
      • By Skin Concern
      • By Product Type
      • By Packaging type
      • By Ingredient Source
      • By Distribution Channel
    • Market Attractiveness Analysis
      • By Country
      • By Skin Concern
      • By Product Type
      • By Packaging type
      • By Ingredient Source
      • By Distribution Channel
    • Key Takeaways
  13. Europe Market Analysis 2020 to 2024 and Forecast 2025 to 2035, By Country
    • Historical Market Size Value (USD Million) & Volume (Units) Trend Analysis By Market Taxonomy, 2020 to 2024
    • Market Size Value (USD Million) & Volume (Units) Forecast By Market Taxonomy, 2025 to 2035
      • By Country
        • Germany
        • UK
        • France
        • Italy
        • Spain
        • Belgium
        • Netherlands
        • Nordic
        • Switzerland
        • Russia
        • Poland
        • Rest of Europe
      • By Skin Concern
      • By Product Type
      • By Packaging type
      • By Ingredient Source
      • By Distribution Channel
    • Market Attractiveness Analysis
      • By Country
      • By Skin Concern
      • By Product Type
      • By Packaging type
      • By Ingredient Source
      • By Distribution Channel
    • Key Takeaways
  14. East Asia Market Analysis 2020 to 2024 and Forecast 2025 to 2035, By Country
    • Historical Market Size Value (USD Million) & Volume (Units) Trend Analysis By Market Taxonomy, 2020 to 2024
    • Market Size Value (USD Million) & Volume (Units) Forecast By Market Taxonomy, 2025 to 2035
      • By Country
        • China
        • Japan
        • South Korea
      • By Skin Concern
      • By Product Type
      • By Packaging type
      • By Ingredient Source
      • By Distribution Channel
    • Market Attractiveness Analysis
      • By Country
      • By Skin Concern
      • By Product Type
      • By Packaging type
      • By Ingredient Source
      • By Distribution Channel
    • Key Takeaways
  15. South Asia & Pacific Market Analysis 2020 to 2024 and Forecast 2025 to 2035, By Country
    • Historical Market Size Value (USD Million) & Volume (Units) Trend Analysis By Market Taxonomy, 2020 to 2024
    • Market Size Value (USD Million) & Volume (Units) Forecast By Market Taxonomy, 2025 to 2035
      • By Country
        • India
        • Thailand
        • Malaysia
        • Indonesia
        • Singapore
        • Vietnam
        • Australia
        • New Zealand
        • Rest of South Asia
      • By Skin Concern
      • By Product Type
      • By Packaging type
      • By Ingredient Source
      • By Distribution Channel
    • Market Attractiveness Analysis
      • By Country
      • By Skin Concern
      • By Product Type
      • By Packaging type
      • By Ingredient Source
      • By Distribution Channel
    • Key Takeaways
  16. Middle East and Africa Market Analysis 2020 to 2024 and Forecast 2025 to 2035, By Country
    • Historical Market Size Value (USD Million) & Volume (Units) Trend Analysis By Market Taxonomy, 2020 to 2024
    • Market Size Value (USD Million) & Volume (Units) Forecast By Market Taxonomy, 2025 to 2035
      • By Country
        • Turkey
        • UAE
        • Saudi Arabia
        • Israel
        • Other GCC Countries
        • North Africa
        • South Africa
      • By Skin Concern
      • By Product Type
      • By Packaging type
      • By Ingredient Source
      • By Distribution Channel
    • Market Attractiveness Analysis
      • By Country
      • By Skin Concern
      • By Product Type
      • By Packaging type
      • By Ingredient Source
      • By Distribution Channel
    • Key Takeaways
  17. Key Countries Market Analysis
    • USA
      • Pricing Analysis
      • Market Share Analysis, 2024
        • By Skin Concern
        • By Product Type
        • By Packaging type
        • By Ingredient Source
        • By Distribution Channel
    • Canada
      • Pricing Analysis
      • Market Share Analysis, 2024
        • By Skin Concern
        • By Product Type
        • By Packaging type
        • By Ingredient Source
        • By Distribution Channel
    • Brazil
      • Pricing Analysis
      • Market Share Analysis, 2024
        • By Skin Concern
        • By Product Type
        • By Packaging type
        • By Ingredient Source
        • By Distribution Channel
    • Mexico
      • Pricing Analysis
      • Market Share Analysis, 2024
        • By Skin Concern
        • By Product Type
        • By Packaging type
        • By Ingredient Source
        • By Distribution Channel
    • Colombia
      • Pricing Analysis
      • Market Share Analysis, 2024
        • By Skin Concern
        • By Product Type
        • By Packaging type
        • By Ingredient Source
        • By Distribution Channel
    • Germany
      • Pricing Analysis
      • Market Share Analysis, 2024
        • By Skin Concern
        • By Product Type
        • By Packaging type
        • By Ingredient Source
        • By Distribution Channel
    • UK
      • Pricing Analysis
      • Market Share Analysis, 2024
        • By Skin Concern
        • By Product Type
        • By Packaging type
        • By Ingredient Source
        • By Distribution Channel
    • France
      • Pricing Analysis
      • Market Share Analysis, 2024
        • By Skin Concern
        • By Product Type
        • By Packaging type
        • By Ingredient Source
        • By Distribution Channel
    • Italy
      • Pricing Analysis
      • Market Share Analysis, 2024
        • By Skin Concern
        • By Product Type
        • By Packaging type
        • By Ingredient Source
        • By Distribution Channel
    • Spain
      • Pricing Analysis
      • Market Share Analysis, 2024
        • By Skin Concern
        • By Product Type
        • By Packaging type
        • By Ingredient Source
        • By Distribution Channel
    • Belgium
      • Pricing Analysis
      • Market Share Analysis, 2024
        • By Skin Concern
        • By Product Type
        • By Packaging type
        • By Ingredient Source
        • By Distribution Channel
    • Netherlands
      • Pricing Analysis
      • Market Share Analysis, 2024
        • By Skin Concern
        • By Product Type
        • By Packaging type
        • By Ingredient Source
        • By Distribution Channel
    • Nordic
      • Pricing Analysis
      • Market Share Analysis, 2024
        • By Skin Concern
        • By Product Type
        • By Packaging type
        • By Ingredient Source
        • By Distribution Channel
    • Switzerland
      • Pricing Analysis
      • Market Share Analysis, 2024
        • By Skin Concern
        • By Product Type
        • By Packaging type
        • By Ingredient Source
        • By Distribution Channel
    • Russia
      • Pricing Analysis
      • Market Share Analysis, 2024
        • By Skin Concern
        • By Product Type
        • By Packaging type
        • By Ingredient Source
        • By Distribution Channel
    • Poland
      • Pricing Analysis
      • Market Share Analysis, 2024
        • By Skin Concern
        • By Product Type
        • By Packaging type
        • By Ingredient Source
        • By Distribution Channel
    • China
      • Pricing Analysis
      • Market Share Analysis, 2024
        • By Skin Concern
        • By Product Type
        • By Packaging type
        • By Ingredient Source
        • By Distribution Channel
    • Japan
      • Pricing Analysis
      • Market Share Analysis, 2024
        • By Skin Concern
        • By Product Type
        • By Packaging type
        • By Ingredient Source
        • By Distribution Channel
    • South Korea
      • Pricing Analysis
      • Market Share Analysis, 2024
        • By Skin Concern
        • By Product Type
        • By Packaging type
        • By Ingredient Source
        • By Distribution Channel
    • India
      • Pricing Analysis
      • Market Share Analysis, 2024
        • By Skin Concern
        • By Product Type
        • By Packaging type
        • By Ingredient Source
        • By Distribution Channel
    • Thailand
      • Pricing Analysis
      • Market Share Analysis, 2024
        • By Skin Concern
        • By Product Type
        • By Packaging type
        • By Ingredient Source
        • By Distribution Channel
    • Indonesia
      • Pricing Analysis
      • Market Share Analysis, 2024
        • By Skin Concern
        • By Product Type
        • By Packaging type
        • By Ingredient Source
        • By Distribution Channel
    • Australia
      • Pricing Analysis
      • Market Share Analysis, 2024
        • By Skin Concern
        • By Product Type
        • By Packaging type
        • By Ingredient Source
        • By Distribution Channel
    • New Zealand
      • Pricing Analysis
      • Market Share Analysis, 2024
        • By Skin Concern
        • By Product Type
        • By Packaging type
        • By Ingredient Source
        • By Distribution Channel
    • Turkey
      • Pricing Analysis
      • Market Share Analysis, 2024
        • By Skin Concern
        • By Product Type
        • By Packaging type
        • By Ingredient Source
        • By Distribution Channel
    • UAE
      • Pricing Analysis
      • Market Share Analysis, 2024
        • By Skin Concern
        • By Product Type
        • By Packaging type
        • By Ingredient Source
        • By Distribution Channel
    • Saudi Arabia
      • Pricing Analysis
      • Market Share Analysis, 2024
        • By Skin Concern
        • By Product Type
        • By Packaging type
        • By Ingredient Source
        • By Distribution Channel
    • Israel
      • Pricing Analysis
      • Market Share Analysis, 2024
        • By Skin Concern
        • By Product Type
        • By Packaging type
        • By Ingredient Source
        • By Distribution Channel
    • North Africa
      • Pricing Analysis
      • Market Share Analysis, 2024
        • By Skin Concern
        • By Product Type
        • By Packaging type
        • By Ingredient Source
        • By Distribution Channel
    • South Africa
      • Pricing Analysis
      • Market Share Analysis, 2024
        • By Skin Concern
        • By Product Type
        • By Packaging type
        • By Ingredient Source
        • By Distribution Channel
  18. Market Structure Analysis
    • Competition Dashboard
    • Competition Benchmarking
    • Market Share Analysis of Top Players
      • By Regional
      • By Skin Concern
      • By Product Type
      • By Packaging type
      • By Ingredient Source
      • By Distribution Channel
  19. Competition Analysis
    • Competition Deep Dive
      • L’Oréal S.A.
        • Overview
        • Product Portfolio
        • Profitability by Market Segments (Product/Age /Sales Channel/Region)
        • Sales Footprint
        • Strategy Overview
          • Marketing Strategy
          • Product Strategy
          • Channel Strategy
      • The Estée Lauder Companies Inc.
        • Overview
        • Product Portfolio
        • Profitability by Market Segments (Product/Age /Sales Channel/Region)
        • Sales Footprint
        • Strategy Overview
          • Marketing Strategy
          • Product Strategy
          • Channel Strategy
      • Unilever PLC
        • Overview
        • Product Portfolio
        • Profitability by Market Segments (Product/Age /Sales Channel/Region)
        • Sales Footprint
        • Strategy Overview
          • Marketing Strategy
          • Product Strategy
          • Channel Strategy
      • Shiseido Company, Limited
        • Overview
        • Product Portfolio
        • Profitability by Market Segments (Product/Age /Sales Channel/Region)
        • Sales Footprint
        • Strategy Overview
          • Marketing Strategy
          • Product Strategy
          • Channel Strategy
      • Amorepacific Corporation
        • Overview
        • Product Portfolio
        • Profitability by Market Segments (Product/Age /Sales Channel/Region)
        • Sales Footprint
        • Strategy Overview
          • Marketing Strategy
          • Product Strategy
          • Channel Strategy
      • Beiersdorf AG
        • Overview
        • Product Portfolio
        • Profitability by Market Segments (Product/Age /Sales Channel/Region)
        • Sales Footprint
        • Strategy Overview
          • Marketing Strategy
          • Product Strategy
          • Channel Strategy
      • Johnson & Johnson (Kenvue)
        • Overview
        • Product Portfolio
        • Profitability by Market Segments (Product/Age /Sales Channel/Region)
        • Sales Footprint
        • Strategy Overview
          • Marketing Strategy
          • Product Strategy
          • Channel Strategy
      • Procter & Gamble Co. (P&G)
        • Overview
        • Product Portfolio
        • Profitability by Market Segments (Product/Age /Sales Channel/Region)
        • Sales Footprint
        • Strategy Overview
          • Marketing Strategy
          • Product Strategy
          • Channel Strategy
      • Symrise AG
        • Overview
        • Product Portfolio
        • Profitability by Market Segments (Product/Age /Sales Channel/Region)
        • Sales Footprint
        • Strategy Overview
          • Marketing Strategy
          • Product Strategy
          • Channel Strategy
      • DSM-Firmenich
        • Overview
        • Product Portfolio
        • Profitability by Market Segments (Product/Age /Sales Channel/Region)
        • Sales Footprint
        • Strategy Overview
          • Marketing Strategy
          • Product Strategy
          • Channel Strategy
      • Probi AB
        • Overview
        • Product Portfolio
        • Profitability by Market Segments (Product/Age /Sales Channel/Region)
        • Sales Footprint
        • Strategy Overview
          • Marketing Strategy
          • Product Strategy
          • Channel Strategy
      • Lactobio A/S
        • Overview
        • Product Portfolio
        • Profitability by Market Segments (Product/Age /Sales Channel/Region)
        • Sales Footprint
        • Strategy Overview
          • Marketing Strategy
          • Product Strategy
          • Channel Strategy
      • Gallinée Ltd.
        • Overview
        • Product Portfolio
        • Profitability by Market Segments (Product/Age /Sales Channel/Region)
        • Sales Footprint
        • Strategy Overview
          • Marketing Strategy
          • Product Strategy
          • Channel Strategy
      • CLR Berlin GmbH
        • Overview
        • Product Portfolio
        • Profitability by Market Segments (Product/Age /Sales Channel/Region)
        • Sales Footprint
        • Strategy Overview
          • Marketing Strategy
          • Product Strategy
          • Channel Strategy
      • THT - Technological Herbal Therapies
        • Overview
        • Product Portfolio
        • Profitability by Market Segments (Product/Age /Sales Channel/Region)
        • Sales Footprint
        • Strategy Overview
          • Marketing Strategy
          • Product Strategy
          • Channel Strategy
  20. Assumptions & Acronyms Used
  21. Research Methodology

List of Tables

  • Table 1: Global Market Value (USD Million) Forecast by Region, 2020-2035
  • Table 2: Global Market Volume (Units) Forecast by Region, 2020-2035
  • Table 3: Global Market Value (USD Million) Forecast by Skin Concern, 2020-2035
  • Table 4: Global Market Volume (Units) Forecast by Skin Concern, 2020-2035
  • Table 5: Global Market Value (USD Million) Forecast by Product Type , 2020-2035
  • Table 6: Global Market Volume (Units) Forecast by Product Type , 2020-2035
  • Table 7: Global Market Value (USD Million) Forecast by Packaging type, 2020-2035
  • Table 8: Global Market Volume (Units) Forecast by Packaging type, 2020-2035
  • Table 9: Global Market Value (USD Million) Forecast by Ingredient Source, 2020-2035
  • Table 10: Global Market Volume (Units) Forecast by Ingredient Source, 2020-2035
  • Table 11: Global Market Value (USD Million) Forecast by Distribution Channel, 2020-2035
  • Table 12: Global Market Volume (Units) Forecast by Distribution Channel, 2020-2035
  • Table 13: North America Market Value (USD Million) Forecast by Country, 2020-2035
  • Table 14: North America Market Volume (Units) Forecast by Country, 2020-2035
  • Table 15: North America Market Value (USD Million) Forecast by Skin Concern, 2020-2035
  • Table 16: North America Market Volume (Units) Forecast by Skin Concern, 2020-2035
  • Table 17: North America Market Value (USD Million) Forecast by Product Type , 2020-2035
  • Table 18: North America Market Volume (Units) Forecast by Product Type , 2020-2035
  • Table 19: North America Market Value (USD Million) Forecast by Packaging type, 2020-2035
  • Table 20: North America Market Volume (Units) Forecast by Packaging type, 2020-2035
  • Table 21: North America Market Value (USD Million) Forecast by Ingredient Source, 2020-2035
  • Table 22: North America Market Volume (Units) Forecast by Ingredient Source, 2020-2035
  • Table 23: North America Market Value (USD Million) Forecast by Distribution Channel, 2020-2035
  • Table 24: North America Market Volume (Units) Forecast by Distribution Channel, 2020-2035
  • Table 25: Latin America Market Value (USD Million) Forecast by Country, 2020-2035
  • Table 26: Latin America Market Volume (Units) Forecast by Country, 2020-2035
  • Table 27: Latin America Market Value (USD Million) Forecast by Skin Concern, 2020-2035
  • Table 28: Latin America Market Volume (Units) Forecast by Skin Concern, 2020-2035
  • Table 29: Latin America Market Value (USD Million) Forecast by Product Type , 2020-2035
  • Table 30: Latin America Market Volume (Units) Forecast by Product Type , 2020-2035
  • Table 31: Latin America Market Value (USD Million) Forecast by Packaging type, 2020-2035
  • Table 32: Latin America Market Volume (Units) Forecast by Packaging type, 2020-2035
  • Table 33: Latin America Market Value (USD Million) Forecast by Ingredient Source, 2020-2035
  • Table 34: Latin America Market Volume (Units) Forecast by Ingredient Source, 2020-2035
  • Table 35: Latin America Market Value (USD Million) Forecast by Distribution Channel, 2020-2035
  • Table 36: Latin America Market Volume (Units) Forecast by Distribution Channel, 2020-2035
  • Table 37: Europe Market Value (USD Million) Forecast by Country, 2020-2035
  • Table 38: Europe Market Volume (Units) Forecast by Country, 2020-2035
  • Table 39: Europe Market Value (USD Million) Forecast by Skin Concern, 2020-2035
  • Table 40: Europe Market Volume (Units) Forecast by Skin Concern, 2020-2035
  • Table 41: Europe Market Value (USD Million) Forecast by Product Type , 2020-2035
  • Table 42: Europe Market Volume (Units) Forecast by Product Type , 2020-2035
  • Table 43: Europe Market Value (USD Million) Forecast by Packaging type, 2020-2035
  • Table 44: Europe Market Volume (Units) Forecast by Packaging type, 2020-2035
  • Table 45: Europe Market Value (USD Million) Forecast by Ingredient Source, 2020-2035
  • Table 46: Europe Market Volume (Units) Forecast by Ingredient Source, 2020-2035
  • Table 47: Europe Market Value (USD Million) Forecast by Distribution Channel, 2020-2035
  • Table 48: Europe Market Volume (Units) Forecast by Distribution Channel, 2020-2035
  • Table 49: East Asia Market Value (USD Million) Forecast by Country, 2020-2035
  • Table 50: East Asia Market Volume (Units) Forecast by Country, 2020-2035
  • Table 51: East Asia Market Value (USD Million) Forecast by Skin Concern, 2020-2035
  • Table 52: East Asia Market Volume (Units) Forecast by Skin Concern, 2020-2035
  • Table 53: East Asia Market Value (USD Million) Forecast by Product Type , 2020-2035
  • Table 54: East Asia Market Volume (Units) Forecast by Product Type , 2020-2035
  • Table 55: East Asia Market Value (USD Million) Forecast by Packaging type, 2020-2035
  • Table 56: East Asia Market Volume (Units) Forecast by Packaging type, 2020-2035
  • Table 57: East Asia Market Value (USD Million) Forecast by Ingredient Source, 2020-2035
  • Table 58: East Asia Market Volume (Units) Forecast by Ingredient Source, 2020-2035
  • Table 59: East Asia Market Value (USD Million) Forecast by Distribution Channel, 2020-2035
  • Table 60: East Asia Market Volume (Units) Forecast by Distribution Channel, 2020-2035
  • Table 61: South Asia & Pacific Market Value (USD Million) Forecast by Country, 2020-2035
  • Table 62: South Asia & Pacific Market Volume (Units) Forecast by Country, 2020-2035
  • Table 63: South Asia & Pacific Market Value (USD Million) Forecast by Skin Concern, 2020-2035
  • Table 64: South Asia & Pacific Market Volume (Units) Forecast by Skin Concern, 2020-2035
  • Table 65: South Asia & Pacific Market Value (USD Million) Forecast by Product Type , 2020-2035
  • Table 66: South Asia & Pacific Market Volume (Units) Forecast by Product Type , 2020-2035
  • Table 67: South Asia & Pacific Market Value (USD Million) Forecast by Packaging type, 2020-2035
  • Table 68: South Asia & Pacific Market Volume (Units) Forecast by Packaging type, 2020-2035
  • Table 69: South Asia & Pacific Market Value (USD Million) Forecast by Ingredient Source, 2020-2035
  • Table 70: South Asia & Pacific Market Volume (Units) Forecast by Ingredient Source, 2020-2035
  • Table 71: South Asia & Pacific Market Value (USD Million) Forecast by Distribution Channel, 2020-2035
  • Table 72: South Asia & Pacific Market Volume (Units) Forecast by Distribution Channel, 2020-2035
  • Table 73: Middle East and Africa Market Value (USD Million) Forecast by Country, 2020-2035
  • Table 74: Middle East and Africa Market Volume (Units) Forecast by Country, 2020-2035
  • Table 75: Middle East and Africa Market Value (USD Million) Forecast by Skin Concern, 2020-2035
  • Table 76: Middle East and Africa Market Volume (Units) Forecast by Skin Concern, 2020-2035
  • Table 77: Middle East and Africa Market Value (USD Million) Forecast by Product Type , 2020-2035
  • Table 78: Middle East and Africa Market Volume (Units) Forecast by Product Type , 2020-2035
  • Table 79: Middle East and Africa Market Value (USD Million) Forecast by Packaging type, 2020-2035
  • Table 80: Middle East and Africa Market Volume (Units) Forecast by Packaging type, 2020-2035
  • Table 81: Middle East and Africa Market Value (USD Million) Forecast by Ingredient Source, 2020-2035
  • Table 82: Middle East and Africa Market Volume (Units) Forecast by Ingredient Source, 2020-2035
  • Table 83: Middle East and Africa Market Value (USD Million) Forecast by Distribution Channel, 2020-2035
  • Table 84: Middle East and Africa Market Volume (Units) Forecast by Distribution Channel, 2020-2035

List of Figures

  • Figure 1: Global Market Value (USD Million) by Skin Concern, 2025-2035
  • Figure 2: Global Market Value (USD Million) by Product Type , 2025-2035
  • Figure 3: Global Market Value (USD Million) by Packaging type, 2025-2035
  • Figure 4: Global Market Value (USD Million) by Ingredient Source, 2025-2035
  • Figure 5: Global Market Value (USD Million) by Distribution Channel, 2025-2035
  • Figure 6: Global Market Value (USD Million) by Region, 2025-2035
  • Figure 7: Global Market Value (USD Million) Analysis by Region, 2020-2035
  • Figure 8: Global Market Volume (Units) Analysis by Region, 2020-2035
  • Figure 9: Global Market Value Share (%) and BPS Analysis by Region, 2025-2035
  • Figure 10: Global Market Y-o-Y Growth (%) Projections by Region, 2025-2035
  • Figure 11: Global Market Value (USD Million) Analysis by Skin Concern, 2020-2035
  • Figure 12: Global Market Volume (Units) Analysis by Skin Concern, 2020-2035
  • Figure 13: Global Market Value Share (%) and BPS Analysis by Skin Concern, 2025-2035
  • Figure 14: Global Market Y-o-Y Growth (%) Projections by Skin Concern, 2025-2035
  • Figure 15: Global Market Value (USD Million) Analysis by Product Type , 2020-2035
  • Figure 16: Global Market Volume (Units) Analysis by Product Type , 2020-2035
  • Figure 17: Global Market Value Share (%) and BPS Analysis by Product Type , 2025-2035
  • Figure 18: Global Market Y-o-Y Growth (%) Projections by Product Type , 2025-2035
  • Figure 19: Global Market Value (USD Million) Analysis by Packaging type, 2020-2035
  • Figure 20: Global Market Volume (Units) Analysis by Packaging type, 2020-2035
  • Figure 21: Global Market Value Share (%) and BPS Analysis by Packaging type, 2025-2035
  • Figure 22: Global Market Y-o-Y Growth (%) Projections by Packaging type, 2025-2035
  • Figure 23: Global Market Value (USD Million) Analysis by Ingredient Source, 2020-2035
  • Figure 24: Global Market Volume (Units) Analysis by Ingredient Source, 2020-2035
  • Figure 25: Global Market Value Share (%) and BPS Analysis by Ingredient Source, 2025-2035
  • Figure 26: Global Market Y-o-Y Growth (%) Projections by Ingredient Source, 2025-2035
  • Figure 27: Global Market Value (USD Million) Analysis by Distribution Channel, 2020-2035
  • Figure 28: Global Market Volume (Units) Analysis by Distribution Channel, 2020-2035
  • Figure 29: Global Market Value Share (%) and BPS Analysis by Distribution Channel, 2025-2035
  • Figure 30: Global Market Y-o-Y Growth (%) Projections by Distribution Channel, 2025-2035
  • Figure 31: Global Market Attractiveness by Skin Concern, 2025-2035
  • Figure 32: Global Market Attractiveness by Product Type , 2025-2035
  • Figure 33: Global Market Attractiveness by Packaging type, 2025-2035
  • Figure 34: Global Market Attractiveness by Ingredient Source, 2025-2035
  • Figure 35: Global Market Attractiveness by Distribution Channel, 2025-2035
  • Figure 36: Global Market Attractiveness by Region, 2025-2035
  • Figure 37: North America Market Value (USD Million) by Skin Concern, 2025-2035
  • Figure 38: North America Market Value (USD Million) by Product Type , 2025-2035
  • Figure 39: North America Market Value (USD Million) by Packaging type, 2025-2035
  • Figure 40: North America Market Value (USD Million) by Ingredient Source, 2025-2035
  • Figure 41: North America Market Value (USD Million) by Distribution Channel, 2025-2035
  • Figure 42: North America Market Value (USD Million) by Country, 2025-2035
  • Figure 43: North America Market Value (USD Million) Analysis by Country, 2020-2035
  • Figure 44: North America Market Volume (Units) Analysis by Country, 2020-2035
  • Figure 45: North America Market Value Share (%) and BPS Analysis by Country, 2025-2035
  • Figure 46: North America Market Y-o-Y Growth (%) Projections by Country, 2025-2035
  • Figure 47: North America Market Value (USD Million) Analysis by Skin Concern, 2020-2035
  • Figure 48: North America Market Volume (Units) Analysis by Skin Concern, 2020-2035
  • Figure 49: North America Market Value Share (%) and BPS Analysis by Skin Concern, 2025-2035
  • Figure 50: North America Market Y-o-Y Growth (%) Projections by Skin Concern, 2025-2035
  • Figure 51: North America Market Value (USD Million) Analysis by Product Type , 2020-2035
  • Figure 52: North America Market Volume (Units) Analysis by Product Type , 2020-2035
  • Figure 53: North America Market Value Share (%) and BPS Analysis by Product Type , 2025-2035
  • Figure 54: North America Market Y-o-Y Growth (%) Projections by Product Type , 2025-2035
  • Figure 55: North America Market Value (USD Million) Analysis by Packaging type, 2020-2035
  • Figure 56: North America Market Volume (Units) Analysis by Packaging type, 2020-2035
  • Figure 57: North America Market Value Share (%) and BPS Analysis by Packaging type, 2025-2035
  • Figure 58: North America Market Y-o-Y Growth (%) Projections by Packaging type, 2025-2035
  • Figure 59: North America Market Value (USD Million) Analysis by Ingredient Source, 2020-2035
  • Figure 60: North America Market Volume (Units) Analysis by Ingredient Source, 2020-2035
  • Figure 61: North America Market Value Share (%) and BPS Analysis by Ingredient Source, 2025-2035
  • Figure 62: North America Market Y-o-Y Growth (%) Projections by Ingredient Source, 2025-2035
  • Figure 63: North America Market Value (USD Million) Analysis by Distribution Channel, 2020-2035
  • Figure 64: North America Market Volume (Units) Analysis by Distribution Channel, 2020-2035
  • Figure 65: North America Market Value Share (%) and BPS Analysis by Distribution Channel, 2025-2035
  • Figure 66: North America Market Y-o-Y Growth (%) Projections by Distribution Channel, 2025-2035
  • Figure 67: North America Market Attractiveness by Skin Concern, 2025-2035
  • Figure 68: North America Market Attractiveness by Product Type , 2025-2035
  • Figure 69: North America Market Attractiveness by Packaging type, 2025-2035
  • Figure 70: North America Market Attractiveness by Ingredient Source, 2025-2035
  • Figure 71: North America Market Attractiveness by Distribution Channel, 2025-2035
  • Figure 72: North America Market Attractiveness by Country, 2025-2035
  • Figure 73: Latin America Market Value (USD Million) by Skin Concern, 2025-2035
  • Figure 74: Latin America Market Value (USD Million) by Product Type , 2025-2035
  • Figure 75: Latin America Market Value (USD Million) by Packaging type, 2025-2035
  • Figure 76: Latin America Market Value (USD Million) by Ingredient Source, 2025-2035
  • Figure 77: Latin America Market Value (USD Million) by Distribution Channel, 2025-2035
  • Figure 78: Latin America Market Value (USD Million) by Country, 2025-2035
  • Figure 79: Latin America Market Value (USD Million) Analysis by Country, 2020-2035
  • Figure 80: Latin America Market Volume (Units) Analysis by Country, 2020-2035
  • Figure 81: Latin America Market Value Share (%) and BPS Analysis by Country, 2025-2035
  • Figure 82: Latin America Market Y-o-Y Growth (%) Projections by Country, 2025-2035
  • Figure 83: Latin America Market Value (USD Million) Analysis by Skin Concern, 2020-2035
  • Figure 84: Latin America Market Volume (Units) Analysis by Skin Concern, 2020-2035
  • Figure 85: Latin America Market Value Share (%) and BPS Analysis by Skin Concern, 2025-2035
  • Figure 86: Latin America Market Y-o-Y Growth (%) Projections by Skin Concern, 2025-2035
  • Figure 87: Latin America Market Value (USD Million) Analysis by Product Type , 2020-2035
  • Figure 88: Latin America Market Volume (Units) Analysis by Product Type , 2020-2035
  • Figure 89: Latin America Market Value Share (%) and BPS Analysis by Product Type , 2025-2035
  • Figure 90: Latin America Market Y-o-Y Growth (%) Projections by Product Type , 2025-2035
  • Figure 91: Latin America Market Value (USD Million) Analysis by Packaging type, 2020-2035
  • Figure 92: Latin America Market Volume (Units) Analysis by Packaging type, 2020-2035
  • Figure 93: Latin America Market Value Share (%) and BPS Analysis by Packaging type, 2025-2035
  • Figure 94: Latin America Market Y-o-Y Growth (%) Projections by Packaging type, 2025-2035
  • Figure 95: Latin America Market Value (USD Million) Analysis by Ingredient Source, 2020-2035
  • Figure 96: Latin America Market Volume (Units) Analysis by Ingredient Source, 2020-2035
  • Figure 97: Latin America Market Value Share (%) and BPS Analysis by Ingredient Source, 2025-2035
  • Figure 98: Latin America Market Y-o-Y Growth (%) Projections by Ingredient Source, 2025-2035
  • Figure 99: Latin America Market Value (USD Million) Analysis by Distribution Channel, 2020-2035
  • Figure 100: Latin America Market Volume (Units) Analysis by Distribution Channel, 2020-2035
  • Figure 101: Latin America Market Value Share (%) and BPS Analysis by Distribution Channel, 2025-2035
  • Figure 102: Latin America Market Y-o-Y Growth (%) Projections by Distribution Channel, 2025-2035
  • Figure 103: Latin America Market Attractiveness by Skin Concern, 2025-2035
  • Figure 104: Latin America Market Attractiveness by Product Type , 2025-2035
  • Figure 105: Latin America Market Attractiveness by Packaging type, 2025-2035
  • Figure 106: Latin America Market Attractiveness by Ingredient Source, 2025-2035
  • Figure 107: Latin America Market Attractiveness by Distribution Channel, 2025-2035
  • Figure 108: Latin America Market Attractiveness by Country, 2025-2035
  • Figure 109: Europe Market Value (USD Million) by Skin Concern, 2025-2035
  • Figure 110: Europe Market Value (USD Million) by Product Type , 2025-2035
  • Figure 111: Europe Market Value (USD Million) by Packaging type, 2025-2035
  • Figure 112: Europe Market Value (USD Million) by Ingredient Source, 2025-2035
  • Figure 113: Europe Market Value (USD Million) by Distribution Channel, 2025-2035
  • Figure 114: Europe Market Value (USD Million) by Country, 2025-2035
  • Figure 115: Europe Market Value (USD Million) Analysis by Country, 2020-2035
  • Figure 116: Europe Market Volume (Units) Analysis by Country, 2020-2035
  • Figure 117: Europe Market Value Share (%) and BPS Analysis by Country, 2025-2035
  • Figure 118: Europe Market Y-o-Y Growth (%) Projections by Country, 2025-2035
  • Figure 119: Europe Market Value (USD Million) Analysis by Skin Concern, 2020-2035
  • Figure 120: Europe Market Volume (Units) Analysis by Skin Concern, 2020-2035
  • Figure 121: Europe Market Value Share (%) and BPS Analysis by Skin Concern, 2025-2035
  • Figure 122: Europe Market Y-o-Y Growth (%) Projections by Skin Concern, 2025-2035
  • Figure 123: Europe Market Value (USD Million) Analysis by Product Type , 2020-2035
  • Figure 124: Europe Market Volume (Units) Analysis by Product Type , 2020-2035
  • Figure 125: Europe Market Value Share (%) and BPS Analysis by Product Type , 2025-2035
  • Figure 126: Europe Market Y-o-Y Growth (%) Projections by Product Type , 2025-2035
  • Figure 127: Europe Market Value (USD Million) Analysis by Packaging type, 2020-2035
  • Figure 128: Europe Market Volume (Units) Analysis by Packaging type, 2020-2035
  • Figure 129: Europe Market Value Share (%) and BPS Analysis by Packaging type, 2025-2035
  • Figure 130: Europe Market Y-o-Y Growth (%) Projections by Packaging type, 2025-2035
  • Figure 131: Europe Market Value (USD Million) Analysis by Ingredient Source, 2020-2035
  • Figure 132: Europe Market Volume (Units) Analysis by Ingredient Source, 2020-2035
  • Figure 133: Europe Market Value Share (%) and BPS Analysis by Ingredient Source, 2025-2035
  • Figure 134: Europe Market Y-o-Y Growth (%) Projections by Ingredient Source, 2025-2035
  • Figure 135: Europe Market Value (USD Million) Analysis by Distribution Channel, 2020-2035
  • Figure 136: Europe Market Volume (Units) Analysis by Distribution Channel, 2020-2035
  • Figure 137: Europe Market Value Share (%) and BPS Analysis by Distribution Channel, 2025-2035
  • Figure 138: Europe Market Y-o-Y Growth (%) Projections by Distribution Channel, 2025-2035
  • Figure 139: Europe Market Attractiveness by Skin Concern, 2025-2035
  • Figure 140: Europe Market Attractiveness by Product Type , 2025-2035
  • Figure 141: Europe Market Attractiveness by Packaging type, 2025-2035
  • Figure 142: Europe Market Attractiveness by Ingredient Source, 2025-2035
  • Figure 143: Europe Market Attractiveness by Distribution Channel, 2025-2035
  • Figure 144: Europe Market Attractiveness by Country, 2025-2035
  • Figure 145: East Asia Market Value (USD Million) by Skin Concern, 2025-2035
  • Figure 146: East Asia Market Value (USD Million) by Product Type , 2025-2035
  • Figure 147: East Asia Market Value (USD Million) by Packaging type, 2025-2035
  • Figure 148: East Asia Market Value (USD Million) by Ingredient Source, 2025-2035
  • Figure 149: East Asia Market Value (USD Million) by Distribution Channel, 2025-2035
  • Figure 150: East Asia Market Value (USD Million) by Country, 2025-2035
  • Figure 151: East Asia Market Value (USD Million) Analysis by Country, 2020-2035
  • Figure 152: East Asia Market Volume (Units) Analysis by Country, 2020-2035
  • Figure 153: East Asia Market Value Share (%) and BPS Analysis by Country, 2025-2035
  • Figure 154: East Asia Market Y-o-Y Growth (%) Projections by Country, 2025-2035
  • Figure 155: East Asia Market Value (USD Million) Analysis by Skin Concern, 2020-2035
  • Figure 156: East Asia Market Volume (Units) Analysis by Skin Concern, 2020-2035
  • Figure 157: East Asia Market Value Share (%) and BPS Analysis by Skin Concern, 2025-2035
  • Figure 158: East Asia Market Y-o-Y Growth (%) Projections by Skin Concern, 2025-2035
  • Figure 159: East Asia Market Value (USD Million) Analysis by Product Type , 2020-2035
  • Figure 160: East Asia Market Volume (Units) Analysis by Product Type , 2020-2035
  • Figure 161: East Asia Market Value Share (%) and BPS Analysis by Product Type , 2025-2035
  • Figure 162: East Asia Market Y-o-Y Growth (%) Projections by Product Type , 2025-2035
  • Figure 163: East Asia Market Value (USD Million) Analysis by Packaging type, 2020-2035
  • Figure 164: East Asia Market Volume (Units) Analysis by Packaging type, 2020-2035
  • Figure 165: East Asia Market Value Share (%) and BPS Analysis by Packaging type, 2025-2035
  • Figure 166: East Asia Market Y-o-Y Growth (%) Projections by Packaging type, 2025-2035
  • Figure 167: East Asia Market Value (USD Million) Analysis by Ingredient Source, 2020-2035
  • Figure 168: East Asia Market Volume (Units) Analysis by Ingredient Source, 2020-2035
  • Figure 169: East Asia Market Value Share (%) and BPS Analysis by Ingredient Source, 2025-2035
  • Figure 170: East Asia Market Y-o-Y Growth (%) Projections by Ingredient Source, 2025-2035
  • Figure 171: East Asia Market Value (USD Million) Analysis by Distribution Channel, 2020-2035
  • Figure 172: East Asia Market Volume (Units) Analysis by Distribution Channel, 2020-2035
  • Figure 173: East Asia Market Value Share (%) and BPS Analysis by Distribution Channel, 2025-2035
  • Figure 174: East Asia Market Y-o-Y Growth (%) Projections by Distribution Channel, 2025-2035
  • Figure 175: East Asia Market Attractiveness by Skin Concern, 2025-2035
  • Figure 176: East Asia Market Attractiveness by Product Type , 2025-2035
  • Figure 177: East Asia Market Attractiveness by Packaging type, 2025-2035
  • Figure 178: East Asia Market Attractiveness by Ingredient Source, 2025-2035
  • Figure 179: East Asia Market Attractiveness by Distribution Channel, 2025-2035
  • Figure 180: East Asia Market Attractiveness by Country, 2025-2035
  • Figure 181: South Asia & Pacific Market Value (USD Million) by Skin Concern, 2025-2035
  • Figure 182: South Asia & Pacific Market Value (USD Million) by Product Type , 2025-2035
  • Figure 183: South Asia & Pacific Market Value (USD Million) by Packaging type, 2025-2035
  • Figure 184: South Asia & Pacific Market Value (USD Million) by Ingredient Source, 2025-2035
  • Figure 185: South Asia & Pacific Market Value (USD Million) by Distribution Channel, 2025-2035
  • Figure 186: South Asia & Pacific Market Value (USD Million) by Country, 2025-2035
  • Figure 187: South Asia & Pacific Market Value (USD Million) Analysis by Country, 2020-2035
  • Figure 188: South Asia & Pacific Market Volume (Units) Analysis by Country, 2020-2035
  • Figure 189: South Asia & Pacific Market Value Share (%) and BPS Analysis by Country, 2025-2035
  • Figure 190: South Asia & Pacific Market Y-o-Y Growth (%) Projections by Country, 2025-2035
  • Figure 191: South Asia & Pacific Market Value (USD Million) Analysis by Skin Concern, 2020-2035
  • Figure 192: South Asia & Pacific Market Volume (Units) Analysis by Skin Concern, 2020-2035
  • Figure 193: South Asia & Pacific Market Value Share (%) and BPS Analysis by Skin Concern, 2025-2035
  • Figure 194: South Asia & Pacific Market Y-o-Y Growth (%) Projections by Skin Concern, 2025-2035
  • Figure 195: South Asia & Pacific Market Value (USD Million) Analysis by Product Type , 2020-2035
  • Figure 196: South Asia & Pacific Market Volume (Units) Analysis by Product Type , 2020-2035
  • Figure 197: South Asia & Pacific Market Value Share (%) and BPS Analysis by Product Type , 2025-2035
  • Figure 198: South Asia & Pacific Market Y-o-Y Growth (%) Projections by Product Type , 2025-2035
  • Figure 199: South Asia & Pacific Market Value (USD Million) Analysis by Packaging type, 2020-2035
  • Figure 200: South Asia & Pacific Market Volume (Units) Analysis by Packaging type, 2020-2035
  • Figure 201: South Asia & Pacific Market Value Share (%) and BPS Analysis by Packaging type, 2025-2035
  • Figure 202: South Asia & Pacific Market Y-o-Y Growth (%) Projections by Packaging type, 2025-2035
  • Figure 203: South Asia & Pacific Market Value (USD Million) Analysis by Ingredient Source, 2020-2035
  • Figure 204: South Asia & Pacific Market Volume (Units) Analysis by Ingredient Source, 2020-2035
  • Figure 205: South Asia & Pacific Market Value Share (%) and BPS Analysis by Ingredient Source, 2025-2035
  • Figure 206: South Asia & Pacific Market Y-o-Y Growth (%) Projections by Ingredient Source, 2025-2035
  • Figure 207: South Asia & Pacific Market Value (USD Million) Analysis by Distribution Channel, 2020-2035
  • Figure 208: South Asia & Pacific Market Volume (Units) Analysis by Distribution Channel, 2020-2035
  • Figure 209: South Asia & Pacific Market Value Share (%) and BPS Analysis by Distribution Channel, 2025-2035
  • Figure 210: South Asia & Pacific Market Y-o-Y Growth (%) Projections by Distribution Channel, 2025-2035
  • Figure 211: South Asia & Pacific Market Attractiveness by Skin Concern, 2025-2035
  • Figure 212: South Asia & Pacific Market Attractiveness by Product Type , 2025-2035
  • Figure 213: South Asia & Pacific Market Attractiveness by Packaging type, 2025-2035
  • Figure 214: South Asia & Pacific Market Attractiveness by Ingredient Source, 2025-2035
  • Figure 215: South Asia & Pacific Market Attractiveness by Distribution Channel, 2025-2035
  • Figure 216: South Asia & Pacific Market Attractiveness by Country, 2025-2035
  • Figure 217: Middle East and Africa Market Value (USD Million) by Skin Concern, 2025-2035
  • Figure 218: Middle East and Africa Market Value (USD Million) by Product Type , 2025-2035
  • Figure 219: Middle East and Africa Market Value (USD Million) by Packaging type, 2025-2035
  • Figure 220: Middle East and Africa Market Value (USD Million) by Ingredient Source, 2025-2035
  • Figure 221: Middle East and Africa Market Value (USD Million) by Distribution Channel, 2025-2035
  • Figure 222: Middle East and Africa Market Value (USD Million) by Country, 2025-2035
  • Figure 223: Middle East and Africa Market Value (USD Million) Analysis by Country, 2020-2035
  • Figure 224: Middle East and Africa Market Volume (Units) Analysis by Country, 2020-2035
  • Figure 225: Middle East and Africa Market Value Share (%) and BPS Analysis by Country, 2025-2035
  • Figure 226: Middle East and Africa Market Y-o-Y Growth (%) Projections by Country, 2025-2035
  • Figure 227: Middle East and Africa Market Value (USD Million) Analysis by Skin Concern, 2020-2035
  • Figure 228: Middle East and Africa Market Volume (Units) Analysis by Skin Concern, 2020-2035
  • Figure 229: Middle East and Africa Market Value Share (%) and BPS Analysis by Skin Concern, 2025-2035
  • Figure 230: Middle East and Africa Market Y-o-Y Growth (%) Projections by Skin Concern, 2025-2035
  • Figure 231: Middle East and Africa Market Value (USD Million) Analysis by Product Type , 2020-2035
  • Figure 232: Middle East and Africa Market Volume (Units) Analysis by Product Type , 2020-2035
  • Figure 233: Middle East and Africa Market Value Share (%) and BPS Analysis by Product Type , 2025-2035
  • Figure 234: Middle East and Africa Market Y-o-Y Growth (%) Projections by Product Type , 2025-2035
  • Figure 235: Middle East and Africa Market Value (USD Million) Analysis by Packaging type, 2020-2035
  • Figure 236: Middle East and Africa Market Volume (Units) Analysis by Packaging type, 2020-2035
  • Figure 237: Middle East and Africa Market Value Share (%) and BPS Analysis by Packaging type, 2025-2035
  • Figure 238: Middle East and Africa Market Y-o-Y Growth (%) Projections by Packaging type, 2025-2035
  • Figure 239: Middle East and Africa Market Value (USD Million) Analysis by Ingredient Source, 2020-2035
  • Figure 240: Middle East and Africa Market Volume (Units) Analysis by Ingredient Source, 2020-2035
  • Figure 241: Middle East and Africa Market Value Share (%) and BPS Analysis by Ingredient Source, 2025-2035
  • Figure 242: Middle East and Africa Market Y-o-Y Growth (%) Projections by Ingredient Source, 2025-2035
  • Figure 243: Middle East and Africa Market Value (USD Million) Analysis by Distribution Channel, 2020-2035
  • Figure 244: Middle East and Africa Market Volume (Units) Analysis by Distribution Channel, 2020-2035
  • Figure 245: Middle East and Africa Market Value Share (%) and BPS Analysis by Distribution Channel, 2025-2035
  • Figure 246: Middle East and Africa Market Y-o-Y Growth (%) Projections by Distribution Channel, 2025-2035
  • Figure 247: Middle East and Africa Market Attractiveness by Skin Concern, 2025-2035
  • Figure 248: Middle East and Africa Market Attractiveness by Product Type , 2025-2035
  • Figure 249: Middle East and Africa Market Attractiveness by Packaging type, 2025-2035
  • Figure 250: Middle East and Africa Market Attractiveness by Ingredient Source, 2025-2035
  • Figure 251: Middle East and Africa Market Attractiveness by Distribution Channel, 2025-2035
  • Figure 252: Middle East and Africa Market Attractiveness by Country, 2025-2035

Frequently Asked Questions

How big is the Probiotic Serum Market in 2025?

The global Probiotic Serum Market is estimated to be valued at USD 965.4 million in 2025.

What will be the size of the Probiotic Serum Market in 2035?

The market size for the Probiotic Serum Market is projected to reach USD 2,841 million by 2035.

How much will the Probiotic Serum Market grow between 2025 and 2035?

The Probiotic Serum Market is expected to grow at a 11% CAGR between 2025 and 2035.

What are the key product types in the Probiotic Serum Market?

The key product types in the Probiotic Serum Market include Anti-aging, Hydrating, Skin Brightening, Anti-acne, Firming & Lifting, Calming, Repairing, Oil Control, and Others.

Which product type will contribute a significant share to the Probiotic Serum Market in 2025?

In terms of product type, Anti-aging Probiotic Serum is projected to command 43.6% share of the global market in 2025.

Explore Similar Insights

Future Market Insights

Probiotic Serum Market