Probiotic Beverage Market Size, Share & Forecast Outlook 2025 to 2035

The probiotic beverage market is expected to expand from USD 31.7 billion in 2025 to USD 75.8 billion by 2035, reflecting a CAGR of 9.1%. The industry growth is driven by the increasing demand for functional beverages that offer health benefits such as improved digestion and enhanced immunity.
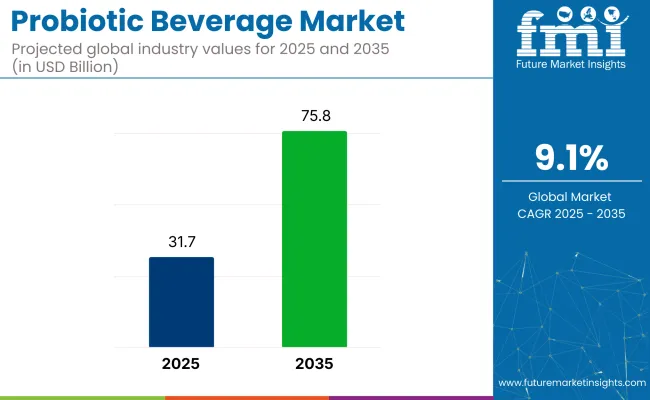
Quick Stats for the Probiotic Beverage Market

  • Industry Value (2025): USD 31.7 billion
  • Forecast Value (2035): USD 75.8 billion
  • Forecast CAGR: 9.1%
  • Leading Segment in 2025: Kombucha (28% share)
  • Key Growth Region: Asia Pacific (China, India)
  • Top Key Players: GT's Living Foods, Danone S.A., Yakult Honsha Co., Ltd., Nestlé S.A., KeVita (PepsiCo)

Probiotic Beverage Market

The industry’s expansion is fueled by the growing popularity of kombucha, kefir, and other probiotic-infused drinks. Consumer interest in health and wellness, particularly among adults aged 31-50, is driving the industry forward, with retail channels accounting for the largest share of the distribution network. The increasing availability of these products through various distribution channels, including retail, online, and foodservice outlets, is expected to further boost industry growth.

The Economic Times article, "A billion-dollar idea born out of gut feeling," discusses the rise of Poppi, a prebiotic soda brand, which was born from the founders' desire to create a healthier alternative to traditional sodas. The brand’s focus on gut health and its use of apple cider vinegar as a key ingredient resonated with health-conscious consumers.

Poppi’s unique positioning in the functional beverage space has led to its rapid growth, attracting significant investment. In 2025, PepsiCo announced its acquisition of Poppi, further solidifying the brand's success in the burgeoning industry.

The industry holds a growing but specialized share within its parent markets. In the functional beverages market, it accounts for approximately 5-7%, driven by the increasing demand for beverages offering health benefits like improved digestion and immunity. Within the health and wellness market, the share is around 3-5%, as probiotic drinks are consumed for their overall health benefits.

In the dairy products market, probiotic drinks represent about 2-4%, as many of these drinks are dairy-based, like yogurt and kefir. In the fermented food and beverage market, their share is approximately 10-12%, as probiotic drinks are a popular category of fermented products. In the natural and organic products market, the share is around 3-5%, with organic probiotic drinks appealing to health-conscious consumers.

Probiotic Beverage Market Analyzed by Key Investment Segments

The industry is segmented by product type, including kombucha, kefir, and probiotic shots. Distribution occurs through retail channels, online platforms, and foodservice. Consumer demographics range from children to older adults, with the largest demand from adults (31-50).

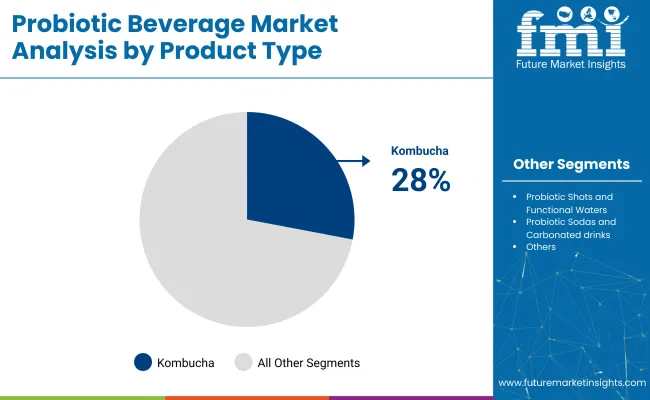
Kombucha to capture 28% industry share in 2025

Kombucha is projected to dominate the industry, capturing an estimated 28% share in 2025. This fermented tea drink is increasingly popular due to its health benefits, such as aiding digestion, boosting immunity, and providing natural energy. Kombucha’s appeal is further enhanced by its wide variety of flavors and alcohol content variations, catering to a broad consumer base.

The global rise in demand for functional beverages, particularly among health-conscious consumers, drives kombucha’s growth. Leading companies like GT's Living Foods and Health-Ade Kombucha are expanding their product offerings to include flavored, alcohol-free, and sugar-reduced versions, ensuring kombucha’s continued industry leadership.
  • Popular for its health benefits, including digestion aid and immunity boost
  • Wide variety of flavors and alcohol content variations attract diverse consumers
  • Growing awareness of gut health and wellness supports its industry growth

Probiotic Beverage Market Analysis By Product Type

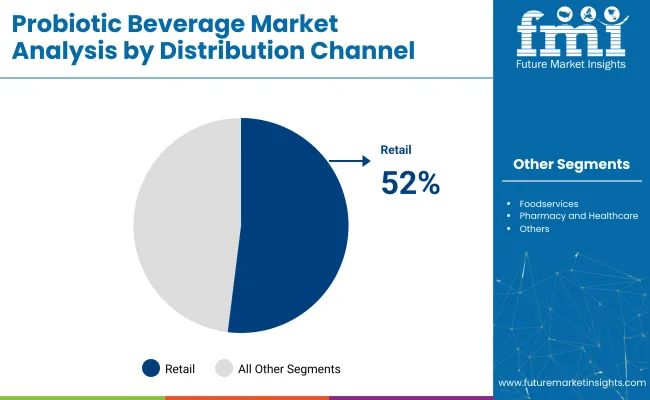
Retail channels to dominate distribution with 52% share in 2025

Retail channels are projected to capture 52% of the industry distribution in 2025. Supermarkets, hypermarkets, and health food stores remain key contributors by offering easy access to a broad range of probiotic drinks, including kombucha and kefir. Convenience stores and specialty beverage retailers also play an increasing role as consumers seek healthier, on-the-go drink alternatives.

The growing awareness of the health benefits of probiotics, coupled with the expansion of product offerings in retail channels, will drive significant growth. Major players like Danone S.A. and Yakult Honsha Co., Ltd. continue to invest in expanding product availability to meet rising consumer demand.
  • Supermarkets and health food stores offer broad access to probiotic drinks
  • Convenience stores and specialty retailers contribute to the rise in retail distribution
  • Expanding retail offerings and growing consumer health awareness drive industry growth

Probiotic Beverage Market Analysis By Distribution Channel

Adults (31-50) to lead consumer demographics with 40% industry share in 2025

Adults aged 31-50 are expected to represent the largest consumer group for probiotic drinks, capturing 40% of the industry share in 2025. This demographic is increasingly focused on health and wellness, particularly digestive health, driving the demand for probiotic drinks.

Adults in this age group are more likely to incorporate probiotics into their daily routines for benefits such as improved gut health, immune support, and overall well-being. Companies are catering to this demographic by developing low-sugar options, enhanced functionality, and convenient packaging. The growing demand from health-conscious adults is expected to significantly influence the industry’s growth.

  • Focused on digestive health, immune support, and overall wellness
  • More likely to incorporate probiotics into daily routines for health benefits
  • Companies are developing products with low-sugar options and convenient packaging

Probiotic Beverage Market Dynamics

The industry is driven by the increasing demand for health-focused drinks, particularly kombucha and kefir. However, challenges such as production complexities, high costs, and regulatory hurdles may limit industry growth, necessitating innovations and cost-effective solutions.

Growing Consumer Interest in Health and Wellness Driving Industry Expansion

The industry is expanding due to rising consumer interest in health and wellness. As people become more health-conscious, there is an increased demand for functional beverages that support digestion, immunity, and overall well-being.

Drinks like kombucha, kefir, and functional waters are gaining popularity as healthier, natural alternatives to sugary beverages. The growing understanding of the gut-brain connection and the benefits of probiotics for both mental and physical health are further propelling industry growth.

  • Health-conscious consumers are driving demand for functional probiotic drinks.
  • Kombucha, kefir, and functional waters are becoming popular alternatives to sugary drinks.
  • Awareness of probiotics' mental and physical health benefits is fueling industry growth.

Challenges in Production and Regulatory Barriers Limiting Industry Growth

Despite strong demand, the industry faces significant challenges, including difficulties in production and regulatory barriers. Maintaining the viability and effectiveness of probiotic strains in beverages is complex and costly, which can drive up production expenses.

Additionally, the regulatory environment for functional foods and beverages varies by region, and obtaining product approvals can be time-consuming and expensive. These factors create obstacles, particularly for new entrants trying to innovate and compete in this rapidly evolving industry.
  • Maintaining the viability of probiotic strains in beverages increases production complexity and costs.
  • Regional regulatory variations and approval processes slow product development and industry entry.
  • New entrants face challenges in innovation and competition due to regulatory and production barriers.

Analyzing Top Countries Manufacturing, Distributing, and Supplying Probiotic Beverages

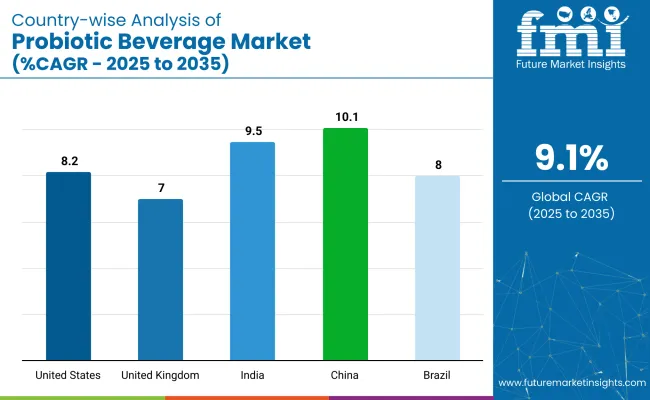
Country Wise Analysis Of Probiotic Beverage Market Cagr 2025 To 2035

Countries CAGR (2025 to 2035)
United States 8.2%
United Kingdom 7%
China 10.1%
India 9.5%
Brazil 8%

The industry demand is projected to rise at a 9.1% CAGR from 2025 to 2035. Of the five profiled countries out of 40 covered, China leads at 10.1%, followed by India at 9.5%, and the United States at 8.2%, while Brazil posts 8% and the United Kingdom records 7%.

These rates translate to a growth premium of +11% for China, +4% for India, and -10% for the United Kingdom versus the baseline, while the United States and Brazil show more moderate growth. Divergence reflects local catalysts: growing demand for health-conscious beverages and increasing awareness of gut health in China and India, as well as a more established probiotic beverage market in the United States and Brazil, while the United Kingdom lags slightly due to industry saturation.

Growth Analysis of Probiotic Beverage Market in the United States

The industry in the United States is set to record a CAGR of 8.2% through 2035. Expansion has been propelled by consumer focus on gut health and immunity, fueling adoption of kombucha, kefir, and concentrated probiotic shots across supermarkets, convenience stores, and direct-to-consumer channels.

Leading brands such as KeVita (PepsiCo) and Health-Ade Kombucha have broadened lineups with tropical and low-sugar variants, while functional claims tied to digestive balance resonate with wellness-minded shoppers. E-commerce bundles and subscription services have increased household penetration, and retail planograms now dedicate prominent end-caps to refrigerated probiotic drinks.

  • Cross-merchandising with immunity supplements has boosted basket sizes in club stores.
  • Limited-edition seasonal flavors drive repeat purchases among millennial and Gen Z consumers.
  • Chain cafés deploy ready-to-drink probiotic shots as add-ons to breakfast menus.

Future Outlook for Probiotic Beverage Market in the United Kingdom

Sales of probiotic drinks in the United Kingdom are projected to grow at a CAGR of 7% through 2035. Rising interest in functional drinks that support digestive wellness is evident in the growing shelf space for kombucha, kefir, and probiotic water.

Brands such as Poppi and Biotiful Dairy emphasize clean labels, reduced sugar, and live-culture counts that fit HFSS-compliant positioning. Online grocery platforms and click-and-collect services have widened distribution beyond metropolitan hubs. Retail promotions centered on gut-health education align with NHS nutrition messaging, encouraging trial across the 31- to 50-year age bracket.

  • Supermarket loyalty apps offer bonus points for probiotic drink multipacks.
  • On-the-go kefir pouches target busy commuters seeking protein and probiotics.
  • Craft breweries co-pack hard kombucha lines for evening consumption occasions.

Demand Forecast for Probiotic Beverage Market in China

Demand for probiotic drinks in China is estimated to grow at a CAGR of 10.1% through 2035. Heightened awareness of digestive wellness and immunity has driven uptake of kombucha, yogurt-based drinks, and probiotic waters across hypermarkets and specialty health stores. Urban consumers favor convenience packs with on-label culture counts, while rural penetration rises via e-commerce flash sales.

Nestlé and GT’s Living Foods are ramping localized production to meet volume spikes, and domestic startups launch tea-infused probiotic tonics tailored to regional taste profiles. Cold-chain expansion ensures consistent quality during long-haul distribution.

  • Livestream commerce events feature probiotic drinks bundled with fitness equipment.
  • Community group-buy apps deliver multipacks to suburban neighborhoods overnight.
  • Fortified kombucha SKUs containing traditional Chinese botanicals cater to functional-drink enthusiasts.

Analysis of Probiotic Beverage Market in India

Growing at a CAGR of 9.5%, the industry India is being propelled by expanding urban wellness culture and rising disposable income. Kombucha, kefir, and yogurt drinks fortified with live cultures are gaining shelf presence in modern trade and specialty stores.

Danone and Yakult have introduced region-specific flavors, while local craft brewers offer small-batch kombucha with indigenous fruits such as jamun and kokum. Health-influencer campaigns on social media educate consumers about digestive benefits, bolstering trial rates. Government nutrition drives that highlight gut health further normalize daily probiotic intake across middle-class households.

  • Subscription platforms deliver weekly kombucha growlers to metropolitan apartments.
  • Probiotic lassi vending machines debut in tech-park cafeterias.
  • Ayurvedic wellness retreats incorporate kefir shots in detox meal plans.

Probiotic Beverage Market Growth Outlook in Brazil

The industry in Brazil is forecasted to grow at a CAGR of 8% through 2035. Urban consumers are shifting away from sugar-laden soft drinks toward functional beverages that support digestive and immune health. Kombucha and kefir brands spotlight antioxidant-rich Amazonian fruits such as açaí and cupuaçu, aligning with regional taste preferences.

Nestlé and Yakult have expanded chilled-chain distribution to secondary cities, while local startups utilize direct-to-consumer models for niche flavors. Retailers allocate refrigerator space to probiotic drinks positioned as better-for-you alternatives, and fitness centers stock grab-and-go probiotic shots post-workout.

  • Health-food bars pair probiotic sodas with plant-based snack bundles.
  • QR codes on labels link to culture-count verification and fermentation dates.
  • Grocery loyalty programs promote bulk kefir purchases with cashback incentives.

Leading Probiotic Beverage Market Suppliers

Leading Company - GT's Living Foods Industry Share - 12%
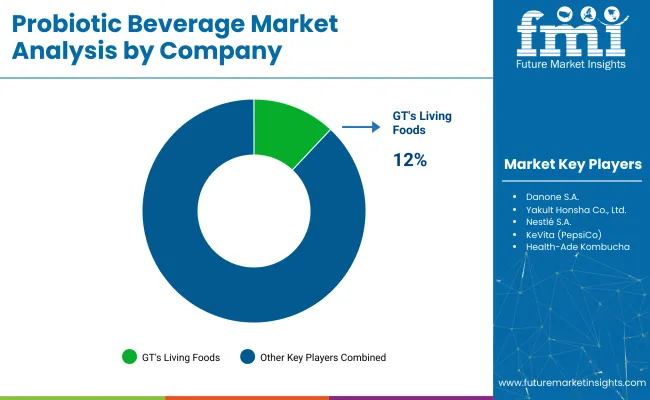
Probiotic Beverage Market Analysis By Company

The global industry is characterized by dominant players, key players, and emerging players. Dominant players such as GT's Living Foods, Danone S.A., and Yakult Honsha Co., Ltd. lead the industry with extensive product portfolios, strong R&D capabilities, and robust distribution networks across health-conscious consumers.

Key players including Nestlé S.A., KeVita (PepsiCo), and Health-Ade Kombucha offer specialized probiotic drinks catering to specific applications and regional industries. Emerging players, such as Lifeway Foods, Inc., Culture Pop, and Poppi, focus on innovative flavors and formulations, expanding their presence in the global industry.

Recent Industry News

  • In March 2025, PepsiCo announced plans to acquire Poppi, a low-calorie, probiotic-infused soda brand, for nearly USD 2 billion. The acquisition is part of PepsiCo’s strategy to expand its portfolio with health-conscious beverages as consumer demand for functional drinks continues to rise.
  • In March 2025, GT’s Living Foods appointed Jon Clancy as its first-ever President. The company also rebranded its SYNERGY Raw Kombucha with a new logo, "The Real Kombucha," ahead of its 30th anniversary, marking a strategic move to strengthen its presence in the kombucha industry.

Report Scope of the Market

Report Attributes Details
Industry Size (2025) USD 31.7 billion
Projected Industry Size (2035) USD 75.8 billion
CAGR (2025 to 2035) 9.1%
Base Year for Estimation 2024
Historical Period 2020 to 2024
Projections Period 2025 to 2035
Quantitative Units USD billion for value and million units for volume
Product Type Segmentation Kombucha (Flavor Segmentation and Alcohol content variations), Kefir (Dairy-based kefir, Plant-based kefir, Flavored vs. plain variants), Probiotic shots and functional waters (Concentrated probiotic shots, Probiotic-enhanced waters, Electrolyte-probiotic combinations), Drinking yogurt and dairy-based beverages (Traditional drinking yogurt, Greek yogurt drinks, Low-fat and non-fat variants), Plant-based probiotic beverages (Fruit and vegetable-based, Nut and seed-based, Grain-based fermented drinks), Probiotic sodas and carbonated drinks (Prebiotic sodas, Low-sugar variants, Natural flavor profiles)
Distribution Channel Segmentation Retail Channels (Supermarkets and Hypermarkets, Health food stores, Convenience stores, Specialty beverage retailers), Online Retail (E-commerce platforms, Direct-to-consumer sales, Subscription-based models), Foodservice (Restaurants and cafes, Health and wellness centers, Corporate cafeterias), Pharmacy and Healthcare Channels (Traditional pharmacies, Health clinics, Nutritionist recommendations)
Consumer Demographics Segmentation Children (0-12), Teenagers & Young Adults (13-30), Adults (31-50), Older Adults (51+)
Regions Covered North America, Latin America, Western Europe, Eastern Europe, East Asia, South Asia, Middle East & Africa (MEA)
Countries Covered United States, Canada, Mexico, Brazil, Argentina, Germany, France, United Kingdom, Italy, Spain, Netherlands, China, India, Japan, South Korea, Australia, New Zealand, GCC Countries, South Africa
Key Players Influencing the Industry GT's Living Foods, Danone S.A., Yakult Honsha Co., Ltd., Nestlé S.A., KeVita (PepsiCo), Health-Ade Kombucha, Lifeway Foods, Inc., Culture Pop, Poppi, Biotiful Dairy, Karma Probiotic Water, Chr. Hansen Holding A/S, DuPont Nutrition & Biosciences, BioGaia AB, Lallemand Inc.
Additional Attributes Dollar sales by product type, distribution channel, and consumer demographics, increasing consumer demand for health-conscious drinks, growing preference for plant-based and dairy-free probiotic drink s, rising awareness about gut health, expanding distribution channels through e-commerce and retail, regional adoption trends and regulatory impacts on probiotic drink formulations.

Key Players in the Probiotic Beverage Market

  • GT's Living Foods
  • Danone S.A.
  • Yakult Honsha Co., Ltd.
  • Nestlé S.A.
  • KeVita (PepsiCo)
  • Health-Ade Kombucha
  • Lifeway Foods, Inc.
  • Culture Pop
  • Poppi
  • Biotiful Dairy
  • Karma Probiotic Water
  • Chr. Hansen Holding A/S
  • DuPont Nutrition & Biosciences
  • BioGaia AB
  • Lallemand Inc.

Probiotic Beverage Market Analyzed by Key Investment Segments

By Product Type:

The industry is segmented into kombucha(flavor segmentation and alcohol content variations), kefir(dairy-based kefir, plant-based kefir, flavored vs. plain variants), probiotic shots and functional waters (concentrated probiotic shots, probiotic-enhanced waters, electrolyte-probiotic combinations), drinking yogurt and dairy-based beverages (traditional drinking yogurt, greek yogurt drinks, low-fat and non-fat variants), plant-based probiotic beverages (fruit and vegetable-based, nut and seed-based, grain-based fermented drinks), and probiotic sodas and carbonated drinks (prebiotic sodas, low-sugar variants, natural flavor profiles).

By Distribution Channel:

The industry is segmented into retail channels (supermarkets and hypermarkets, health food stores, convenience stores, and specialty beverage retailers), online retail (e-commerce platforms, direct-to-consumer sales, subscription-based models), foodservice(restaurants and cafes, health and wellness centers, corporate cafeterias), and pharmacy and healthcare channels(traditional pharmacies, health clinics, nutritionist recommendations).

By Consumer Demographics:

The industry is segmented into children(0-12), teenagers & young adults (13-30), adults (31-50), and older adults (51+).

By Region:

The industry is segmented into North America, Latin America, Western Europe, Eastern Europe, East Asia, South Asia, the Middle East and Africa (MEA).

Table of Content

  1. Executive Summary
    • Global Market Outlook
    • Demand-side Trends
    • Supply-side Trends
    • Technology Roadmap Analysis
    • Analysis and Recommendations
  2. Market Overview
    • Market Coverage / Taxonomy
    • Market Definition / Scope / Limitations
  3. Market Background
    • Market Dynamics
      • Drivers
      • Restraints
      • Opportunity
      • Trends
    • Scenario Forecast
      • Demand in Optimistic Scenario
      • Demand in Likely Scenario
      • Demand in Conservative Scenario
    • Opportunity Map Analysis
    • Product Life Cycle Analysis
    • Supply Chain Analysis
      • Supply Side Participants and their Roles
        • Producers
        • Mid-Level Participants (Traders/ Agents/ Brokers)
        • Wholesalers and Distributors
      • Value Added and Value Created at Node in the Supply Chain
      • List of Raw Material Suppliers
      • List of Existing and Potential Buyer’s
    • Investment Feasibility Matrix
    • Value Chain Analysis
      • Profit Margin Analysis
      • Wholesalers and Distributors
      • Retailers
    • PESTLE and Porter’s Analysis
    • Regulatory Landscape
      • By Key Regions
      • By Key Countries
    • Regional Parent Market Outlook
    • Production and Consumption Statistics
    • Import and Export Statistics
  4. Global Market Analysis 2020 to 2024 and Forecast, 2025 to 2035
    • Historical Market Size Value (USD Billion) & Volume (Million Units) Analysis, 2020 to 2024
    • Current and Future Market Size Value (USD Billion) & Volume (Million Units) Projections, 2025 to 2035
      • Y-o-Y Growth Trend Analysis
      • Absolute $ Opportunity Analysis
  5. Global Market Pricing Analysis 2020 to 2024 and Forecast 2025 to 2035
  6. Global Market Analysis 2020 to 2024 and Forecast 2025 to 2035, By Product Type
    • Introduction / Key Findings
    • Historical Market Size Value (USD Billion) & Volume (Million Units) Analysis By Product Type, 2020 to 2024
    • Current and Future Market Size Value (USD Billion) & Volume (Million Units) Analysis and Forecast By Product Type, 2025 to 2035
      • Kombucha
        • Flavor Segmentation
        • Alcohol Content Variations
      • Kefir
        • Dairy-based Kefir
        • Plant-based Kefir
        • Flavored vs. Plain Variants
      • Probiotic Shots and Functional Waters
        • Concentrated Probiotic Shots
        • Probiotic-enhanced Waters
        • Electrolyte-probiotic Combinations
      • Drinking Yogurt and Dairy-Based Beverages
        • Traditional Drinking Yogurt
        • Greek Yogurt Drinks
        • Low-fat and Non-fat Variants
      • Plant-Based Probiotic Beverages
        • Fruit and Vegetable-based
        • Nut and Seed-based
        • Grain-based Fermented Drinks
      • Probiotic Sodas and Carbonated Drinks
        • Prebiotic Sodas
        • Low-sugar Variants
        • Natural Flavor Profiles
    • Y-o-Y Growth Trend Analysis By Product Type, 2020 to 2024
    • Absolute $ Opportunity Analysis By Product Type, 2025 to 2035
  7. Global Market Analysis 2020 to 2024 and Forecast 2025 to 2035, By Distribution Channel
    • Introduction / Key Findings
    • Historical Market Size Value (USD Billion) & Volume (Million Units) Analysis By Distribution Channel, 2020 to 2024
    • Current and Future Market Size Value (USD Billion) & Volume (Million Units) Analysis and Forecast By Distribution Channel, 2025 to 2035
      • Retail Channels
        • Supermarkets and Hypermarkets
        • Health Food Stores
        • Convenience Stores
        • Specialty Beverage Retailers
      • Online Retail
        • E-commerce Platforms
        • Direct-to-consumer Sales
        • Subscription-based Models
      • Foodservice
        • Restaurants and Cafes
        • Health and Wellness Centers
        • Corporate Cafeterias
      • Pharmacy and Healthcare Channels
        • Traditional Pharmacies
        • Health Clinics
        • Nutritionist Recommendations
    • Y-o-Y Growth Trend Analysis By Distribution Channel, 2020 to 2024
    • Absolute $ Opportunity Analysis By Distribution Channel, 2025 to 2035
  8. Global Market Analysis 2020 to 2024 and Forecast 2025 to 2035, By Consumer Demographics
    • Introduction / Key Findings
    • Historical Market Size Value (USD Billion) & Volume (Million Units) Analysis By Consumer Demographics, 2020 to 2024
    • Current and Future Market Size Value (USD Billion) & Volume (Million Units) Analysis and Forecast By Consumer Demographics, 2025 to 2035
      • Children (0-12)
      • Teenagers & Young Adults (13-30)
      • Adults (31-50)
      • Older Adults (51+)
    • Y-o-Y Growth Trend Analysis By Consumer Demographics, 2020 to 2024
    • Absolute $ Opportunity Analysis By Consumer Demographics, 2025 to 2035
  9. Global Market Analysis 2020 to 2024 and Forecast 2025 to 2035, By Region
    • Introduction
    • Historical Market Size Value (USD Billion) & Volume (Million Units) Analysis By Region, 2020 to 2024
    • Current Market Size Value (USD Billion) & Volume (Million Units) Analysis and Forecast By Region, 2025 to 2035
      • North America
      • Latin America
      • Western Europe
      • Eastern Europe
      • East Asia
      • South Asia & Pacific
      • Middle East and Africa
    • Market Attractiveness Analysis By Region
  10. North America Market Analysis 2020 to 2024 and Forecast 2025 to 2035, By Country
    • Historical Market Size Value (USD Billion) & Volume (Million Units) Trend Analysis By Market Taxonomy, 2020 to 2024
    • Market Size Value (USD Billion) & Volume (Million Units) Forecast By Market Taxonomy, 2025 to 2035
      • By Country
        • USA
        • Canada
        • Mexico
      • By Product Type
      • By Distribution Channel
      • By Consumer Demographics
    • Market Attractiveness Analysis
      • By Country
      • By Product Type
      • By Distribution Channel
      • By Consumer Demographics
    • Key Takeaways
  11. Latin America Market Analysis 2020 to 2024 and Forecast 2025 to 2035, By Country
    • Historical Market Size Value (USD Billion) & Volume (Million Units) Trend Analysis By Market Taxonomy, 2020 to 2024
    • Market Size Value (USD Billion) & Volume (Million Units) Forecast By Market Taxonomy, 2025 to 2035
      • By Country
        • Brazil
        • Argentina
        • Rest of LATAM
      • By Product Type
      • By Distribution Channel
      • By Consumer Demographics
    • Market Attractiveness Analysis
      • By Country
      • By Product Type
      • By Distribution Channel
      • By Consumer Demographics
    • Key Takeaways
  12. Western Europe Market Analysis 2020 to 2024 and Forecast 2025 to 2035, By Country
    • Historical Market Size Value (USD Billion) & Volume (Million Units) Trend Analysis By Market Taxonomy, 2020 to 2024
    • Market Size Value (USD Billion) & Volume (Million Units) Forecast By Market Taxonomy, 2025 to 2035
      • By Country
        • Germany
        • Italy
        • France
        • UK
        • Spain
        • BENELUX
        • Nordic
        • Rest of W. Europe
      • By Product Type
      • By Distribution Channel
      • By Consumer Demographics
    • Market Attractiveness Analysis
      • By Country
      • By Product Type
      • By Distribution Channel
      • By Consumer Demographics
    • Key Takeaways
  13. Eastern Europe Market Analysis 2020 to 2024 and Forecast 2025 to 2035, By Country
    • Historical Market Size Value (USD Billion) & Volume (Million Units) Trend Analysis By Market Taxonomy, 2020 to 2024
    • Market Size Value (USD Billion) & Volume (Million Units) Forecast By Market Taxonomy, 2025 to 2035
      • By Country
        • Russia
        • Hungary
        • Poland
        • Balkan & Baltics
        • Rest of E. Europe
      • By Product Type
      • By Distribution Channel
      • By Consumer Demographics
    • Market Attractiveness Analysis
      • By Country
      • By Product Type
      • By Distribution Channel
      • By Consumer Demographics
    • Key Takeaways
  14. East Asia Market Analysis 2020 to 2024 and Forecast 2025 to 2035, By Country
    • Historical Market Size Value (USD Billion) & Volume (Million Units) Trend Analysis By Market Taxonomy, 2020 to 2024
    • Market Size Value (USD Billion) & Volume (Million Units) Forecast By Market Taxonomy, 2025 to 2035
      • By Country
        • China
        • Japan
        • South Korea
      • By Product Type
      • By Distribution Channel
      • By Consumer Demographics
    • Market Attractiveness Analysis
      • By Country
      • By Product Type
      • By Distribution Channel
      • By Consumer Demographics
    • Key Takeaways
  15. South Asia & Pacific Market Analysis 2020 to 2024 and Forecast 2025 to 2035, By Country
    • Historical Market Size Value (USD Billion) & Volume (Million Units) Trend Analysis By Market Taxonomy, 2020 to 2024
    • Market Size Value (USD Billion) & Volume (Million Units) Forecast By Market Taxonomy, 2025 to 2035
      • By Country
        • India
        • Australia & New Zealand
        • ASEAN
        • Rest of SAP
      • By Product Type
      • By Distribution Channel
      • By Consumer Demographics
    • Market Attractiveness Analysis
      • By Country
      • By Product Type
      • By Distribution Channel
      • By Consumer Demographics
    • Key Takeaways
  16. Middle East and Africa Market Analysis 2020 to 2024 and Forecast 2025 to 2035, By Country
    • Historical Market Size Value (USD Billion) & Volume (Million Units) Trend Analysis By Market Taxonomy, 2020 to 2024
    • Market Size Value (USD Billion) & Volume (Million Units) Forecast By Market Taxonomy, 2025 to 2035
      • By Country
        • GCC Countries
        • Northern Africa
        • South Africa
        • Turkiye
        • Rest of MEA
      • By Product Type
      • By Distribution Channel
      • By Consumer Demographics
    • Market Attractiveness Analysis
      • By Country
      • By Product Type
      • By Distribution Channel
      • By Consumer Demographics
    • Key Takeaways
  17. Key Countries Market Analysis
    • USA
      • Pricing Analysis
      • Market Share Analysis, 2024
        • By Product Type
        • By Distribution Channel
        • By Consumer Demographics
    • Canada
      • Pricing Analysis
      • Market Share Analysis, 2024
        • By Product Type
        • By Distribution Channel
        • By Consumer Demographics
    • Brazil
      • Pricing Analysis
      • Market Share Analysis, 2024
        • By Product Type
        • By Distribution Channel
        • By Consumer Demographics
    • Mexico
      • Pricing Analysis
      • Market Share Analysis, 2024
        • By Product Type
        • By Distribution Channel
        • By Consumer Demographics
    • Argentina
      • Pricing Analysis
      • Market Share Analysis, 2024
        • By Product Type
        • By Distribution Channel
        • By Consumer Demographics
  18. Market Structure Analysis
    • Competition Dashboard
    • Competition Benchmarking
    • Market Share Analysis of Top Players
      • By Regional
      • By Product Type
      • By Distribution Channel
      • By Consumer Demographics
  19. Competition Analysis
    • Competition Deep Dive
      • GT's Living Foods
        • Overview
        • Product Portfolio
        • Profitability by Market Segments (Product/Age /Sales Channel/Region)
        • Sales Footprint
        • Strategy Overview
          • Marketing Strategy
          • Product Strategy
          • Channel Strategy
      • Danone S.A.
        • Overview
        • Product Portfolio
        • Profitability by Market Segments (Product/Age /Sales Channel/Region)
        • Sales Footprint
        • Strategy Overview
          • Marketing Strategy
          • Product Strategy
          • Channel Strategy
      • Yakult Honsha Co., Ltd.
        • Overview
        • Product Portfolio
        • Profitability by Market Segments (Product/Age /Sales Channel/Region)
        • Sales Footprint
        • Strategy Overview
          • Marketing Strategy
          • Product Strategy
          • Channel Strategy
      • Nestlé S.A.
        • Overview
        • Product Portfolio
        • Profitability by Market Segments (Product/Age /Sales Channel/Region)
        • Sales Footprint
        • Strategy Overview
          • Marketing Strategy
          • Product Strategy
          • Channel Strategy
      • KeVita (PepsiCo)
        • Overview
        • Product Portfolio
        • Profitability by Market Segments (Product/Age /Sales Channel/Region)
        • Sales Footprint
        • Strategy Overview
          • Marketing Strategy
          • Product Strategy
          • Channel Strategy
      • Health-Ade Kombucha
        • Overview
        • Product Portfolio
        • Profitability by Market Segments (Product/Age /Sales Channel/Region)
        • Sales Footprint
        • Strategy Overview
          • Marketing Strategy
          • Product Strategy
          • Channel Strategy
      • Lifeway Foods, Inc.
        • Overview
        • Product Portfolio
        • Profitability by Market Segments (Product/Age /Sales Channel/Region)
        • Sales Footprint
        • Strategy Overview
          • Marketing Strategy
          • Product Strategy
          • Channel Strategy
      • Culture Pop
        • Overview
        • Product Portfolio
        • Profitability by Market Segments (Product/Age /Sales Channel/Region)
        • Sales Footprint
        • Strategy Overview
          • Marketing Strategy
          • Product Strategy
          • Channel Strategy
      • Poppi
        • Overview
        • Product Portfolio
        • Profitability by Market Segments (Product/Age /Sales Channel/Region)
        • Sales Footprint
        • Strategy Overview
          • Marketing Strategy
          • Product Strategy
          • Channel Strategy
      • Biotiful Dairy
        • Overview
        • Product Portfolio
        • Profitability by Market Segments (Product/Age /Sales Channel/Region)
        • Sales Footprint
        • Strategy Overview
          • Marketing Strategy
          • Product Strategy
          • Channel Strategy
      • Karma Probiotic Water
        • Overview
        • Product Portfolio
        • Profitability by Market Segments (Product/Age /Sales Channel/Region)
        • Sales Footprint
        • Strategy Overview
          • Marketing Strategy
          • Product Strategy
          • Channel Strategy
      • Chr. Hansen Holding A/S
        • Overview
        • Product Portfolio
        • Profitability by Market Segments (Product/Age /Sales Channel/Region)
        • Sales Footprint
        • Strategy Overview
          • Marketing Strategy
          • Product Strategy
          • Channel Strategy
      • DuPont Nutrition & Biosciences
        • Overview
        • Product Portfolio
        • Profitability by Market Segments (Product/Age /Sales Channel/Region)
        • Sales Footprint
        • Strategy Overview
          • Marketing Strategy
          • Product Strategy
          • Channel Strategy
      • BioGaia AB
        • Overview
        • Product Portfolio
        • Profitability by Market Segments (Product/Age /Sales Channel/Region)
        • Sales Footprint
        • Strategy Overview
          • Marketing Strategy
          • Product Strategy
          • Channel Strategy
      • Lallemand Inc.
        • Overview
        • Product Portfolio
        • Profitability by Market Segments (Product/Age /Sales Channel/Region)
        • Sales Footprint
        • Strategy Overview
          • Marketing Strategy
          • Product Strategy
          • Channel Strategy
  20. Assumptions & Acronyms Used
  21. Research Methodology

List of Tables

  • Table 1: Global Market Value (USD Billion) Forecast by Region, 2020 to 2035
  • Table 2: Global Market Volume (Million Units) Forecast by Region, 2020 to 2035
  • Table 3: Global Market Value (USD Billion) Forecast by Product Type, 2020 to 2035
  • Table 4: Global Market Volume (Million Units) Forecast by Product Type, 2020 to 2035
  • Table 5: Global Market Value (USD Billion) Forecast by Distribution Channel, 2020 to 2035
  • Table 6: Global Market Volume (Million Units) Forecast by Distribution Channel, 2020 to 2035
  • Table 7: Global Market Value (USD Billion) Forecast by Consumer Demographics, 2020 to 2035
  • Table 8: Global Market Volume (Million Units) Forecast by Consumer Demographics, 2020 to 2035
  • Table 9: North America Market Value (USD Billion) Forecast by Country, 2020 to 2035
  • Table 10: North America Market Volume (Million Units) Forecast by Country, 2020 to 2035
  • Table 11: North America Market Value (USD Billion) Forecast by Product Type, 2020 to 2035
  • Table 12: North America Market Volume (Million Units) Forecast by Product Type, 2020 to 2035
  • Table 13: North America Market Value (USD Billion) Forecast by Distribution Channel, 2020 to 2035
  • Table 14: North America Market Volume (Million Units) Forecast by Distribution Channel, 2020 to 2035
  • Table 15: North America Market Value (USD Billion) Forecast by Consumer Demographics, 2020 to 2035
  • Table 16: North America Market Volume (Million Units) Forecast by Consumer Demographics, 2020 to 2035
  • Table 17: Latin America Market Value (USD Billion) Forecast by Country, 2020 to 2035
  • Table 18: Latin America Market Volume (Million Units) Forecast by Country, 2020 to 2035
  • Table 19: Latin America Market Value (USD Billion) Forecast by Product Type, 2020 to 2035
  • Table 20: Latin America Market Volume (Million Units) Forecast by Product Type, 2020 to 2035
  • Table 21: Latin America Market Value (USD Billion) Forecast by Distribution Channel, 2020 to 2035
  • Table 22: Latin America Market Volume (Million Units) Forecast by Distribution Channel, 2020 to 2035
  • Table 23: Latin America Market Value (USD Billion) Forecast by Consumer Demographics, 2020 to 2035
  • Table 24: Latin America Market Volume (Million Units) Forecast by Consumer Demographics, 2020 to 2035
  • Table 25: Western Europe Market Value (USD Billion) Forecast by Country, 2020 to 2035
  • Table 26: Western Europe Market Volume (Million Units) Forecast by Country, 2020 to 2035
  • Table 27: Western Europe Market Value (USD Billion) Forecast by Product Type, 2020 to 2035
  • Table 28: Western Europe Market Volume (Million Units) Forecast by Product Type, 2020 to 2035
  • Table 29: Western Europe Market Value (USD Billion) Forecast by Distribution Channel, 2020 to 2035
  • Table 30: Western Europe Market Volume (Million Units) Forecast by Distribution Channel, 2020 to 2035
  • Table 31: Western Europe Market Value (USD Billion) Forecast by Consumer Demographics, 2020 to 2035
  • Table 32: Western Europe Market Volume (Million Units) Forecast by Consumer Demographics, 2020 to 2035
  • Table 33: Eastern Europe Market Value (USD Billion) Forecast by Country, 2020 to 2035
  • Table 34: Eastern Europe Market Volume (Million Units) Forecast by Country, 2020 to 2035
  • Table 35: Eastern Europe Market Value (USD Billion) Forecast by Product Type, 2020 to 2035
  • Table 36: Eastern Europe Market Volume (Million Units) Forecast by Product Type, 2020 to 2035
  • Table 37: Eastern Europe Market Value (USD Billion) Forecast by Distribution Channel, 2020 to 2035
  • Table 38: Eastern Europe Market Volume (Million Units) Forecast by Distribution Channel, 2020 to 2035
  • Table 39: Eastern Europe Market Value (USD Billion) Forecast by Consumer Demographics, 2020 to 2035
  • Table 40: Eastern Europe Market Volume (Million Units) Forecast by Consumer Demographics, 2020 to 2035
  • Table 41: East Asia Market Value (USD Billion) Forecast by Country, 2020 to 2035
  • Table 42: East Asia Market Volume (Million Units) Forecast by Country, 2020 to 2035
  • Table 43: East Asia Market Value (USD Billion) Forecast by Product Type, 2020 to 2035
  • Table 44: East Asia Market Volume (Million Units) Forecast by Product Type, 2020 to 2035
  • Table 45: East Asia Market Value (USD Billion) Forecast by Distribution Channel, 2020 to 2035
  • Table 46: East Asia Market Volume (Million Units) Forecast by Distribution Channel, 2020 to 2035
  • Table 47: East Asia Market Value (USD Billion) Forecast by Consumer Demographics, 2020 to 2035
  • Table 48: East Asia Market Volume (Million Units) Forecast by Consumer Demographics, 2020 to 2035
  • Table 49: South Asia & Pacific Market Value (USD Billion) Forecast by Country, 2020 to 2035
  • Table 50: South Asia & Pacific Market Volume (Million Units) Forecast by Country, 2020 to 2035
  • Table 51: South Asia & Pacific Market Value (USD Billion) Forecast by Product Type, 2020 to 2035
  • Table 52: South Asia & Pacific Market Volume (Million Units) Forecast by Product Type, 2020 to 2035
  • Table 53: South Asia & Pacific Market Value (USD Billion) Forecast by Distribution Channel, 2020 to 2035
  • Table 54: South Asia & Pacific Market Volume (Million Units) Forecast by Distribution Channel, 2020 to 2035
  • Table 55: South Asia & Pacific Market Value (USD Billion) Forecast by Consumer Demographics, 2020 to 2035
  • Table 56: South Asia & Pacific Market Volume (Million Units) Forecast by Consumer Demographics, 2020 to 2035
  • Table 57: Middle East and Africa Market Value (USD Billion) Forecast by Country, 2020 to 2035
  • Table 58: Middle East and Africa Market Volume (Million Units) Forecast by Country, 2020 to 2035
  • Table 59: Middle East and Africa Market Value (USD Billion) Forecast by Product Type, 2020 to 2035
  • Table 60: Middle East and Africa Market Volume (Million Units) Forecast by Product Type, 2020 to 2035
  • Table 61: Middle East and Africa Market Value (USD Billion) Forecast by Distribution Channel, 2020 to 2035
  • Table 62: Middle East and Africa Market Volume (Million Units) Forecast by Distribution Channel, 2020 to 2035
  • Table 63: Middle East and Africa Market Value (USD Billion) Forecast by Consumer Demographics, 2020 to 2035
  • Table 64: Middle East and Africa Market Volume (Million Units) Forecast by Consumer Demographics, 2020 to 2035

List of Figures

  • Figure 1: Global Market Volume (Million Units) Forecast 2020 to 2035
  • Figure 2: Global Market Pricing Analysis
  • Figure 3: Global Market Value (USD Billion) Forecast 2020 to 2035
  • Figure 4: Global Market Value Share and BPS Analysis by Product Type, 2025 and 2035
  • Figure 5: Global Market Y-o-Y Growth Comparison by Product Type, 2025 to 2035
  • Figure 6: Global Market Attractiveness Analysis by Product Type
  • Figure 7: Global Market Value Share and BPS Analysis by Distribution Channel, 2025 and 2035
  • Figure 8: Global Market Y-o-Y Growth Comparison by Distribution Channel, 2025 to 2035
  • Figure 9: Global Market Attractiveness Analysis by Distribution Channel
  • Figure 10: Global Market Value Share and BPS Analysis by Consumer Demographics, 2025 and 2035
  • Figure 11: Global Market Y-o-Y Growth Comparison by Consumer Demographics, 2025 to 2035
  • Figure 12: Global Market Attractiveness Analysis by Consumer Demographics
  • Figure 13: Global Market Value (USD Billion) Share and BPS Analysis by Region, 2025 and 2035
  • Figure 14: Global Market Y-o-Y Growth Comparison by Region, 2025 to 2035
  • Figure 15: Global Market Attractiveness Analysis by Region
  • Figure 16: North America Market Incremental $ Opportunity, 2025 to 2035
  • Figure 17: Latin America Market Incremental $ Opportunity, 2025 to 2035
  • Figure 18: Western Europe Market Incremental $ Opportunity, 2025 to 2035
  • Figure 19: Eastern Europe Market Incremental $ Opportunity, 2025 to 2035
  • Figure 20: East Asia Market Incremental $ Opportunity, 2025 to 2035
  • Figure 21: South Asia & Pacific Market Incremental $ Opportunity, 2025 to 2035
  • Figure 22: Middle East and Africa Market Incremental $ Opportunity, 2025 to 2035
  • Figure 23: North America Market Value Share and BPS Analysis by Country, 2025 and 2035
  • Figure 24: North America Market Value Share and BPS Analysis by Product Type, 2025 and 2035
  • Figure 25: North America Market Y-o-Y Growth Comparison by Product Type, 2025 to 2035
  • Figure 26: North America Market Attractiveness Analysis by Product Type
  • Figure 27: North America Market Value Share and BPS Analysis by Distribution Channel, 2025 and 2035
  • Figure 28: North America Market Y-o-Y Growth Comparison by Distribution Channel, 2025 to 2035
  • Figure 29: North America Market Attractiveness Analysis by Distribution Channel
  • Figure 30: North America Market Value Share and BPS Analysis by Consumer Demographics, 2025 and 2035
  • Figure 31: North America Market Y-o-Y Growth Comparison by Consumer Demographics, 2025 to 2035
  • Figure 32: North America Market Attractiveness Analysis by Consumer Demographics
  • Figure 33: Latin America Market Value Share and BPS Analysis by Country, 2025 and 2035
  • Figure 34: Latin America Market Value Share and BPS Analysis by Product Type, 2025 and 2035
  • Figure 35: Latin America Market Y-o-Y Growth Comparison by Product Type, 2025 to 2035
  • Figure 36: Latin America Market Attractiveness Analysis by Product Type
  • Figure 37: Latin America Market Value Share and BPS Analysis by Distribution Channel, 2025 and 2035
  • Figure 38: Latin America Market Y-o-Y Growth Comparison by Distribution Channel, 2025 to 2035
  • Figure 39: Latin America Market Attractiveness Analysis by Distribution Channel
  • Figure 40: Latin America Market Value Share and BPS Analysis by Consumer Demographics, 2025 and 2035
  • Figure 41: Latin America Market Y-o-Y Growth Comparison by Consumer Demographics, 2025 to 2035
  • Figure 42: Latin America Market Attractiveness Analysis by Consumer Demographics
  • Figure 43: Western Europe Market Value Share and BPS Analysis by Country, 2025 and 2035
  • Figure 44: Western Europe Market Value Share and BPS Analysis by Product Type, 2025 and 2035
  • Figure 45: Western Europe Market Y-o-Y Growth Comparison by Product Type, 2025 to 2035
  • Figure 46: Western Europe Market Attractiveness Analysis by Product Type
  • Figure 47: Western Europe Market Value Share and BPS Analysis by Distribution Channel, 2025 and 2035
  • Figure 48: Western Europe Market Y-o-Y Growth Comparison by Distribution Channel, 2025 to 2035
  • Figure 49: Western Europe Market Attractiveness Analysis by Distribution Channel
  • Figure 50: Western Europe Market Value Share and BPS Analysis by Consumer Demographics, 2025 and 2035
  • Figure 51: Western Europe Market Y-o-Y Growth Comparison by Consumer Demographics, 2025 to 2035
  • Figure 52: Western Europe Market Attractiveness Analysis by Consumer Demographics
  • Figure 53: Eastern Europe Market Value Share and BPS Analysis by Country, 2025 and 2035
  • Figure 54: Eastern Europe Market Value Share and BPS Analysis by Product Type, 2025 and 2035
  • Figure 55: Eastern Europe Market Y-o-Y Growth Comparison by Product Type, 2025 to 2035
  • Figure 56: Eastern Europe Market Attractiveness Analysis by Product Type
  • Figure 57: Eastern Europe Market Value Share and BPS Analysis by Distribution Channel, 2025 and 2035
  • Figure 58: Eastern Europe Market Y-o-Y Growth Comparison by Distribution Channel, 2025 to 2035
  • Figure 59: Eastern Europe Market Attractiveness Analysis by Distribution Channel
  • Figure 60: Eastern Europe Market Value Share and BPS Analysis by Consumer Demographics, 2025 and 2035
  • Figure 61: Eastern Europe Market Y-o-Y Growth Comparison by Consumer Demographics, 2025 to 2035
  • Figure 62: Eastern Europe Market Attractiveness Analysis by Consumer Demographics
  • Figure 63: East Asia Market Value Share and BPS Analysis by Country, 2025 and 2035
  • Figure 64: East Asia Market Value Share and BPS Analysis by Product Type, 2025 and 2035
  • Figure 65: East Asia Market Y-o-Y Growth Comparison by Product Type, 2025 to 2035
  • Figure 66: East Asia Market Attractiveness Analysis by Product Type
  • Figure 67: East Asia Market Value Share and BPS Analysis by Distribution Channel, 2025 and 2035
  • Figure 68: East Asia Market Y-o-Y Growth Comparison by Distribution Channel, 2025 to 2035
  • Figure 69: East Asia Market Attractiveness Analysis by Distribution Channel
  • Figure 70: East Asia Market Value Share and BPS Analysis by Consumer Demographics, 2025 and 2035
  • Figure 71: East Asia Market Y-o-Y Growth Comparison by Consumer Demographics, 2025 to 2035
  • Figure 72: East Asia Market Attractiveness Analysis by Consumer Demographics
  • Figure 73: South Asia & Pacific Market Value Share and BPS Analysis by Country, 2025 and 2035
  • Figure 74: South Asia & Pacific Market Value Share and BPS Analysis by Product Type, 2025 and 2035
  • Figure 75: South Asia & Pacific Market Y-o-Y Growth Comparison by Product Type, 2025 to 2035
  • Figure 76: South Asia & Pacific Market Attractiveness Analysis by Product Type
  • Figure 77: South Asia & Pacific Market Value Share and BPS Analysis by Distribution Channel, 2025 and 2035
  • Figure 78: South Asia & Pacific Market Y-o-Y Growth Comparison by Distribution Channel, 2025 to 2035
  • Figure 79: South Asia & Pacific Market Attractiveness Analysis by Distribution Channel
  • Figure 80: South Asia & Pacific Market Value Share and BPS Analysis by Consumer Demographics, 2025 and 2035
  • Figure 81: South Asia & Pacific Market Y-o-Y Growth Comparison by Consumer Demographics, 2025 to 2035
  • Figure 82: South Asia & Pacific Market Attractiveness Analysis by Consumer Demographics
  • Figure 83: Middle East and Africa Market Value Share and BPS Analysis by Country, 2025 and 2035
  • Figure 84: Middle East and Africa Market Value Share and BPS Analysis by Product Type, 2025 and 2035
  • Figure 85: Middle East and Africa Market Y-o-Y Growth Comparison by Product Type, 2025 to 2035
  • Figure 86: Middle East and Africa Market Attractiveness Analysis by Product Type
  • Figure 87: Middle East and Africa Market Value Share and BPS Analysis by Distribution Channel, 2025 and 2035
  • Figure 88: Middle East and Africa Market Y-o-Y Growth Comparison by Distribution Channel, 2025 to 2035
  • Figure 89: Middle East and Africa Market Attractiveness Analysis by Distribution Channel
  • Figure 90: Middle East and Africa Market Value Share and BPS Analysis by Consumer Demographics, 2025 and 2035
  • Figure 91: Middle East and Africa Market Y-o-Y Growth Comparison by Consumer Demographics, 2025 to 2035
  • Figure 92: Middle East and Africa Market Attractiveness Analysis by Consumer Demographics
  • Figure 93: Global Market - Tier Structure Analysis
  • Figure 94: Global Market - Company Share Analysis

Frequently Asked Questions

What is the projected size of the probiotic beverage market in 2025?

The industry is projected to reach USD 31.7 billion in 2025.

What is the projected size of the probiotic beverage market by 2035?

The industry is expected to grow to USD 75.8 billion by 2035.

Which product type holds the largest share in the probiotic beverage market?

Kombucha is the leading product type, holding a 28% share in the industry.

Which country has the highest CAGR in the probiotic beverage market?

China has the highest CAGR in the industry at 10.1%.

Who is the leading company in the probiotic beverage market?

GT's Living Foods is the leading company in the industry, with an industry share of 12%.

Explore Similar Insights

Future Market Insights

Probiotic Beverage Market