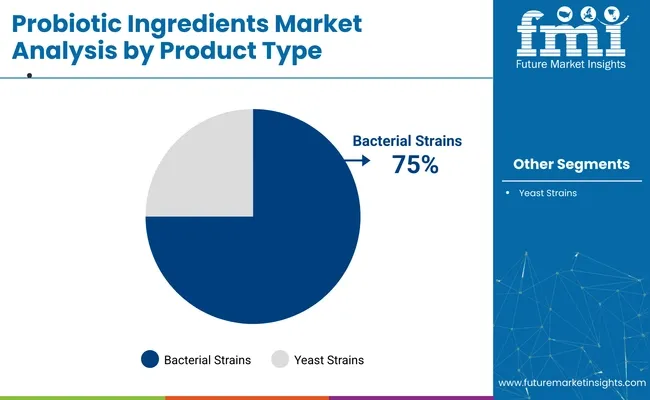
The global probiotic ingredients market is on track for steady growth, with a projected CAGR of 3.3%, the market is expected to reach USD 12 billion by 2035, up from USD 8 billion in 2025. A primary driver of this growth is the increased consumer focus on gut health and wellness, which has led to an upsurge in demand for probiotic ingredients, particularly in the food and beverages sector. Bacterial strains, which account for 75% of the market share in 2025, will continue to dominate the market, as they are essential for producing a wide variety of probiotic products.
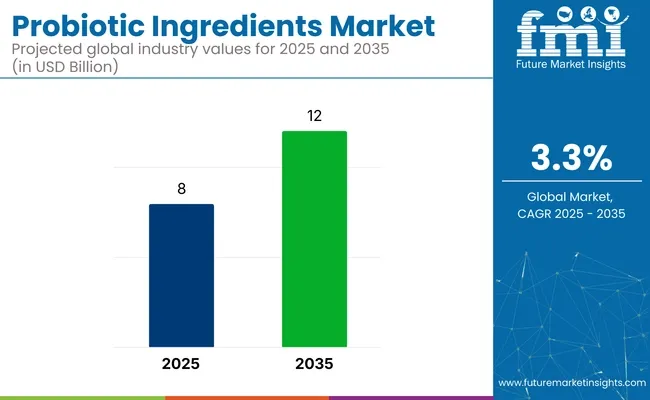
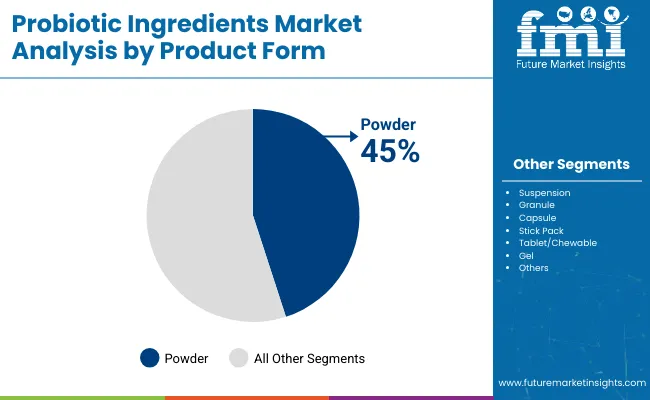
China is set to be the fastest-growing market, with a robust CAGR of 6.3%, driven by rising awareness of health benefits and an expanding consumer base. Powder-form probiotic ingredients, with an estimated 45% market share in 2025, will continue to lead the product form segment, as they offer ease of incorporation into dietary supplements and functional foods.
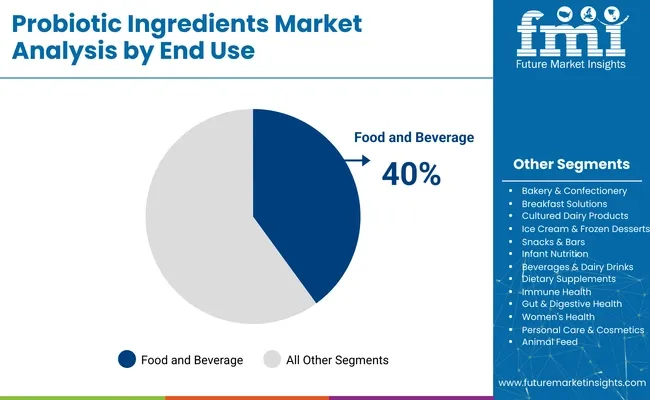
Additionally, the food and beverages processing industry, which is expected to capture 40% of the market share, will remain the primary end-use sector for probiotics. While the market faces challenges related to raw material availability and regulatory hurdles, significant opportunities exist in the form of advancements in probiotic research and the growing trend of personalized nutrition.
| Market Attribute | Value |
|---|---|
| Market Size in 2025 | USD 8 billion |
| Market Size in 2035 | USD 12 billion |
| CAGR (2025 to 2035) | 3.3% |
In October 2024, Probi introduced "Metabolic Health by Probi®," a new probiotic concept targeting key markers of metabolic syndrome. The solution combines two proprietary probiotic strains, Lactiplantibacillus plantarum 299v (LP299V®) and Lacticaseibacillus paracasei 8700:2 (L. Paracasei 8700:2®), offering support for cardiovascular health, weight management, and blood pressure regulation.
Several leading companies in the probiotic ingredients market are making significant investments in strain-specific research to enhance the effectiveness, stability, and health benefits of probiotics.This research is key for addressing specific health concerns such as digestive health, immunity, and metabolic support.
Government regulations play a crucial role in the probiotic ingredients market, ensuring product safety, quality, and accurate health claims. These regulations vary across regions but are largely focused on the health benefits of probiotics, labeling requirements, and the approval of specific strains for human consumption.
The global probiotic ingredients market is set for steady growth through 2035. In 2025, bacterial strains will hold 75%, food & beverages processing will capture 40%, and powder form will dominate with 45% market share.
Bacterial strains are projected to hold 75% of the probiotic ingredients market share in 2025. This segment includes various strains like Lactobacillus, Bifidobacterium, and Streptococcus thermophilus, which are integral to maintaining gut health.
Food & beverages processing is expected to capture 40% of the market share in 2025. Probiotic ingredients are increasingly used in dairy products, fermented foods, and functional beverages like yogurt, kefir, and kombucha.
The powder form of probiotic ingredients is expected to dominate with 45% of the market share in 2025. Powdered probiotics are preferred due to their stability, ease of handling, and longer shelf life compared to liquid forms.
The probiotic ingredients market is driven by increasing health awareness and the demand for functional foods. However, challenges related to regulatory frameworks and product consistency hinder market expansion.
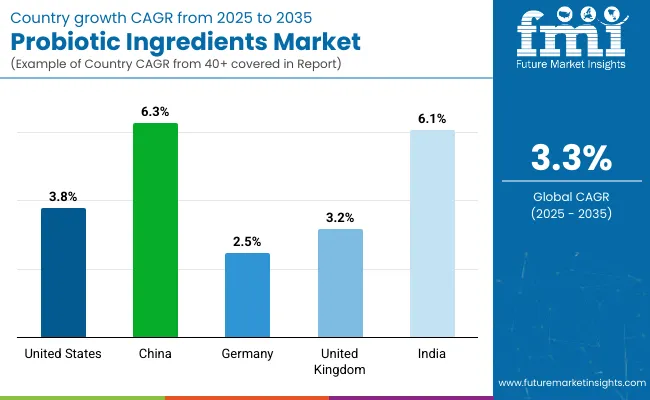
The probiotic ingredients market is growing globally, driven by rising awareness of gut health, functional foods, and innovative products. The United States, China, Germany, the United Kingdom, and India are leading this growth with strong demand for probiotics in various sectors.
| Countries | Projected CAGR (2025 to 2035) |
|---|---|
| United States | 3.8% |
| China | 6.3% |
| Germany | 2.5% |
| United Kingdom | 3.2% |
| India | 6.1% |
The USA probiotic ingredients market is projected to grow at a CAGR of 3.8% from 2025 to 2035, driven by a growing focus on gut health and demand for functional foods.
China’s probiotic ingredients market is expected to grow at a CAGR of 6.3% from 2025 to 2035, supported by the growing awareness of health and wellness.
Germany’s probiotic ingredients market is projected to grow at a CAGR of 2.5% from 2025 to 2035, driven by a strong emphasis on functional foods and sustainable living.
The UK’s probiotic ingredients market is expected to grow at a CAGR of 3.2% from 2025 to 2035, fueled by increasing consumer interest in health and wellness.
India’s probiotic ingredients market is projected to grow at a CAGR of 6.1% from 2025 to 2035, supported by the country’s rising health consciousness and expanding disposable income.
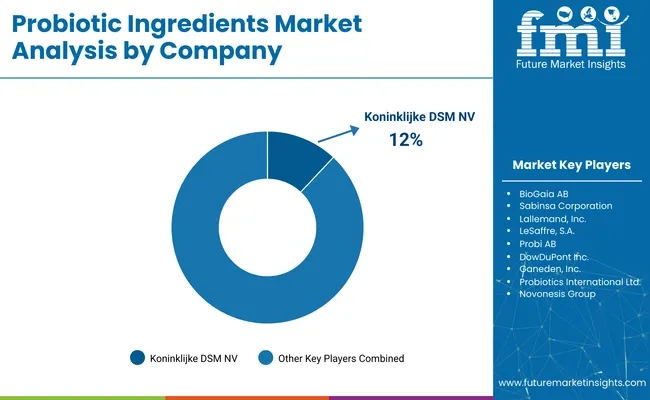
The probiotic ingredients market is characterized by a blend of global leaders and specialized regional players. Tier 1 includes multinational corporations such as Chr. Hansen Holding A/S, Koninklijke DSM N.V., Lallemand, Inc., Probi AB, and Sabinsa Corporation, which dominate with extensive production capabilities and a wide range of applications across food, beverages, and dietary supplements.
Tier 2 comprises companies like BioGaia AB, Ganeden, Inc., Kerry Group, and LeSaffre, offering specialized probiotic strains and formulations tailored to specific health benefits. Tier 3 consists of emerging and niche players focusing on innovative probiotic solutions and regional markets. Despite the dominance of Tier 1 suppliers, the market remains moderately fragmented, driven by the increasing demand for personalized and functional probiotic ingredients.
| Report Attributes | Details |
|---|---|
| Market Size in 2025 | USD 8 billion |
| Market Size in 2035 | USD 12 billion |
| CAGR (2025 to 2035) | 3.3% |
| Base Year for Estimation | 2024 |
| Historical Period | 2020 to 2024 |
| Projections Period | 2025 to 2035 |
| Quantitative Units | USD billion for value |
| Product Types Analyzed | Bacterial (Lactobacillus, Bacillus, Enterococcus, Bifidobacterium, Streptococcus, Others), Yeast (Saccharomyces Cerevisiae, Saccharomyces Boulardii) |
| End-Use Categories Analyzed | Food & Beverages Processing (Bakery & Confectionery, Breakfast Solutions, Cultured Dairy Products, Ice Cream & Frozen Desserts, Snacks & Bars, Infant Nutrition, Beverages & Dairy Drinks), Dietary Supplements (Immune Health, Gut & Digestive Health, Women's Health), Personal Care & Cosmetics, Animal Feed |
| Product Forms Analyzed | Powder, Suspension, Granule, Capsule, Stick Pack, Tablet/Chewable, Gel |
| Regions Covered | North America, Latin America, Western Europe, Eastern Europe, Balkans & Baltic, Russia & Belarus, Central Asia, East Asia, South Asia & Pacific, Middle East & Africa |
| Countries Covered | United States, Canada, Mexico, Brazil, Argentina, Germany, France, United Kingdom, Italy, Spain, Netherlands, China, India, Japan, South Korea, GCC Countries, South Africa |
| Key Players influencing the Market | BioGaia AB, Sabinsa Corporation, Lallemand, Inc., LeSaffre, S.A., Probi AB, DowDuPont Inc., Ganeden, Inc., Probiotics International Ltd., Novonesis Group, Koninklijke DSM NV, Others |
| Additional Attributes | Dollar sales by product type (bacterial vs yeast), Dollar sales by end-use (food & beverages, dietary supplements, etc.), Growth trends in immune health vs gut health applications, Regional demand dynamics across North America, Europe, and Asia-Pacific |
Bacterial (Lactobacillus, Bacillus, Enterococcus, Bifidobacterium, Streptococcus, others) and yeast (Saccharomyces Cerevisiae, Saccharomyces Boulardii).
Food & beverages processing (bakery & confectionery, breakfast solutions, cultured dairy products, ice cream & frozen desserts, snacks & bars, infant nutrition, beverages & dairy drinks), Dietary supplements (immune health, gut & digestive health, women's health), Personal care & cosmetics, and animal feed.
Powder, suspension, granule, capsule, stick pack, tablet/chewable, and gel.
North America, Latin America, Western Europe, Eastern Europe, Balkans & Baltic, Russia & Belarus, Central Asia, East Asia, South Asia & Pacific, and Middle East & Africa.
The probiotic ingredients market is projected to reach USD 8 billion in 2025.
The probiotic ingredients market is expected to grow to USD 12 billion by 2035.
The probiotic ingredients market is expected to grow at a CAGR of 3.3% from 2025 to 2035.
The powder form holds the top segment in the probiotic ingredients market, with a significant 45% market share.
China is the leading country in the probiotic ingredients market, with a CAGR of 6.3%.
Table 1: Global Market Value (US$ Million) Forecast by Region, 2018 to 2033
Table 2: Global Market Volume (MT) Forecast by Region, 2018 to 2033
Table 3: Global Market Value (US$ Million) Forecast by Product Type, 2018 to 2033
Table 4: Global Market Volume (MT) Forecast by Product Type, 2018 to 2033
Table 5: Global Market Value (US$ Million) Forecast by End Use, 2018 to 2033
Table 6: Global Market Volume (MT) Forecast by End Use, 2018 to 2033
Table 7: Global Market Value (US$ Million) Forecast by Form, 2018 to 2033
Table 8: Global Market Volume (MT) Forecast by Form, 2018 to 2033
Table 9: North America Market Value (US$ Million) Forecast by Country, 2018 to 2033
Table 10: North America Market Volume (MT) Forecast by Country, 2018 to 2033
Table 11: North America Market Value (US$ Million) Forecast by Product Type, 2018 to 2033
Table 12: North America Market Volume (MT) Forecast by Product Type, 2018 to 2033
Table 13: North America Market Value (US$ Million) Forecast by End Use, 2018 to 2033
Table 14: North America Market Volume (MT) Forecast by End Use, 2018 to 2033
Table 15: North America Market Value (US$ Million) Forecast by Form, 2018 to 2033
Table 16: North America Market Volume (MT) Forecast by Form, 2018 to 2033
Table 17: Latin America Market Value (US$ Million) Forecast by Country, 2018 to 2033
Table 18: Latin America Market Volume (MT) Forecast by Country, 2018 to 2033
Table 19: Latin America Market Value (US$ Million) Forecast by Product Type, 2018 to 2033
Table 20: Latin America Market Volume (MT) Forecast by Product Type, 2018 to 2033
Table 21: Latin America Market Value (US$ Million) Forecast by End Use, 2018 to 2033
Table 22: Latin America Market Volume (MT) Forecast by End Use, 2018 to 2033
Table 23: Latin America Market Value (US$ Million) Forecast by Form, 2018 to 2033
Table 24: Latin America Market Volume (MT) Forecast by Form, 2018 to 2033
Table 25: Europe Market Value (US$ Million) Forecast by Country, 2018 to 2033
Table 26: Europe Market Volume (MT) Forecast by Country, 2018 to 2033
Table 27: Europe Market Value (US$ Million) Forecast by Product Type, 2018 to 2033
Table 28: Europe Market Volume (MT) Forecast by Product Type, 2018 to 2033
Table 29: Europe Market Value (US$ Million) Forecast by End Use, 2018 to 2033
Table 30: Europe Market Volume (MT) Forecast by End Use, 2018 to 2033
Table 31: Europe Market Value (US$ Million) Forecast by Form, 2018 to 2033
Table 32: Europe Market Volume (MT) Forecast by Form, 2018 to 2033
Table 33: Asia Pacific Market Value (US$ Million) Forecast by Country, 2018 to 2033
Table 34: Asia Pacific Market Volume (MT) Forecast by Country, 2018 to 2033
Table 35: Asia Pacific Market Value (US$ Million) Forecast by Product Type, 2018 to 2033
Table 36: Asia Pacific Market Volume (MT) Forecast by Product Type, 2018 to 2033
Table 37: Asia Pacific Market Value (US$ Million) Forecast by End Use, 2018 to 2033
Table 38: Asia Pacific Market Volume (MT) Forecast by End Use, 2018 to 2033
Table 39: Asia Pacific Market Value (US$ Million) Forecast by Form, 2018 to 2033
Table 40: Asia Pacific Market Volume (MT) Forecast by Form, 2018 to 2033
Table 41: MEA Market Value (US$ Million) Forecast by Country, 2018 to 2033
Table 42: MEA Market Volume (MT) Forecast by Country, 2018 to 2033
Table 43: MEA Market Value (US$ Million) Forecast by Product Type, 2018 to 2033
Table 44: MEA Market Volume (MT) Forecast by Product Type, 2018 to 2033
Table 45: MEA Market Value (US$ Million) Forecast by End Use, 2018 to 2033
Table 46: MEA Market Volume (MT) Forecast by End Use, 2018 to 2033
Table 47: MEA Market Value (US$ Million) Forecast by Form, 2018 to 2033
Table 48: MEA Market Volume (MT) Forecast by Form, 2018 to 2033
Figure 1: Global Market Value (US$ Million) by Product Type, 2023 to 2033
Figure 2: Global Market Value (US$ Million) by End Use, 2023 to 2033
Figure 3: Global Market Value (US$ Million) by Form, 2023 to 2033
Figure 4: Global Market Value (US$ Million) by Region, 2023 to 2033
Figure 5: Global Market Value (US$ Million) Analysis by Region, 2018 to 2033
Figure 6: Global Market Volume (MT) Analysis by Region, 2018 to 2033
Figure 7: Global Market Value Share (%) and BPS Analysis by Region, 2023 to 2033
Figure 8: Global Market Y-o-Y Growth (%) Projections by Region, 2023 to 2033
Figure 9: Global Market Value (US$ Million) Analysis by Product Type, 2018 to 2033
Figure 10: Global Market Volume (MT) Analysis by Product Type, 2018 to 2033
Figure 11: Global Market Value Share (%) and BPS Analysis by Product Type, 2023 to 2033
Figure 12: Global Market Y-o-Y Growth (%) Projections by Product Type, 2023 to 2033
Figure 13: Global Market Value (US$ Million) Analysis by End Use, 2018 to 2033
Figure 14: Global Market Volume (MT) Analysis by End Use, 2018 to 2033
Figure 15: Global Market Value Share (%) and BPS Analysis by End Use, 2023 to 2033
Figure 16: Global Market Y-o-Y Growth (%) Projections by End Use, 2023 to 2033
Figure 17: Global Market Value (US$ Million) Analysis by Form, 2018 to 2033
Figure 18: Global Market Volume (MT) Analysis by Form, 2018 to 2033
Figure 19: Global Market Value Share (%) and BPS Analysis by Form, 2023 to 2033
Figure 20: Global Market Y-o-Y Growth (%) Projections by Form, 2023 to 2033
Figure 21: Global Market Attractiveness by Product Type, 2023 to 2033
Figure 22: Global Market Attractiveness by End Use, 2023 to 2033
Figure 23: Global Market Attractiveness by Form, 2023 to 2033
Figure 24: Global Market Attractiveness by Region, 2023 to 2033
Figure 25: North America Market Value (US$ Million) by Product Type, 2023 to 2033
Figure 26: North America Market Value (US$ Million) by End Use, 2023 to 2033
Figure 27: North America Market Value (US$ Million) by Form, 2023 to 2033
Figure 28: North America Market Value (US$ Million) by Country, 2023 to 2033
Figure 29: North America Market Value (US$ Million) Analysis by Country, 2018 to 2033
Figure 30: North America Market Volume (MT) Analysis by Country, 2018 to 2033
Figure 31: North America Market Value Share (%) and BPS Analysis by Country, 2023 to 2033
Figure 32: North America Market Y-o-Y Growth (%) Projections by Country, 2023 to 2033
Figure 33: North America Market Value (US$ Million) Analysis by Product Type, 2018 to 2033
Figure 34: North America Market Volume (MT) Analysis by Product Type, 2018 to 2033
Figure 35: North America Market Value Share (%) and BPS Analysis by Product Type, 2023 to 2033
Figure 36: North America Market Y-o-Y Growth (%) Projections by Product Type, 2023 to 2033
Figure 37: North America Market Value (US$ Million) Analysis by End Use, 2018 to 2033
Figure 38: North America Market Volume (MT) Analysis by End Use, 2018 to 2033
Figure 39: North America Market Value Share (%) and BPS Analysis by End Use, 2023 to 2033
Figure 40: North America Market Y-o-Y Growth (%) Projections by End Use, 2023 to 2033
Figure 41: North America Market Value (US$ Million) Analysis by Form, 2018 to 2033
Figure 42: North America Market Volume (MT) Analysis by Form, 2018 to 2033
Figure 43: North America Market Value Share (%) and BPS Analysis by Form, 2023 to 2033
Figure 44: North America Market Y-o-Y Growth (%) Projections by Form, 2023 to 2033
Figure 45: North America Market Attractiveness by Product Type, 2023 to 2033
Figure 46: North America Market Attractiveness by End Use, 2023 to 2033
Figure 47: North America Market Attractiveness by Form, 2023 to 2033
Figure 48: North America Market Attractiveness by Country, 2023 to 2033
Figure 49: Latin America Market Value (US$ Million) by Product Type, 2023 to 2033
Figure 50: Latin America Market Value (US$ Million) by End Use, 2023 to 2033
Figure 51: Latin America Market Value (US$ Million) by Form, 2023 to 2033
Figure 52: Latin America Market Value (US$ Million) by Country, 2023 to 2033
Figure 53: Latin America Market Value (US$ Million) Analysis by Country, 2018 to 2033
Figure 54: Latin America Market Volume (MT) Analysis by Country, 2018 to 2033
Figure 55: Latin America Market Value Share (%) and BPS Analysis by Country, 2023 to 2033
Figure 56: Latin America Market Y-o-Y Growth (%) Projections by Country, 2023 to 2033
Figure 57: Latin America Market Value (US$ Million) Analysis by Product Type, 2018 to 2033
Figure 58: Latin America Market Volume (MT) Analysis by Product Type, 2018 to 2033
Figure 59: Latin America Market Value Share (%) and BPS Analysis by Product Type, 2023 to 2033
Figure 60: Latin America Market Y-o-Y Growth (%) Projections by Product Type, 2023 to 2033
Figure 61: Latin America Market Value (US$ Million) Analysis by End Use, 2018 to 2033
Figure 62: Latin America Market Volume (MT) Analysis by End Use, 2018 to 2033
Figure 63: Latin America Market Value Share (%) and BPS Analysis by End Use, 2023 to 2033
Figure 64: Latin America Market Y-o-Y Growth (%) Projections by End Use, 2023 to 2033
Figure 65: Latin America Market Value (US$ Million) Analysis by Form, 2018 to 2033
Figure 66: Latin America Market Volume (MT) Analysis by Form, 2018 to 2033
Figure 67: Latin America Market Value Share (%) and BPS Analysis by Form, 2023 to 2033
Figure 68: Latin America Market Y-o-Y Growth (%) Projections by Form, 2023 to 2033
Figure 69: Latin America Market Attractiveness by Product Type, 2023 to 2033
Figure 70: Latin America Market Attractiveness by End Use, 2023 to 2033
Figure 71: Latin America Market Attractiveness by Form, 2023 to 2033
Figure 72: Latin America Market Attractiveness by Country, 2023 to 2033
Figure 73: Europe Market Value (US$ Million) by Product Type, 2023 to 2033
Figure 74: Europe Market Value (US$ Million) by End Use, 2023 to 2033
Figure 75: Europe Market Value (US$ Million) by Form, 2023 to 2033
Figure 76: Europe Market Value (US$ Million) by Country, 2023 to 2033
Figure 77: Europe Market Value (US$ Million) Analysis by Country, 2018 to 2033
Figure 78: Europe Market Volume (MT) Analysis by Country, 2018 to 2033
Figure 79: Europe Market Value Share (%) and BPS Analysis by Country, 2023 to 2033
Figure 80: Europe Market Y-o-Y Growth (%) Projections by Country, 2023 to 2033
Figure 81: Europe Market Value (US$ Million) Analysis by Product Type, 2018 to 2033
Figure 82: Europe Market Volume (MT) Analysis by Product Type, 2018 to 2033
Figure 83: Europe Market Value Share (%) and BPS Analysis by Product Type, 2023 to 2033
Figure 84: Europe Market Y-o-Y Growth (%) Projections by Product Type, 2023 to 2033
Figure 85: Europe Market Value (US$ Million) Analysis by End Use, 2018 to 2033
Figure 86: Europe Market Volume (MT) Analysis by End Use, 2018 to 2033
Figure 87: Europe Market Value Share (%) and BPS Analysis by End Use, 2023 to 2033
Figure 88: Europe Market Y-o-Y Growth (%) Projections by End Use, 2023 to 2033
Figure 89: Europe Market Value (US$ Million) Analysis by Form, 2018 to 2033
Figure 90: Europe Market Volume (MT) Analysis by Form, 2018 to 2033
Figure 91: Europe Market Value Share (%) and BPS Analysis by Form, 2023 to 2033
Figure 92: Europe Market Y-o-Y Growth (%) Projections by Form, 2023 to 2033
Figure 93: Europe Market Attractiveness by Product Type, 2023 to 2033
Figure 94: Europe Market Attractiveness by End Use, 2023 to 2033
Figure 95: Europe Market Attractiveness by Form, 2023 to 2033
Figure 96: Europe Market Attractiveness by Country, 2023 to 2033
Figure 97: Asia Pacific Market Value (US$ Million) by Product Type, 2023 to 2033
Figure 98: Asia Pacific Market Value (US$ Million) by End Use, 2023 to 2033
Figure 99: Asia Pacific Market Value (US$ Million) by Form, 2023 to 2033
Figure 100: Asia Pacific Market Value (US$ Million) by Country, 2023 to 2033
Figure 101: Asia Pacific Market Value (US$ Million) Analysis by Country, 2018 to 2033
Figure 102: Asia Pacific Market Volume (MT) Analysis by Country, 2018 to 2033
Figure 103: Asia Pacific Market Value Share (%) and BPS Analysis by Country, 2023 to 2033
Figure 104: Asia Pacific Market Y-o-Y Growth (%) Projections by Country, 2023 to 2033
Figure 105: Asia Pacific Market Value (US$ Million) Analysis by Product Type, 2018 to 2033
Figure 106: Asia Pacific Market Volume (MT) Analysis by Product Type, 2018 to 2033
Figure 107: Asia Pacific Market Value Share (%) and BPS Analysis by Product Type, 2023 to 2033
Figure 108: Asia Pacific Market Y-o-Y Growth (%) Projections by Product Type, 2023 to 2033
Figure 109: Asia Pacific Market Value (US$ Million) Analysis by End Use, 2018 to 2033
Figure 110: Asia Pacific Market Volume (MT) Analysis by End Use, 2018 to 2033
Figure 111: Asia Pacific Market Value Share (%) and BPS Analysis by End Use, 2023 to 2033
Figure 112: Asia Pacific Market Y-o-Y Growth (%) Projections by End Use, 2023 to 2033
Figure 113: Asia Pacific Market Value (US$ Million) Analysis by Form, 2018 to 2033
Figure 114: Asia Pacific Market Volume (MT) Analysis by Form, 2018 to 2033
Figure 115: Asia Pacific Market Value Share (%) and BPS Analysis by Form, 2023 to 2033
Figure 116: Asia Pacific Market Y-o-Y Growth (%) Projections by Form, 2023 to 2033
Figure 117: Asia Pacific Market Attractiveness by Product Type, 2023 to 2033
Figure 118: Asia Pacific Market Attractiveness by End Use, 2023 to 2033
Figure 119: Asia Pacific Market Attractiveness by Form, 2023 to 2033
Figure 120: Asia Pacific Market Attractiveness by Country, 2023 to 2033
Figure 121: MEA Market Value (US$ Million) by Product Type, 2023 to 2033
Figure 122: MEA Market Value (US$ Million) by End Use, 2023 to 2033
Figure 123: MEA Market Value (US$ Million) by Form, 2023 to 2033
Figure 124: MEA Market Value (US$ Million) by Country, 2023 to 2033
Figure 125: MEA Market Value (US$ Million) Analysis by Country, 2018 to 2033
Figure 126: MEA Market Volume (MT) Analysis by Country, 2018 to 2033
Figure 127: MEA Market Value Share (%) and BPS Analysis by Country, 2023 to 2033
Figure 128: MEA Market Y-o-Y Growth (%) Projections by Country, 2023 to 2033
Figure 129: MEA Market Value (US$ Million) Analysis by Product Type, 2018 to 2033
Figure 130: MEA Market Volume (MT) Analysis by Product Type, 2018 to 2033
Figure 131: MEA Market Value Share (%) and BPS Analysis by Product Type, 2023 to 2033
Figure 132: MEA Market Y-o-Y Growth (%) Projections by Product Type, 2023 to 2033
Figure 133: MEA Market Value (US$ Million) Analysis by End Use, 2018 to 2033
Figure 134: MEA Market Volume (MT) Analysis by End Use, 2018 to 2033
Figure 135: MEA Market Value Share (%) and BPS Analysis by End Use, 2023 to 2033
Figure 136: MEA Market Y-o-Y Growth (%) Projections by End Use, 2023 to 2033
Figure 137: MEA Market Value (US$ Million) Analysis by Form, 2018 to 2033
Figure 138: MEA Market Volume (MT) Analysis by Form, 2018 to 2033
Figure 139: MEA Market Value Share (%) and BPS Analysis by Form, 2023 to 2033
Figure 140: MEA Market Y-o-Y Growth (%) Projections by Form, 2023 to 2033
Figure 141: MEA Market Attractiveness by Product Type, 2023 to 2033
Figure 142: MEA Market Attractiveness by End Use, 2023 to 2033
Figure 143: MEA Market Attractiveness by Form, 2023 to 2033
Figure 144: MEA Market Attractiveness by Country, 2023 to 2033


Full Research Suite comprises of:
Market outlook & trends analysis
Interviews & case studies
Strategic recommendations
Vendor profiles & capabilities analysis
5-year forecasts
8 regions and 60+ country-level data splits
Market segment data splits
12 months of continuous data updates
DELIVERED AS:
PDF EXCEL ONLINE
Market Share Breakdown of Probiotic Ingredients
Probiotic Skincare Ingredients Market Size and Share Forecast Outlook 2025 to 2035
UK Probiotic Ingredients Market Analysis – Size, Growth & Industry Trends 2025-2035
USA Probiotic Ingredients Market Insights – Demand, Share & Forecast 2025-2035
ASEAN Probiotic Ingredients Market Outlook – Growth, Size & Forecast 2025–2035
Europe Probiotic Ingredients Market Trends – Growth, Demand & Forecast 2025-2035
Australia Probiotic Ingredients Market Report – Demand, Trends & Innovations 2025-2035
Latin America Probiotic Ingredients Market Outlook – Size, Share & Forecast 2025-2035
Probiotic Chewing Gum Market Size and Share Forecast Outlook 2025 to 2035
Probiotics For Oral Health Market Size and Share Forecast Outlook 2025 to 2035
Probiotic Face Masks Market Size and Share Forecast Outlook 2025 to 2035
Probiotic-Infused Creams Market Size and Share Forecast Outlook 2025 to 2035
Probiotic Wellness Drinks Market Size and Share Forecast Outlook 2025 to 2035
Probiotic Fermentation Skincare Market Size and Share Forecast Outlook 2025 to 2035
Probiotic Skincare Solutions Market Size and Share Forecast Outlook 2025 to 2035
Probiotic Supplements Market Analysis - Size, Share, and Forecast 2025 to 2035
Global Probiotic Serum Market Size and Share Forecast Outlook 2025 to 2035
Probiotic Yogurt Market Analysis - Size, Share & Forecast 2025 to 2035
Probiotic Beverage Market Analysis - Size, Share, and Forecast Outlook 2025 to 2035
Probiotic Drink Market Analysis - Size, Share, and Forecast Outlook 2025 to 2035

Thank you!
You will receive an email from our Business Development Manager. Please be sure to check your SPAM/JUNK folder too.
Chat With
MaRIA