Probiotic Supplements Market Size, Share, and Forecast 2025 to 2035

The probiotic supplements market is expected to grow from USD 13.30 billion in 2025 to USD 34.08 billion by 2035, at a CAGR of 9.7%. This growth is driven by increasing awareness of gut health, immunity, and the gut-brain axis, along with the rise in digestive disorders and a shift toward preventive healthcare. Regulatory approvals from bodies like the USA FDA and EFSA have enhanced consumer confidence.
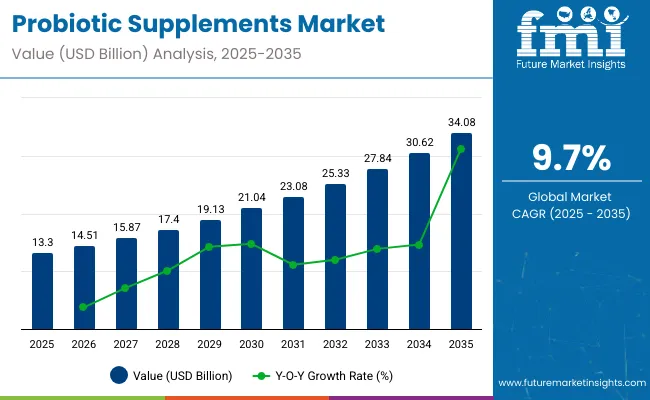
Quick Stats of Probiotic Supplements Market

  • Market Value (2025): USD 13.30 billion
  • Forecast Value (2035): USD 34.08 billion
  • Forecast CAGR: 9.7%
  • Dominant Functionality Segment: Digestive Health (38% market share in 2025)
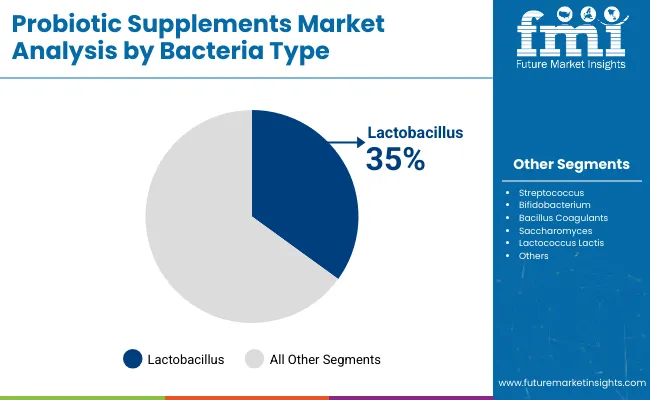
  • Leading Bacteria Type: Lactobacillus (35% market share)
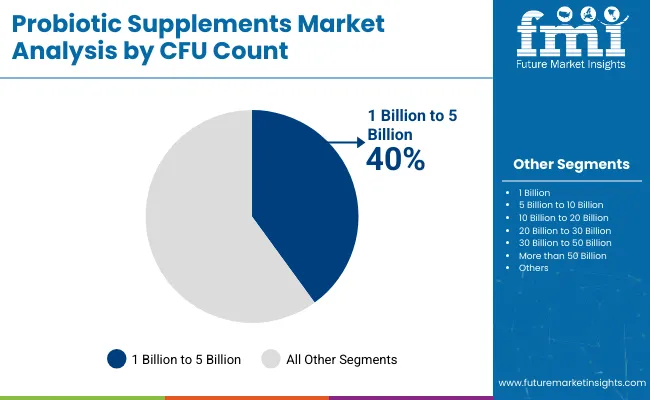
  • Top CFU Range: 1 Billion to 5 Billion (40% market share)
  • Fastest-Growing Country: India (CAGR of 12.1%)

Probiotic Supplements Market

Key Probiotic Supplements Market Insights

The probiotic supplements market is projected to grow at a strong CAGR of 9.7%, reaching USD 34.08 billion by 2035. Digestive health will be the key driver, capturing 38% of the market share by 2025. Lactobacillus strains, known for their digestive benefits, lead the bacteria type segment with a 35% share.

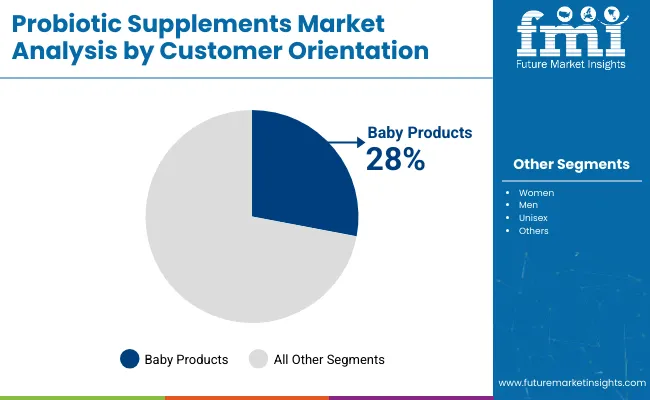
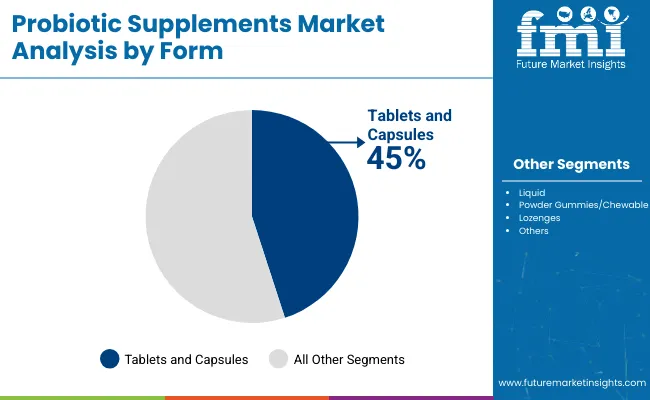
Baby-specific probiotic products are gaining popularity, expected to account for 28% of the market. The 1-5 billion CFU range will dominate, holding a 40% market share. Tablets and capsules are the preferred forms, representing 45% of the market. India is anticipated to be the fastest-growing market due to rising awareness and affordable products.

In 2024, Nestlé Health Science CEO Greg Behar emphasized the company’s investment in synbiotic formulations combining probiotics and prebiotics for digestive and immune health. ADM expanded its microbiome innovation center in Valencia to advance postbiotic product pipelines.

In 2025, Chr. Hansen launched a transparency platform for verifying strain origin, CFU count, and clinical backing via QR codes. Consumer Lab’s 2024 review highlighted BioGaia and Culturelle for their consistent potency. The International Probiotics Association (IPA) projects that shelf-stable and targeted-release capsules will account for nearly 50% of sales by 2035, with emerging applications in weight management and mental wellness.

Analyzing Probiotic Supplements Market by Top Investment Segments

Digestive health will dominate the functionality segment with a 38% market share, while lactobacillus will lead the bacteria type segment with a 35% share. Baby products will capture 28% of the customer orientation segment by 2025.
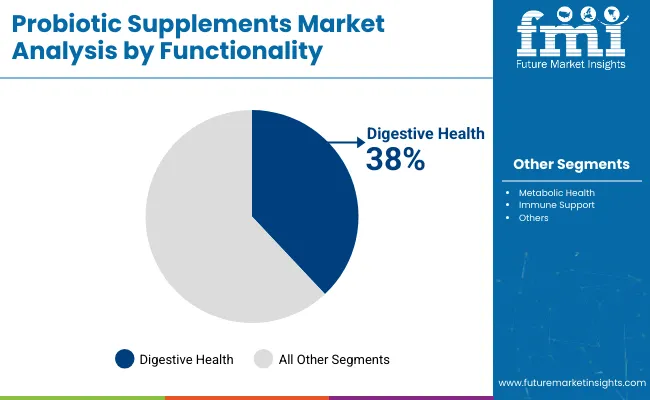
Digestive Health Dominates the Functionality Segment with 38% Share

Digestive health continues to lead the probiotic supplements market, holding a 38% market share by 2025.
Probiotic Supplements Market Analysis By Functionality

  • Growing awareness of the connection between gut health and overall well-being is driving demand for supplements that aid in digestive function.
  • Probiotic supplements for digestive health help manage conditions such as bloating, constipation, and irritable bowel syndrome (IBS).
  • Increasing adoption of probiotics in everyday wellness routines further propels this segment.
  • Leading brands like Culturelle, Align, and Florastor are at the forefront of providing probiotics that support digestive health.

Lactobacillus Dominates the Bacteria Type Segment with 35% Share

Lactobacillus is expected to capture 35% of the market share in the bacteria type segment by 2025.
  • Lactobacillus is known for its ability to survive in acidic environments and its benefits for digestive health.
  • Widely used in probiotic supplements, Lactobacillus strains are particularly effective in treating conditions such as diarrhea, irritable bowel syndrome (IBS), and constipation.
  • Key players like Danone, Nestlé, and Kerry Group offer products featuring Lactobacillus, meeting the increasing demand for this beneficial bacteria type.

Baby Products Lead the Customer Orientation Segment with 28% Market Share

Baby products are expected to hold a 28% market share in the customer orientation segment by 2025.
  • Growing awareness among parents about the benefits of probiotics for infants is driving the demand for baby-specific probiotics.
  • These supplements help support the development of a healthy gut microbiome in babies and may alleviate issues such as colic, diarrhea, and constipation.
  • Major brands like Gerber, BioGaia, and Enfamil lead this segment by offering probiotic supplements specially formulated for babies.

Probiotic Supplements with 1 Billion to 5 Billion CFU Lead with 40% Market Share

Probiotic supplements with a CFU count between 1 billion and 5 billion will capture 40% of the market share by 2025.
  • The CFU range is ideal for daily digestive health maintenance, providing sufficient amounts of live microorganisms to support gut health.
  • These supplements are popular due to their balance of effectiveness and affordability, making them suitable for general wellness and preventive health.
  • Brands like Garden of Life, Renew Life, and Culturelle are driving growth in this segment.
  • These brands offer probiotic supplements within this CFU range to meet the needs of health-conscious consumers.

Tablets and Capsules Lead the Form Segment with 45% Market Share

Tablets and capsules are expected to dominate the form segment, holding 45% of the market share by 2025.

  • Tablets and capsules are highly favored for their ease of use, precise dosage, and long shelf life.
  • These forms provide convenience for on-the-go consumption, making them ideal for busy consumers.
  • Major players like Nature’s Bounty, New Chapter, and NOW Foods are focusing on developing high-quality probiotic supplements in tablet and capsule form.

Top Probiotic Supplements Dynamics

Probiotic Supplements Market Dynamics

The global probiotic supplements market is experiencing steady growth, driven by the increasing awareness of gut health and digestive well-being, as well as the growing adoption of probiotics in daily wellness routines. However, the market also faces challenges related to regulatory hurdles and competition from alternative health supplements.

Recent Trends in the Probiotic Supplements Industry

  • Increased adoption of probiotics for digestive health as more consumers recognize their benefits in managing conditions like bloating, constipation, and irritable bowel syndrome (IBS).
  • Probiotic supplements for infants are gaining popularity as parents become more aware of their benefits in supporting the development of a healthy gut microbiome in babies.
  • Lactobacillus-based products are on the rise due to their effectiveness in promoting gut health and treating digestive issues.
  • Online retail channels are expanding as more consumers purchase probiotics through digital platforms, driven by convenience and better access to product information.
  • Probiotics for mental health are gaining traction, with research highlighting the gut-brain connection, increasing interest in supplements that support mood and cognitive function.

Challenges in the Probiotic Supplements Market

  • Regulatory barriers continue to pose challenges for brands, as the lack of clear guidelines in some regions hinders market expansion.
  • High competition in the market is leading to price wars, particularly among established brands and new entrants offering similar formulations.
  • Consumer skepticism regarding the efficacy of probiotics due to inconsistent scientific evidence on some health claims is affecting market growth.

Analyzing Top Countries Formulating, Distributing, and Supplying Probiotic Supplements Market Growth

The probiotic supplements market is experiencing substantial growth, driven by increasing awareness of digestive health, immune support, and overall wellness. Leading countries in the formulation, distribution, and consumption of probiotic supplements include the United States, United Kingdom, India, Germany, and South Korea.
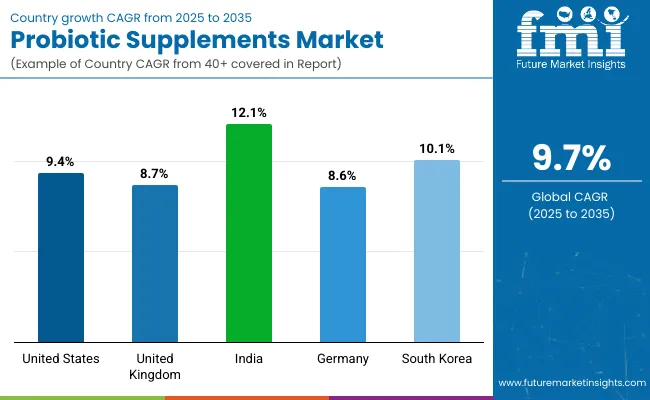
Country Wise Analysis Of Probiotic Supplements Market Cagr 2025 To 2035

Countries Projected CAGR (2025 to 2035)
United States 9.4%
United Kingdom 8.7%
India 12.1%
Germany 8.6%
South Korea 10.1%

United States Probiotic Supplements Market Growth

The USA probiotic supplements market is expected to expand at a CAGR of 9.4% from 2025 to 2035. Major brands like Garden of Life, Culturelle, and Activia are at the forefront of market development, offering a variety of probiotic formulations targeting different health benefits.

  • Health awareness driving demand for gut health and immunity-boosting products.
  • Strong demand for both dietary supplements and functional foods.
  • Online and retail channels expanding product accessibility.
  • Key market players such as Garden of Life and Culturelle leading the innovation.
  • Growing consumer interest in natural and organic probiotic supplements.

United Kingdom Probiotic Supplements Market Growth

The UK probiotic supplements market is expected to grow at a CAGR of 8.7% during the forecast period. Major brands like Yakult and Bio-K+ are expanding their product lines to cater to diverse consumer needs, particularly in the digestive health segment.

  • Consumer focus on gut health driving demand for probiotics.
  • Government initiatives promoting healthier dietary habits.
  • Growing interest in functional foods enriched with probiotics.
  • Innovative offerings from companies like Yakult and Bio-K+ leading the market.
  • Increased consumer adoption of probiotics as a preventive health measure.

India Probiotic Supplements Market Analysis

India's probiotic supplements market is forecast to grow at an impressive CAGR of 12.1%. Brands like Dabur and The Himalaya Drug Company are tapping into the health-conscious population with affordable and culturally relevant probiotic products.

  • Growing awareness of digestive health in urban regions.
  • Cultural preference for Ayurveda-based probiotics boosting market demand.
  • Prevalence of gastrointestinal disorders contributing to increased consumption.
  • Affordable probiotic options targeting diverse demographics.
  • Retail and e-commerce expansion for greater accessibility.

Germany Probiotic Supplements Market Overview

The German probiotic supplements market is projected to expand at a CAGR of 8.6% from 2025 to 2035. Germany is a significant player in the European market, with strong demand for high-quality probiotic supplements.

  • Premium products gaining popularity in the German market.
  • Rising demand for scientifically-backed probiotics for digestive and immune health.
  • Increased interest in functional food products enriched with probiotics.
  • Government health policies promoting consumer awareness about nutrition.
  • Key market players such as Bioglan and Probi leading the way.

South Korea Probiotic Supplements Market Dynamics

South Korea's probiotic supplements market is expected to grow at a CAGR of 10.1%, driven by the increasing popularity of health-conscious lifestyles. Brands like LG Household & Health Care are leading the charge with high-quality probiotics designed to target specific health benefits.
  • Rising focus on wellness and gut health among South Korean consumers.
  • Probiotic consumption becoming integral to preventive healthcare regimens.
  • Demand for immune-boosting products driven by the aging population.
  • Strong product offerings from companies like LG Household & Health Care.
  • Health-conscious population seeking functional health supplements.

Leading Probiotic Supplements Suppliers

Probiotic Supplements Market Analysis By Company

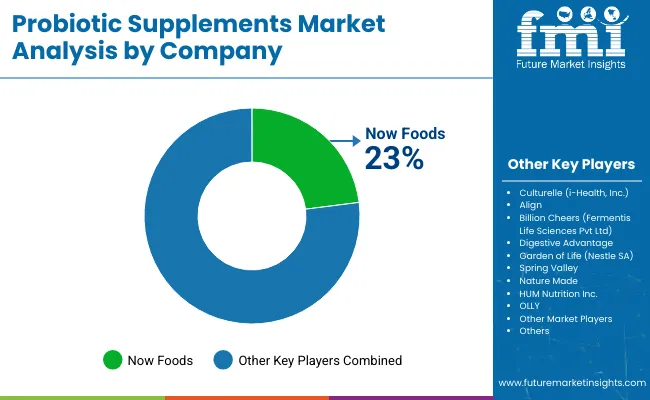
The probiotic supplements market is diverse, with Tier 1 players like Culturelle (i-Health, Inc.), Align, and Garden of Life (Nestle SA) leading through strong brand recognition, extensive product lines, and substantial R&D investment. These companies prioritize product innovation and clinical research, offering specialized probiotic formulations for digestive health. Tier 2 players like Billion Cheers (Fermentis Life Sciences Pvt Ltd) and Spring Valley focus on affordability and regional expansion, often incorporating organic ingredients to appeal to health-conscious consumers.

Tier 3 companies, such as Now Foods, Nature Made, and OLLY, target niche markets with specialized products like mood balance and skin health, leveraging digital marketing strategies. Entry barriers are moderate due to regulatory hurdles, large-scale manufacturing, and strong brand loyalty from top players. Market fragmentation is evident, but consolidation is increasing as larger firms acquire smaller competitors to expand their product offerings and market reach.

Recent Probiotic Supplements Industry News

  • In March 2024, Garden of Life (under Nestlé Health Science) launched a “Sport” line extension featuring Non GMO and USDA Organic-certified probiotic supplements in the USA
  • In mid 2024, Garden of Life expanded into the UK and Ireland market by rolling out six high potency (10-50 billion CFU) microbiome supplements in 600+ Holland & Barrett stores and online.

Probiotic Supplements Market Report Scope

Report Attributes Details
Market Size (2025) USD 13.30 billion
Projected Market Size (2035) USD 34.08 billion
CAGR (2025 to 2035) 9.7%
Base Year for Estimation 2024
Historical Period 2020 to 2024
Projections Period 2025 to 2035
Quantitative Units USD billion for value
Functionality Segments Analyzed Digestive Health, Metabolic Health, Immune Support, Others
Customer Orientation Segments Analyzed Baby, Women, Men, Unisex
Bacteria Types Analyzed Lactobacillus, Streptococcus, Bifidobacterium, Bacillus coagulants, Saccharomyces, Lactococcus lactis
CFU Count Segments Analyzed Less than 1 Billion, 1 Billion to 5 Billion, 5 Billion to 10 Billion, 10 Billion to 20 Billion, 20 Billion to 30 Billion, 30 Billion to 50 Billion, More than 50 Billion
Form Types Analyzed Tablets/Pills, Capsules, Liquid, Powder, Gummies/Chewable, Lozenges, Others (Gels, Soft Gels)
Regions Covered North America, Latin America, Western Europe, Eastern Europe, East Asia, South Asia & Pacific, Central Asia, Russia and Belarus, Balkan & Baltic Countries, Middle East and Africa
Countries Covered United States, Canada, Brazil, Mexico, Germany, France, United Kingdom, Italy, Spain, China, Japan, South Korea, India, Australia, UAE, South Africa
Key Players Influencing the Market Culturelle (i-Health, Inc.), Align, Billion Cheers (Fermentis Life Sciences Pvt Ltd), Digestive Advantage, Garden of Life (Nestle SA), Spring Valley, Now Foods, Nature Made, HUM Nutrition Inc., OLLY, Other Market Players
Additional Attributes Dollar sales growth by functionality (digestive/immune), regional demand trends, competitive landscape, CFU count preference, form type preference, consumer behavior, sustainability, and innovation in probiotic supplements

Leading Players

  • Culturelle (i-Health, Inc.)
  • Align
  • Billion Cheers (Fermentis Life Sciences Pvt Ltd)
  • Digestive Advantage
  • Garden of Life (Nestle SA)
  • Spring Valley
  • Now Foods
  • Nature Made
  • HUM Nutrition Inc.
  • OLLY
  • Other Market Players

Probiotic Supplements Market Analyzed by Key Investment Segments

By Functionality:

Digestive Health, Metabolic Health, Immune Support, Others.

By Customer Orientation:

Baby, Women, Men, Unisex.

By Bacteria Type:

Lactobacillus, Streptococcus, Bifidobacterium, Bacillus coagulants, Saccharomyces, Lactococcus lactis.

By CFU Count:

Less than 1 Billion, 1 Billion to 5 Billion, 5 Billion to 10 Billion, 10 Billion to 20 Billion, 20 Billion to 30 Billion, 30 Billion to 50 Billion, More than 50 Billion.

By Form:

Tablets/Pills, Capsules, Liquid, Powder, Gummies/Chewable, Lozenges, Others (Gels, Soft Gels).

By Region:

North America, Latin America, Western Europe, Eastern Europe, East Asia, South Asia & Pacific, Central Asia, Russia and Belarus, Balkan & Baltic Countries, Middle East and Africa.

Table of Content

  1. Executive Summary
  2. Industry Introduction, including Taxonomy and Market Definition
  3. Trends and Success Factors, including Macro-economic Factors, Market Dynamics, and Recent Industry Developments
  4. Global Market Demand Analysis 2020 to 2024 and Forecast 2025 to 2035, including Historical Analysis and Future Projections
  5. Pricing Analysis
  6. Global Market Analysis 2020 to 2024 and Forecast 2025 to 2035
    • Customer Orientation w.r.t. Functionality
    • Bacteria Type
    • CFU Count
    • Form
  7. Global Market Analysis 2020 to 2024 and Forecast 2025 to 2035, By Customer Orientation w.r.t. Functionality
    • Baby/Infant
      • Digestive Health
      • Metabolic Health
      • Immune Support
      • Others
    • Women
      • Digestive Health
      • Gut Brain Axis
      • Metabolic Health
      • Others
    • Men
      • Digestive Health
      • Gut Brain Axis
      • Metabolic Health
      • Others
    • Unisex
      • Digestive Health
      • Gut Brain Axis
      • Metabolic Health
      • Others
  8. Global Market Analysis 2020 to 2024 and Forecast 2025 to 2035, By Bacteria Type
    • Lactobacillus
    • Streptococcus
    • Bifidobacterium
    • Bacillus coagulants
    • Saccharomyces
    • Lactococcus lactis
  9. Global Market Analysis 2020 to 2024 and Forecast 2025 to 2035, By CFU Count
    • Less than 1 Billion
    • 1 Billion to 5 Billion
    • 5 Billion to 10 Billion
    • 10 Billion to 20 Billion
    • 20 Billion to 30 Billion
    • 30 Billion to 50 Billion
    • More than 50 Billion
  10. Global Market Analysis 2020 to 2024 and Forecast 2025 to 2035, By Form
    • Tablets / Pills
    • Capsules
    • Liquid
    • Powder
    • Gummies / Chewable
    • Lozenges
    • Others (Gels, Soft Gels)
  11. Global Market Analysis 2020 to 2024 and Forecast 2025 to 2035, By Region
    • North America
    • Latin America
    • Western Europe
    • Eastern Europe
    • East Asia
    • South Asia & Pacific
    • Central Asia
    • Russia and Belarus
    • Balkan & Baltic Countries
    • Middle East and Africa
  12. North America Sales Analysis 2020 to 2024 and Forecast 2025 to 2035, by Key Segments and Countries
  13. Latin America Sales Analysis 2020 to 2024 and Forecast 2025 to 2035, by Key Segments and Countries
  14. Western Europe Sales Analysis 2020 to 2024 and Forecast 2025 to 2035, by Key Segments and Countries
  15. Eastern Europe Sales Analysis 2020 to 2024 and Forecast 2025 to 2035, by Key Segments and Countries
  16. East Asia Sales Analysis 2020 to 2024 and Forecast 2025 to 2035, by Key Segments and Countries
  17. South Asia & Pacific Sales Analysis 2020 to 2024 and Forecast 2025 to 2035, by Key Segments and Countries
  18. Central Asia Sales Analysis 2020 to 2024 and Forecast 2025 to 2035, by Key Segments and Countries
  19. Russia and Belarus Sales Analysis 2020 to 2024 and Forecast 2025 to 2035, by Key Segments and Countries
  20. Balkan & Baltic Countries Sales Analysis 2020 to 2024 and Forecast 2025 to 2035, by Key Segments and Countries
  21. Middle East and Africa Sales Analysis 2020 to 2024 and Forecast 2025 to 2035, by Key Segments and Countries
  22. Sales Forecast to 2035 by Customer Orientation w.r.t. Functionality and Bacteria Type for 30 Countries
  23. Competitive Assessment, Company Share Analysis by Key Players, and Competition Dashboard
  24. Company Profile
    • Culturelle (i-Health, Inc.)
    • Align
    • Billion Cheers (Fermentis Life Sciences Pvt Ltd)
    • Digestive Advantage
    • Garden of Life (Nestle SA)
    • Spring Valley
    • Now Foods
    • Nature Made
    • HUM Nutrition Inc.
    • OLLY
    • Other Market Players

List of Tables

  • Table 1: Global Market Value (USD Billion) Forecast by Region, 2020 to 2035
  • Table 2: Global Market Volume (MT) Forecast by Region, 2020 to 2035
  • Table 3: Global Market Value (USD Billion) Forecast by Functionality, 2020 to 2035
  • Table 4: Global Market Volume (MT) Forecast by Functionality, 2020 to 2035
  • Table 5: Global Market Value (USD Billion) Forecast by Customer Orientation, 2020 to 2035
  • Table 6: Global Market Volume (MT) Forecast by Customer Orientation, 2020 to 2035
  • Table 7: Global Market Value (USD Billion) Forecast by Bacteria Type, 2020 to 2035
  • Table 8: Global Market Volume (MT) Forecast by Bacteria Type, 2020 to 2035
  • Table 9: Global Market Value (USD Billion) Forecast by CFU Count, 2020 to 2035
  • Table 10: Global Market Volume (MT) Forecast by CFU Count, 2020 to 2035
  • Table 11: Global Market Value (USD Billion) Forecast by Form, 2020 to 2035
  • Table 12: Global Market Volume (MT) Forecast by Form, 2020 to 2035
  • Table 13: North America Market Value (USD Billion) Forecast by Country, 2020 to 2035
  • Table 14: North America Market Volume (MT) Forecast by Country, 2020 to 2035
  • Table 15: North America Market Value (USD Billion) Forecast by Functionality, 2020 to 2035
  • Table 16: North America Market Volume (MT) Forecast by Functionality, 2020 to 2035
  • Table 17: North America Market Value (USD Billion) Forecast by Customer Orientation, 2020 to 2035
  • Table 18: North America Market Volume (MT) Forecast by Customer Orientation, 2020 to 2035
  • Table 19: North America Market Value (USD Billion) Forecast by Bacteria Type, 2020 to 2035
  • Table 20: North America Market Volume (MT) Forecast by Bacteria Type, 2020 to 2035
  • Table 21: North America Market Value (USD Billion) Forecast by CFU Count, 2020 to 2035
  • Table 22: North America Market Volume (MT) Forecast by CFU Count, 2020 to 2035
  • Table 23: North America Market Value (USD Billion) Forecast by Form, 2020 to 2035
  • Table 24: North America Market Volume (MT) Forecast by Form, 2020 to 2035
  • Table 25: Latin America Market Value (USD Billion) Forecast by Country, 2020 to 2035
  • Table 26: Latin America Market Volume (MT) Forecast by Country, 2020 to 2035
  • Table 27: Latin America Market Value (USD Billion) Forecast by Functionality, 2020 to 2035
  • Table 28: Latin America Market Volume (MT) Forecast by Functionality, 2020 to 2035
  • Table 29: Latin America Market Value (USD Billion) Forecast by Customer Orientation, 2020 to 2035
  • Table 30: Latin America Market Volume (MT) Forecast by Customer Orientation, 2020 to 2035
  • Table 31: Latin America Market Value (USD Billion) Forecast by Bacteria Type, 2020 to 2035
  • Table 32: Latin America Market Volume (MT) Forecast by Bacteria Type, 2020 to 2035
  • Table 33: Latin America Market Value (USD Billion) Forecast by CFU Count, 2020 to 2035
  • Table 34: Latin America Market Volume (MT) Forecast by CFU Count, 2020 to 2035
  • Table 35: Latin America Market Value (USD Billion) Forecast by Form, 2020 to 2035
  • Table 36: Latin America Market Volume (MT) Forecast by Form, 2020 to 2035
  • Table 37: Western Europe Market Value (USD Billion) Forecast by Country, 2020 to 2035
  • Table 38: Western Europe Market Volume (MT) Forecast by Country, 2020 to 2035
  • Table 39: Western Europe Market Value (USD Billion) Forecast by Functionality, 2020 to 2035
  • Table 40: Western Europe Market Volume (MT) Forecast by Functionality, 2020 to 2035
  • Table 41: Western Europe Market Value (USD Billion) Forecast by Customer Orientation, 2020 to 2035
  • Table 42: Western Europe Market Volume (MT) Forecast by Customer Orientation, 2020 to 2035
  • Table 43: Western Europe Market Value (USD Billion) Forecast by Bacteria Type, 2020 to 2035
  • Table 44: Western Europe Market Volume (MT) Forecast by Bacteria Type, 2020 to 2035
  • Table 45: Western Europe Market Value (USD Billion) Forecast by CFU Count, 2020 to 2035
  • Table 46: Western Europe Market Volume (MT) Forecast by CFU Count, 2020 to 2035
  • Table 47: Western Europe Market Value (USD Billion) Forecast by Form, 2020 to 2035
  • Table 48: Western Europe Market Volume (MT) Forecast by Form, 2020 to 2035
  • Table 49: Eastern Europe Market Value (USD Billion) Forecast by Country, 2020 to 2035
  • Table 50: Eastern Europe Market Volume (MT) Forecast by Country, 2020 to 2035
  • Table 51: Eastern Europe Market Value (USD Billion) Forecast by Functionality, 2020 to 2035
  • Table 52: Eastern Europe Market Volume (MT) Forecast by Functionality, 2020 to 2035
  • Table 53: Eastern Europe Market Value (USD Billion) Forecast by Customer Orientation, 2020 to 2035
  • Table 54: Eastern Europe Market Volume (MT) Forecast by Customer Orientation, 2020 to 2035
  • Table 55: Eastern Europe Market Value (USD Billion) Forecast by Bacteria Type, 2020 to 2035
  • Table 56: Eastern Europe Market Volume (MT) Forecast by Bacteria Type, 2020 to 2035
  • Table 57: Eastern Europe Market Value (USD Billion) Forecast by CFU Count, 2020 to 2035
  • Table 58: Eastern Europe Market Volume (MT) Forecast by CFU Count, 2020 to 2035
  • Table 59: Eastern Europe Market Value (USD Billion) Forecast by Form, 2020 to 2035
  • Table 60: Eastern Europe Market Volume (MT) Forecast by Form, 2020 to 2035
  • Table 61: East Asia Market Value (USD Billion) Forecast by Country, 2020 to 2035
  • Table 62: East Asia Market Volume (MT) Forecast by Country, 2020 to 2035
  • Table 63: East Asia Market Value (USD Billion) Forecast by Functionality, 2020 to 2035
  • Table 64: East Asia Market Volume (MT) Forecast by Functionality, 2020 to 2035
  • Table 65: East Asia Market Value (USD Billion) Forecast by Customer Orientation, 2020 to 2035
  • Table 66: East Asia Market Volume (MT) Forecast by Customer Orientation, 2020 to 2035
  • Table 67: East Asia Market Value (USD Billion) Forecast by Bacteria Type, 2020 to 2035
  • Table 68: East Asia Market Volume (MT) Forecast by Bacteria Type, 2020 to 2035
  • Table 69: East Asia Market Value (USD Billion) Forecast by CFU Count, 2020 to 2035
  • Table 70: East Asia Market Volume (MT) Forecast by CFU Count, 2020 to 2035
  • Table 71: East Asia Market Value (USD Billion) Forecast by Form, 2020 to 2035
  • Table 72: East Asia Market Volume (MT) Forecast by Form, 2020 to 2035
  • Table 73: South Asia & Pacific Market Value (USD Billion) Forecast by Country, 2020 to 2035
  • Table 74: South Asia & Pacific Market Volume (MT) Forecast by Country, 2020 to 2035
  • Table 75: South Asia & Pacific Market Value (USD Billion) Forecast by Functionality, 2020 to 2035
  • Table 76: South Asia & Pacific Market Volume (MT) Forecast by Functionality, 2020 to 2035
  • Table 77: South Asia & Pacific Market Value (USD Billion) Forecast by Customer Orientation, 2020 to 2035
  • Table 78: South Asia & Pacific Market Volume (MT) Forecast by Customer Orientation, 2020 to 2035
  • Table 79: South Asia & Pacific Market Value (USD Billion) Forecast by Bacteria Type, 2020 to 2035
  • Table 80: South Asia & Pacific Market Volume (MT) Forecast by Bacteria Type, 2020 to 2035
  • Table 81: South Asia & Pacific Market Value (USD Billion) Forecast by CFU Count, 2020 to 2035
  • Table 82: South Asia & Pacific Market Volume (MT) Forecast by CFU Count, 2020 to 2035
  • Table 83: South Asia & Pacific Market Value (USD Billion) Forecast by Form, 2020 to 2035
  • Table 84: South Asia & Pacific Market Volume (MT) Forecast by Form, 2020 to 2035
  • Table 85: MEA Market Value (USD Billion) Forecast by Country, 2020 to 2035
  • Table 86: MEA Market Volume (MT) Forecast by Country, 2020 to 2035
  • Table 87: MEA Market Value (USD Billion) Forecast by Functionality, 2020 to 2035
  • Table 88: MEA Market Volume (MT) Forecast by Functionality, 2020 to 2035
  • Table 89: MEA Market Value (USD Billion) Forecast by Customer Orientation, 2020 to 2035
  • Table 90: MEA Market Volume (MT) Forecast by Customer Orientation, 2020 to 2035
  • Table 91: MEA Market Value (USD Billion) Forecast by Bacteria Type, 2020 to 2035
  • Table 92: MEA Market Volume (MT) Forecast by Bacteria Type, 2020 to 2035
  • Table 93: MEA Market Value (USD Billion) Forecast by CFU Count, 2020 to 2035
  • Table 94: MEA Market Volume (MT) Forecast by CFU Count, 2020 to 2035
  • Table 95: MEA Market Value (USD Billion) Forecast by Form, 2020 to 2035
  • Table 96: MEA Market Volume (MT) Forecast by Form, 2020 to 2035

List of Figures

  • Figure 1: Global Market Value (USD Billion) by Functionality, 2025 to 2035
  • Figure 2: Global Market Value (USD Billion) by Customer Orientation, 2025 to 2035
  • Figure 3: Global Market Value (USD Billion) by Bacteria Type, 2025 to 2035
  • Figure 4: Global Market Value (USD Billion) by CFU Count, 2025 to 2035
  • Figure 5: Global Market Value (USD Billion) by Form, 2025 to 2035
  • Figure 6: Global Market Value (USD Billion) by Region, 2025 to 2035
  • Figure 7: Global Market Value (USD Billion) Analysis by Region, 2020 to 2035
  • Figure 8: Global Market Volume (MT) Analysis by Region, 2020 to 2035
  • Figure 9: Global Market Value Share (%) and BPS Analysis by Region, 2025 to 2035
  • Figure 10: Global Market Y-o-Y Growth (%) Projections by Region, 2025 to 2035
  • Figure 11: Global Market Value (USD Billion) Analysis by Functionality, 2020 to 2035
  • Figure 12: Global Market Volume (MT) Analysis by Functionality, 2020 to 2035
  • Figure 13: Global Market Value Share (%) and BPS Analysis by Functionality, 2025 to 2035
  • Figure 14: Global Market Y-o-Y Growth (%) Projections by Functionality, 2025 to 2035
  • Figure 15: Global Market Value (USD Billion) Analysis by Customer Orientation, 2020 to 2035
  • Figure 16: Global Market Volume (MT) Analysis by Customer Orientation, 2020 to 2035
  • Figure 17: Global Market Value Share (%) and BPS Analysis by Customer Orientation, 2025 to 2035
  • Figure 18: Global Market Y-o-Y Growth (%) Projections by Customer Orientation, 2025 to 2035
  • Figure 19: Global Market Value (USD Billion) Analysis by Bacteria Type, 2020 to 2035
  • Figure 20: Global Market Volume (MT) Analysis by Bacteria Type, 2020 to 2035
  • Figure 21: Global Market Value Share (%) and BPS Analysis by Bacteria Type, 2025 to 2035
  • Figure 22: Global Market Y-o-Y Growth (%) Projections by Bacteria Type, 2025 to 2035
  • Figure 23: Global Market Value (USD Billion) Analysis by CFU Count, 2020 to 2035
  • Figure 24: Global Market Volume (MT) Analysis by CFU Count, 2020 to 2035
  • Figure 25: Global Market Value Share (%) and BPS Analysis by CFU Count, 2025 to 2035
  • Figure 26: Global Market Y-o-Y Growth (%) Projections by CFU Count, 2025 to 2035
  • Figure 27: Global Market Value (USD Billion) Analysis by Form, 2020 to 2035
  • Figure 28: Global Market Volume (MT) Analysis by Form, 2020 to 2035
  • Figure 29: Global Market Value Share (%) and BPS Analysis by Form, 2025 to 2035
  • Figure 30: Global Market Y-o-Y Growth (%) Projections by Form, 2025 to 2035
  • Figure 31: Global Market Attractiveness by Functionality, 2025 to 2035
  • Figure 32: Global Market Attractiveness by Customer Orientation, 2025 to 2035
  • Figure 33: Global Market Attractiveness by Bacteria Type, 2025 to 2035
  • Figure 34: Global Market Attractiveness by CFU Count, 2025 to 2035
  • Figure 35: Global Market Attractiveness by Form, 2025 to 2035
  • Figure 36: Global Market Attractiveness by Region, 2025 to 2035
  • Figure 37: North America Market Value (USD Billion) by Functionality, 2025 to 2035
  • Figure 38: North America Market Value (USD Billion) by Customer Orientation, 2025 to 2035
  • Figure 39: North America Market Value (USD Billion) by Bacteria Type, 2025 to 2035
  • Figure 40: North America Market Value (USD Billion) by CFU Count, 2025 to 2035
  • Figure 41: North America Market Value (USD Billion) by Form, 2025 to 2035
  • Figure 42: North America Market Value (USD Billion) by Country, 2025 to 2035
  • Figure 43: North America Market Value (USD Billion) Analysis by Country, 2020 to 2035
  • Figure 44: North America Market Volume (MT) Analysis by Country, 2020 to 2035
  • Figure 45: North America Market Value Share (%) and BPS Analysis by Country, 2025 to 2035
  • Figure 46: North America Market Y-o-Y Growth (%) Projections by Country, 2025 to 2035
  • Figure 47: North America Market Value (USD Billion) Analysis by Functionality, 2020 to 2035
  • Figure 48: North America Market Volume (MT) Analysis by Functionality, 2020 to 2035
  • Figure 49: North America Market Value Share (%) and BPS Analysis by Functionality, 2025 to 2035
  • Figure 50: North America Market Y-o-Y Growth (%) Projections by Functionality, 2025 to 2035
  • Figure 51: North America Market Value (USD Billion) Analysis by Customer Orientation, 2020 to 2035
  • Figure 52: North America Market Volume (MT) Analysis by Customer Orientation, 2020 to 2035
  • Figure 53: North America Market Value Share (%) and BPS Analysis by Customer Orientation, 2025 to 2035
  • Figure 54: North America Market Y-o-Y Growth (%) Projections by Customer Orientation, 2025 to 2035
  • Figure 55: North America Market Value (USD Billion) Analysis by Bacteria Type, 2020 to 2035
  • Figure 56: North America Market Volume (MT) Analysis by Bacteria Type, 2020 to 2035
  • Figure 57: North America Market Value Share (%) and BPS Analysis by Bacteria Type, 2025 to 2035
  • Figure 58: North America Market Y-o-Y Growth (%) Projections by Bacteria Type, 2025 to 2035
  • Figure 59: North America Market Value (USD Billion) Analysis by CFU Count, 2020 to 2035
  • Figure 60: North America Market Volume (MT) Analysis by CFU Count, 2020 to 2035
  • Figure 61: North America Market Value Share (%) and BPS Analysis by CFU Count, 2025 to 2035
  • Figure 62: North America Market Y-o-Y Growth (%) Projections by CFU Count, 2025 to 2035
  • Figure 63: North America Market Value (USD Billion) Analysis by Form, 2020 to 2035
  • Figure 64: North America Market Volume (MT) Analysis by Form, 2020 to 2035
  • Figure 65: North America Market Value Share (%) and BPS Analysis by Form, 2025 to 2035
  • Figure 66: North America Market Y-o-Y Growth (%) Projections by Form, 2025 to 2035
  • Figure 67: North America Market Attractiveness by Functionality, 2025 to 2035
  • Figure 68: North America Market Attractiveness by Customer Orientation, 2025 to 2035
  • Figure 69: North America Market Attractiveness by Bacteria Type, 2025 to 2035
  • Figure 70: North America Market Attractiveness by CFU Count, 2025 to 2035
  • Figure 71: North America Market Attractiveness by Form, 2025 to 2035
  • Figure 72: North America Market Attractiveness by Country, 2025 to 2035
  • Figure 73: Latin America Market Value (USD Billion) by Functionality, 2025 to 2035
  • Figure 74: Latin America Market Value (USD Billion) by Customer Orientation, 2025 to 2035
  • Figure 75: Latin America Market Value (USD Billion) by Bacteria Type, 2025 to 2035
  • Figure 76: Latin America Market Value (USD Billion) by CFU Count, 2025 to 2035
  • Figure 77: Latin America Market Value (USD Billion) by Form, 2025 to 2035
  • Figure 78: Latin America Market Value (USD Billion) by Country, 2025 to 2035
  • Figure 79: Latin America Market Value (USD Billion) Analysis by Country, 2020 to 2035
  • Figure 80: Latin America Market Volume (MT) Analysis by Country, 2020 to 2035
  • Figure 81: Latin America Market Value Share (%) and BPS Analysis by Country, 2025 to 2035
  • Figure 82: Latin America Market Y-o-Y Growth (%) Projections by Country, 2025 to 2035
  • Figure 83: Latin America Market Value (USD Billion) Analysis by Functionality, 2020 to 2035
  • Figure 84: Latin America Market Volume (MT) Analysis by Functionality, 2020 to 2035
  • Figure 85: Latin America Market Value Share (%) and BPS Analysis by Functionality, 2025 to 2035
  • Figure 86: Latin America Market Y-o-Y Growth (%) Projections by Functionality, 2025 to 2035
  • Figure 87: Latin America Market Value (USD Billion) Analysis by Customer Orientation, 2020 to 2035
  • Figure 88: Latin America Market Volume (MT) Analysis by Customer Orientation, 2020 to 2035
  • Figure 89: Latin America Market Value Share (%) and BPS Analysis by Customer Orientation, 2025 to 2035
  • Figure 90: Latin America Market Y-o-Y Growth (%) Projections by Customer Orientation, 2025 to 2035
  • Figure 91: Latin America Market Value (USD Billion) Analysis by Bacteria Type, 2020 to 2035
  • Figure 92: Latin America Market Volume (MT) Analysis by Bacteria Type, 2020 to 2035
  • Figure 93: Latin America Market Value Share (%) and BPS Analysis by Bacteria Type, 2025 to 2035
  • Figure 94: Latin America Market Y-o-Y Growth (%) Projections by Bacteria Type, 2025 to 2035
  • Figure 95: Latin America Market Value (USD Billion) Analysis by CFU Count, 2020 to 2035
  • Figure 96: Latin America Market Volume (MT) Analysis by CFU Count, 2020 to 2035
  • Figure 97: Latin America Market Value Share (%) and BPS Analysis by CFU Count, 2025 to 2035
  • Figure 98: Latin America Market Y-o-Y Growth (%) Projections by CFU Count, 2025 to 2035
  • Figure 99: Latin America Market Value (USD Billion) Analysis by Form, 2020 to 2035
  • Figure 100: Latin America Market Volume (MT) Analysis by Form, 2020 to 2035
  • Figure 101: Latin America Market Value Share (%) and BPS Analysis by Form, 2025 to 2035
  • Figure 102: Latin America Market Y-o-Y Growth (%) Projections by Form, 2025 to 2035
  • Figure 103: Latin America Market Attractiveness by Functionality, 2025 to 2035
  • Figure 104: Latin America Market Attractiveness by Customer Orientation, 2025 to 2035
  • Figure 105: Latin America Market Attractiveness by Bacteria Type, 2025 to 2035
  • Figure 106: Latin America Market Attractiveness by CFU Count, 2025 to 2035
  • Figure 107: Latin America Market Attractiveness by Form, 2025 to 2035
  • Figure 108: Latin America Market Attractiveness by Country, 2025 to 2035
  • Figure 109: Western Europe Market Value (USD Billion) by Functionality, 2025 to 2035
  • Figure 110: Western Europe Market Value (USD Billion) by Customer Orientation, 2025 to 2035
  • Figure 111: Western Europe Market Value (USD Billion) by Bacteria Type, 2025 to 2035
  • Figure 112: Western Europe Market Value (USD Billion) by CFU Count, 2025 to 2035
  • Figure 113: Western Europe Market Value (USD Billion) by Form, 2025 to 2035
  • Figure 114: Western Europe Market Value (USD Billion) by Country, 2025 to 2035
  • Figure 115: Western Europe Market Value (USD Billion) Analysis by Country, 2020 to 2035
  • Figure 116: Western Europe Market Volume (MT) Analysis by Country, 2020 to 2035
  • Figure 117: Western Europe Market Value Share (%) and BPS Analysis by Country, 2025 to 2035
  • Figure 118: Western Europe Market Y-o-Y Growth (%) Projections by Country, 2025 to 2035
  • Figure 119: Western Europe Market Value (USD Billion) Analysis by Functionality, 2020 to 2035
  • Figure 120: Western Europe Market Volume (MT) Analysis by Functionality, 2020 to 2035
  • Figure 121: Western Europe Market Value Share (%) and BPS Analysis by Functionality, 2025 to 2035
  • Figure 122: Western Europe Market Y-o-Y Growth (%) Projections by Functionality, 2025 to 2035
  • Figure 123: Western Europe Market Value (USD Billion) Analysis by Customer Orientation, 2020 to 2035
  • Figure 124: Western Europe Market Volume (MT) Analysis by Customer Orientation, 2020 to 2035
  • Figure 125: Western Europe Market Value Share (%) and BPS Analysis by Customer Orientation, 2025 to 2035
  • Figure 126: Western Europe Market Y-o-Y Growth (%) Projections by Customer Orientation, 2025 to 2035
  • Figure 127: Western Europe Market Value (USD Billion) Analysis by Bacteria Type, 2020 to 2035
  • Figure 128: Western Europe Market Volume (MT) Analysis by Bacteria Type, 2020 to 2035
  • Figure 129: Western Europe Market Value Share (%) and BPS Analysis by Bacteria Type, 2025 to 2035
  • Figure 130: Western Europe Market Y-o-Y Growth (%) Projections by Bacteria Type, 2025 to 2035
  • Figure 131: Western Europe Market Value (USD Billion) Analysis by CFU Count, 2020 to 2035
  • Figure 132: Western Europe Market Volume (MT) Analysis by CFU Count, 2020 to 2035
  • Figure 133: Western Europe Market Value Share (%) and BPS Analysis by CFU Count, 2025 to 2035
  • Figure 134: Western Europe Market Y-o-Y Growth (%) Projections by CFU Count, 2025 to 2035
  • Figure 135: Western Europe Market Value (USD Billion) Analysis by Form, 2020 to 2035
  • Figure 136: Western Europe Market Volume (MT) Analysis by Form, 2020 to 2035
  • Figure 137: Western Europe Market Value Share (%) and BPS Analysis by Form, 2025 to 2035
  • Figure 138: Western Europe Market Y-o-Y Growth (%) Projections by Form, 2025 to 2035
  • Figure 139: Western Europe Market Attractiveness by Functionality, 2025 to 2035
  • Figure 140: Western Europe Market Attractiveness by Customer Orientation, 2025 to 2035
  • Figure 141: Western Europe Market Attractiveness by Bacteria Type, 2025 to 2035
  • Figure 142: Western Europe Market Attractiveness by CFU Count, 2025 to 2035
  • Figure 143: Western Europe Market Attractiveness by Form, 2025 to 2035
  • Figure 144: Western Europe Market Attractiveness by Country, 2025 to 2035
  • Figure 145: Eastern Europe Market Value (USD Billion) by Functionality, 2025 to 2035
  • Figure 146: Eastern Europe Market Value (USD Billion) by Customer Orientation, 2025 to 2035
  • Figure 147: Eastern Europe Market Value (USD Billion) by Bacteria Type, 2025 to 2035
  • Figure 148: Eastern Europe Market Value (USD Billion) by CFU Count, 2025 to 2035
  • Figure 149: Eastern Europe Market Value (USD Billion) by Form, 2025 to 2035
  • Figure 150: Eastern Europe Market Value (USD Billion) by Country, 2025 to 2035
  • Figure 151: Eastern Europe Market Value (USD Billion) Analysis by Country, 2020 to 2035
  • Figure 152: Eastern Europe Market Volume (MT) Analysis by Country, 2020 to 2035
  • Figure 153: Eastern Europe Market Value Share (%) and BPS Analysis by Country, 2025 to 2035
  • Figure 154: Eastern Europe Market Y-o-Y Growth (%) Projections by Country, 2025 to 2035
  • Figure 155: Eastern Europe Market Value (USD Billion) Analysis by Functionality, 2020 to 2035
  • Figure 156: Eastern Europe Market Volume (MT) Analysis by Functionality, 2020 to 2035
  • Figure 157: Eastern Europe Market Value Share (%) and BPS Analysis by Functionality, 2025 to 2035
  • Figure 158: Eastern Europe Market Y-o-Y Growth (%) Projections by Functionality, 2025 to 2035
  • Figure 159: Eastern Europe Market Value (USD Billion) Analysis by Customer Orientation, 2020 to 2035
  • Figure 160: Eastern Europe Market Volume (MT) Analysis by Customer Orientation, 2020 to 2035
  • Figure 161: Eastern Europe Market Value Share (%) and BPS Analysis by Customer Orientation, 2025 to 2035
  • Figure 162: Eastern Europe Market Y-o-Y Growth (%) Projections by Customer Orientation, 2025 to 2035
  • Figure 163: Eastern Europe Market Value (USD Billion) Analysis by Bacteria Type, 2020 to 2035
  • Figure 164: Eastern Europe Market Volume (MT) Analysis by Bacteria Type, 2020 to 2035
  • Figure 165: Eastern Europe Market Value Share (%) and BPS Analysis by Bacteria Type, 2025 to 2035
  • Figure 166: Eastern Europe Market Y-o-Y Growth (%) Projections by Bacteria Type, 2025 to 2035
  • Figure 167: Eastern Europe Market Value (USD Billion) Analysis by CFU Count, 2020 to 2035
  • Figure 168: Eastern Europe Market Volume (MT) Analysis by CFU Count, 2020 to 2035
  • Figure 169: Eastern Europe Market Value Share (%) and BPS Analysis by CFU Count, 2025 to 2035
  • Figure 170: Eastern Europe Market Y-o-Y Growth (%) Projections by CFU Count, 2025 to 2035
  • Figure 171: Eastern Europe Market Value (USD Billion) Analysis by Form, 2020 to 2035
  • Figure 172: Eastern Europe Market Volume (MT) Analysis by Form, 2020 to 2035
  • Figure 173: Eastern Europe Market Value Share (%) and BPS Analysis by Form, 2025 to 2035
  • Figure 174: Eastern Europe Market Y-o-Y Growth (%) Projections by Form, 2025 to 2035
  • Figure 175: Eastern Europe Market Attractiveness by Functionality, 2025 to 2035
  • Figure 176: Eastern Europe Market Attractiveness by Customer Orientation, 2025 to 2035
  • Figure 177: Eastern Europe Market Attractiveness by Bacteria Type, 2025 to 2035
  • Figure 178: Eastern Europe Market Attractiveness by CFU Count, 2025 to 2035
  • Figure 179: Eastern Europe Market Attractiveness by Form, 2025 to 2035
  • Figure 180: Eastern Europe Market Attractiveness by Country, 2025 to 2035
  • Figure 181: East Asia Market Value (USD Billion) by Functionality, 2025 to 2035
  • Figure 182: East Asia Market Value (USD Billion) by Customer Orientation, 2025 to 2035
  • Figure 183: East Asia Market Value (USD Billion) by Bacteria Type, 2025 to 2035
  • Figure 184: East Asia Market Value (USD Billion) by CFU Count, 2025 to 2035
  • Figure 185: East Asia Market Value (USD Billion) by Form, 2025 to 2035
  • Figure 186: East Asia Market Value (USD Billion) by Country, 2025 to 2035
  • Figure 187: East Asia Market Value (USD Billion) Analysis by Country, 2020 to 2035
  • Figure 188: East Asia Market Volume (MT) Analysis by Country, 2020 to 2035
  • Figure 189: East Asia Market Value Share (%) and BPS Analysis by Country, 2025 to 2035
  • Figure 190: East Asia Market Y-o-Y Growth (%) Projections by Country, 2025 to 2035
  • Figure 191: East Asia Market Value (USD Billion) Analysis by Functionality, 2020 to 2035
  • Figure 192: East Asia Market Volume (MT) Analysis by Functionality, 2020 to 2035
  • Figure 193: East Asia Market Value Share (%) and BPS Analysis by Functionality, 2025 to 2035
  • Figure 194: East Asia Market Y-o-Y Growth (%) Projections by Functionality, 2025 to 2035
  • Figure 195: East Asia Market Value (USD Billion) Analysis by Customer Orientation, 2020 to 2035
  • Figure 196: East Asia Market Volume (MT) Analysis by Customer Orientation, 2020 to 2035
  • Figure 197: East Asia Market Value Share (%) and BPS Analysis by Customer Orientation, 2025 to 2035
  • Figure 198: East Asia Market Y-o-Y Growth (%) Projections by Customer Orientation, 2025 to 2035
  • Figure 199: East Asia Market Value (USD Billion) Analysis by Bacteria Type, 2020 to 2035
  • Figure 200: East Asia Market Volume (MT) Analysis by Bacteria Type, 2020 to 2035
  • Figure 201: East Asia Market Value Share (%) and BPS Analysis by Bacteria Type, 2025 to 2035
  • Figure 202: East Asia Market Y-o-Y Growth (%) Projections by Bacteria Type, 2025 to 2035
  • Figure 203: East Asia Market Value (USD Billion) Analysis by CFU Count, 2020 to 2035
  • Figure 204: East Asia Market Volume (MT) Analysis by CFU Count, 2020 to 2035
  • Figure 205: East Asia Market Value Share (%) and BPS Analysis by CFU Count, 2025 to 2035
  • Figure 206: East Asia Market Y-o-Y Growth (%) Projections by CFU Count, 2025 to 2035
  • Figure 207: East Asia Market Value (USD Billion) Analysis by Form, 2020 to 2035
  • Figure 208: East Asia Market Volume (MT) Analysis by Form, 2020 to 2035
  • Figure 209: East Asia Market Value Share (%) and BPS Analysis by Form, 2025 to 2035
  • Figure 210: East Asia Market Y-o-Y Growth (%) Projections by Form, 2025 to 2035
  • Figure 211: East Asia Market Attractiveness by Functionality, 2025 to 2035
  • Figure 212: East Asia Market Attractiveness by Customer Orientation, 2025 to 2035
  • Figure 213: East Asia Market Attractiveness by Bacteria Type, 2025 to 2035
  • Figure 214: East Asia Market Attractiveness by CFU Count, 2025 to 2035
  • Figure 215: East Asia Market Attractiveness by Form, 2025 to 2035
  • Figure 216: East Asia Market Attractiveness by Country, 2025 to 2035
  • Figure 217: South Asia & Pacific Market Value (USD Billion) by Functionality, 2025 to 2035
  • Figure 218: South Asia & Pacific Market Value (USD Billion) by Customer Orientation, 2025 to 2035
  • Figure 219: South Asia & Pacific Market Value (USD Billion) by Bacteria Type, 2025 to 2035
  • Figure 220: South Asia & Pacific Market Value (USD Billion) by CFU Count, 2025 to 2035
  • Figure 221: South Asia & Pacific Market Value (USD Billion) by Form, 2025 to 2035
  • Figure 222: South Asia & Pacific Market Value (USD Billion) by Country, 2025 to 2035
  • Figure 223: South Asia & Pacific Market Value (USD Billion) Analysis by Country, 2020 to 2035
  • Figure 224: South Asia & Pacific Market Volume (MT) Analysis by Country, 2020 to 2035
  • Figure 225: South Asia & Pacific Market Value Share (%) and BPS Analysis by Country, 2025 to 2035
  • Figure 226: South Asia & Pacific Market Y-o-Y Growth (%) Projections by Country, 2025 to 2035
  • Figure 227: South Asia & Pacific Market Value (USD Billion) Analysis by Functionality, 2020 to 2035
  • Figure 228: South Asia & Pacific Market Volume (MT) Analysis by Functionality, 2020 to 2035
  • Figure 229: South Asia & Pacific Market Value Share (%) and BPS Analysis by Functionality, 2025 to 2035
  • Figure 230: South Asia & Pacific Market Y-o-Y Growth (%) Projections by Functionality, 2025 to 2035
  • Figure 231: South Asia & Pacific Market Value (USD Billion) Analysis by Customer Orientation, 2020 to 2035
  • Figure 232: South Asia & Pacific Market Volume (MT) Analysis by Customer Orientation, 2020 to 2035
  • Figure 233: South Asia & Pacific Market Value Share (%) and BPS Analysis by Customer Orientation, 2025 to 2035
  • Figure 234: South Asia & Pacific Market Y-o-Y Growth (%) Projections by Customer Orientation, 2025 to 2035
  • Figure 235: South Asia & Pacific Market Value (USD Billion) Analysis by Bacteria Type, 2020 to 2035
  • Figure 236: South Asia & Pacific Market Volume (MT) Analysis by Bacteria Type, 2020 to 2035
  • Figure 237: South Asia & Pacific Market Value Share (%) and BPS Analysis by Bacteria Type, 2025 to 2035
  • Figure 238: South Asia & Pacific Market Y-o-Y Growth (%) Projections by Bacteria Type, 2025 to 2035
  • Figure 239: South Asia & Pacific Market Value (USD Billion) Analysis by CFU Count, 2020 to 2035
  • Figure 240: South Asia & Pacific Market Volume (MT) Analysis by CFU Count, 2020 to 2035
  • Figure 241: South Asia & Pacific Market Value Share (%) and BPS Analysis by CFU Count, 2025 to 2035
  • Figure 242: South Asia & Pacific Market Y-o-Y Growth (%) Projections by CFU Count, 2025 to 2035
  • Figure 243: South Asia & Pacific Market Value (USD Billion) Analysis by Form, 2020 to 2035
  • Figure 244: South Asia & Pacific Market Volume (MT) Analysis by Form, 2020 to 2035
  • Figure 245: South Asia & Pacific Market Value Share (%) and BPS Analysis by Form, 2025 to 2035
  • Figure 246: South Asia & Pacific Market Y-o-Y Growth (%) Projections by Form, 2025 to 2035
  • Figure 247: South Asia & Pacific Market Attractiveness by Functionality, 2025 to 2035
  • Figure 248: South Asia & Pacific Market Attractiveness by Customer Orientation, 2025 to 2035
  • Figure 249: South Asia & Pacific Market Attractiveness by Bacteria Type, 2025 to 2035
  • Figure 250: South Asia & Pacific Market Attractiveness by CFU Count, 2025 to 2035
  • Figure 251: South Asia & Pacific Market Attractiveness by Form, 2025 to 2035
  • Figure 252: South Asia & Pacific Market Attractiveness by Country, 2025 to 2035
  • Figure 253: MEA Market Value (USD Billion) by Functionality, 2025 to 2035
  • Figure 254: MEA Market Value (USD Billion) by Customer Orientation, 2025 to 2035
  • Figure 255: MEA Market Value (USD Billion) by Bacteria Type, 2025 to 2035
  • Figure 256: MEA Market Value (USD Billion) by CFU Count, 2025 to 2035
  • Figure 257: MEA Market Value (USD Billion) by Form, 2025 to 2035
  • Figure 258: MEA Market Value (USD Billion) by Country, 2025 to 2035
  • Figure 259: MEA Market Value (USD Billion) Analysis by Country, 2020 to 2035
  • Figure 260: MEA Market Volume (MT) Analysis by Country, 2020 to 2035
  • Figure 261: MEA Market Value Share (%) and BPS Analysis by Country, 2025 to 2035
  • Figure 262: MEA Market Y-o-Y Growth (%) Projections by Country, 2025 to 2035
  • Figure 263: MEA Market Value (USD Billion) Analysis by Functionality, 2020 to 2035
  • Figure 264: MEA Market Volume (MT) Analysis by Functionality, 2020 to 2035
  • Figure 265: MEA Market Value Share (%) and BPS Analysis by Functionality, 2025 to 2035
  • Figure 266: MEA Market Y-o-Y Growth (%) Projections by Functionality, 2025 to 2035
  • Figure 267: MEA Market Value (USD Billion) Analysis by Customer Orientation, 2020 to 2035
  • Figure 268: MEA Market Volume (MT) Analysis by Customer Orientation, 2020 to 2035
  • Figure 269: MEA Market Value Share (%) and BPS Analysis by Customer Orientation, 2025 to 2035
  • Figure 270: MEA Market Y-o-Y Growth (%) Projections by Customer Orientation, 2025 to 2035
  • Figure 271: MEA Market Value (USD Billion) Analysis by Bacteria Type, 2020 to 2035
  • Figure 272: MEA Market Volume (MT) Analysis by Bacteria Type, 2020 to 2035
  • Figure 273: MEA Market Value Share (%) and BPS Analysis by Bacteria Type, 2025 to 2035
  • Figure 274: MEA Market Y-o-Y Growth (%) Projections by Bacteria Type, 2025 to 2035
  • Figure 275: MEA Market Value (USD Billion) Analysis by CFU Count, 2020 to 2035
  • Figure 276: MEA Market Volume (MT) Analysis by CFU Count, 2020 to 2035
  • Figure 277: MEA Market Value Share (%) and BPS Analysis by CFU Count, 2025 to 2035
  • Figure 278: MEA Market Y-o-Y Growth (%) Projections by CFU Count, 2025 to 2035
  • Figure 279: MEA Market Value (USD Billion) Analysis by Form, 2020 to 2035
  • Figure 280: MEA Market Volume (MT) Analysis by Form, 2020 to 2035
  • Figure 281: MEA Market Value Share (%) and BPS Analysis by Form, 2025 to 2035
  • Figure 282: MEA Market Y-o-Y Growth (%) Projections by Form, 2025 to 2035
  • Figure 283: MEA Market Attractiveness by Functionality, 2025 to 2035
  • Figure 284: MEA Market Attractiveness by Customer Orientation, 2025 to 2035
  • Figure 285: MEA Market Attractiveness by Bacteria Type, 2025 to 2035
  • Figure 286: MEA Market Attractiveness by CFU Count, 2025 to 2035
  • Figure 287: MEA Market Attractiveness by Form, 2025 to 2035
  • Figure 288: MEA Market Attractiveness by Country, 2025 to 2035

Frequently Asked Questions

What is the projected market size of probiotic supplements in 2025?

The global probiotic supplements market is expected to reach USD 13.50 billion in 2025.

What is the projected market size of probiotic supplements by 2035?

By 2035, the probiotic supplements market is projected to grow to USD 34.08 billion.

What is the expected CAGR for the probiotic supplements market from 2025 to 2035?

The market is expected to grow at a CAGR of 9.7% from 2025 to 2035.

Which customer orientation segment will dominate the probiotic supplements market?

Digestive health will dominate the customer orientation segment, holding a 38% market share.

Which country is expected to experience the highest growth in the probiotic supplements market?

India is projected to be the fastest-growing country, with a CAGR of 12.1%.

Explore Similar Insights

Future Market Insights

Probiotic Supplements Market