Probiotic Chewing Gum Market Size and Share Forecast Outlook (2024 to 2034)

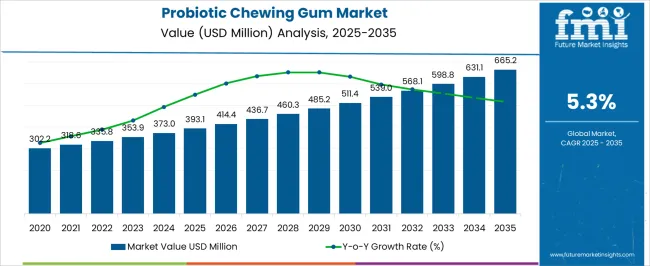
The global probiotic chewing gum market size is expected to increase from USD 373.0 million in 2024 to USD 629.0 million by 2034. By 2034, the probiotic chewing gum market is projected to rise at 5.4% CAGR.

Attributes Key Insights
Estimated Global Probiotic Chewing Gum Market Size (2024E) USD 373.0 million
Projected Probiotic Chewing Gum Market Value (2034F) USD 629.0 million
Value-based CAGR (2024 to 2034) 5.4%

The probiotic chewing gum market is set to be driven by increasing awareness of the significance of digestive and gut health well-being. Customers are increasingly seeking suitable and enjoyable techniques to incorporate probiotics into their routines. Key players are hence focusing on launching innovative chewing gums.

  • For instance, CulturedCare (BLIS Probiotics) is a naturally flavored probiotic chewing gum sweetened with xylitol, which helps improve oral health and fight bad smells. CulturedCare is an effective oral probiotic that can recolonize the oral cavity after antibiotic treatment.

As consumers become more conscious of well-being and find ways to improve their overall health, products that offer oral and digestive health benefits are becoming more important. Probiotics are known for their positive effects on gut health, and incorporating them into a convenient form like chewing gum appeals to health-conscious consumers.

Probiotic chewing gum is being used to help smokers improve their oral health. The growing popularity of probiotic chewing gums for curing health conditions is expected to be a key factor driving the market. Leading manufacturers are expanding their product lines to include a wide range of probiotic chewing gum products.

Sales Analysis of Probiotic Chewing Gum (2019 to 2023) vs Forecast (2024 to 2034)

The probiotic chewing gum market grew at a CAGR of 5.1% from 2019 to 2023. By 2034, the worldwide market for probiotic chewing gums is predicted to surge at 5.4% CAGR. Factors responsible for pushing probiotic chewing gum sales include:

  • There has been a notable rise in consumer interest in and awareness of probiotics.
  • Probiotics have become popular in a variety of forms, such as dairy products, functional foods, and supplements, due to their potential health advantages.
  • The idea of functional foods and drinks with health advantages over and beyond those of basic sustenance has gained popularity.
  • Due to consumers' growing need for goods that support health and well-being, functional ingredients like probiotics are being incorporated into a wide range of food & beverage categories.
  • Technological and formulation advances have contributed to increased probiotic viability and stability in a range of products, including chewing gum. These developments have probably helped probiotic chewing gums become a commercially successful product.
  • Increasing awareness among consumers about the importance of maintaining good health and overall wellness has increased the demand for probiotic chewing gums.
  • Its ability to offer additional benefits beyond traditional gum and its potential benefits in supporting detoxification, immune function, and stress management have gained attention. This has led to a high demand for probiotic chewing gums, making it a popular choice among consumers.

Key Trends Reshaping the Probiotic Chewing Gum Industry

Product Innovations and Health Awareness to be Key Trends in the Market
  • Rising demand for sustainable oral care products is set to boost sales of probiotic chewing gums.
  • Growing awareness of the potential benefits of probiotics for gum health is estimated to aid demand.
  • Increasing consumer awareness about the relationship between health and nutrition is projected to drive growth.
  • Surging sales of probiotic chewing gums through pharmacies and online platforms are projected to boost market revenues.
  • Expansion of probiotic research and innovations in oral microbiome studies is anticipated to foster demand.

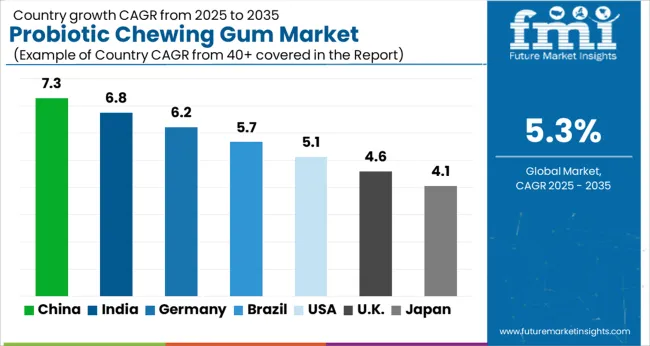
Analysis of Top Countries Formulating, Packaging, and Selling Probiotic Chewing Gum

The table below shows the estimated growth rates of the top five countries. The United States, China, and Japan are set to record high CAGRs of 5.6%, 5.0%, and 6.1%, respectively, through 2034.

Countries CAGR (2024 to 2034)
United States 5.6%
Germany 3.4%
Japan 6.1%
Australia 4.0%
China 5.0%

Health-conscious Consumers in the United States to Drive Demand

The United States is projected to surge at a CAGR of 5.6% through 2034. Emerging patterns in the market are as follows:
  • Consumers in the United States are seeking quick and easy solutions for well-being; chewing gum with convenience offers health benefits, which is gaining popularity.
  • In the United States, ongoing efforts are being taken to reduce smoking rates. Probiotic gums are the solutions to help individuals quit or reduce smoking, surging probiotic chewing gum demand.
  • Consumers are becoming more health conscious as they seek ways to support their overall health. Probiotic products that promote one’s health, provide protection from infections, and enhance quality of life are gaining traction in the market.
  • The rising popularity of chewing gums with probiotics among health-conscious consumers is expected to boost the United States market.
  • Probiotic chewing gum products are broadly available in supermarkets and online stores. This makes it easy for consumers to shop, thereby boosting probiotic chewing gum sales.

Availability of Products at Competitive Prices Elevating Sales in Germany

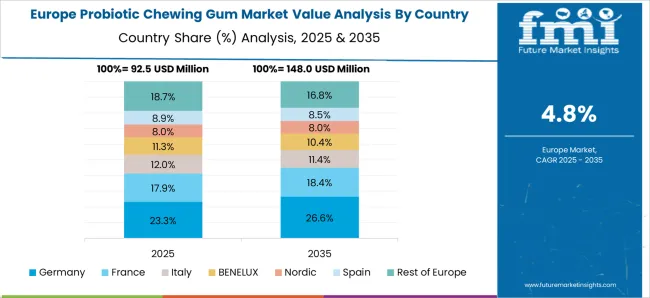
Sales of probiotic chewing gums are projected to increase in Germany at a CAGR of 3.4% through 2034. The factors driving the market growth are as follows:

  • Probiotic chewing gum is in great demand in Germany due to rising awareness among consumers about the importance of maintaining good health.
  • Manufacturers are investing significantly in modern manufacturing facilities, advanced technology, and skilled labor. This increases the efficiency of producing probiotic-infused gums and lowers production costs.

Rising Disposable Income in China to Surge Demand Through 2034

The demand for probiotic chewing gums is increasing in China, with a projected CAGR of 5.0% through 2034. Emerging patterns in China’s market are as follows:
  • Chewing gum and other probiotic products that support a healthy gut microbiome are expected to find a market in light of the increasing awareness of the significance of digestive health.
  • High disposable income and the growing middle-class in China are expected to lead to a high willingness among consumers to spend money on goods that promote health and wellness, including functional chewing gums.

Booming E-commerce Sector Propelling Demand in Japan

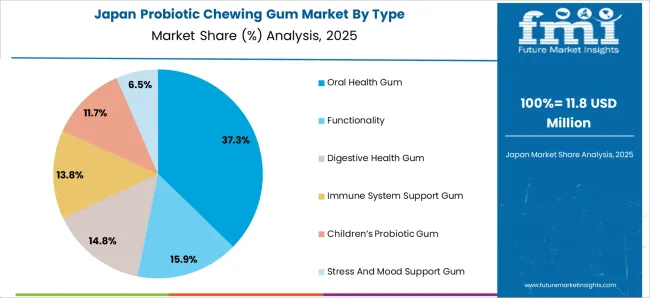
Japan is projected to rise at a 6.1% CAGR through 2034. The factors driving the market’s growth are as follows:

  • The retail scene in Japan is changing due to the growth of e-commerce. Probiotic chewing gum manufacturers are using internet channels to connect with a large number of customers, particularly in light of the nation's e-commerce boom.
  • Developing marketing techniques that speak to the cultural values and tastes of the target market is increasing the adoption of probiotic chewing gums in Japan.

Australia-based Market Players to Witness Lucrative Growth

Australia's probiotic chewing gum market is expected to increase at 4.0% CAGR through 2034. The factors responsible for this growth are as follows:

  • The market for probiotic chewing gums with sugar-free or natural sweetener formulations is driven by consumer desires for healthy products. To appeal to consumers who are health-conscious, manufacturers are striving to discover substitutes to sweeteners in the market.
  • Manufacturers in Australia are concentrating on making sure that the quality and safety criteria of their probiotic chewing gums are met and regulations are followed.

Probiotic Chewing Gum Industry Analysis by Top Investment Segments

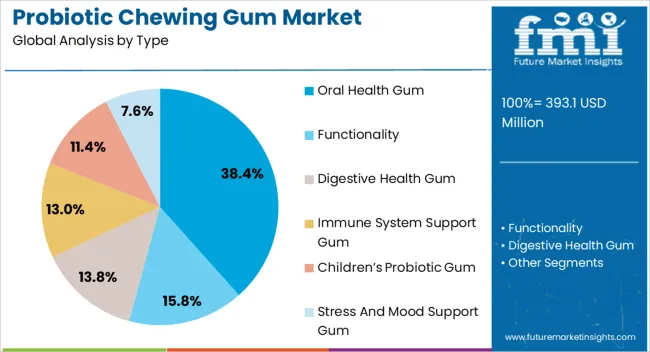
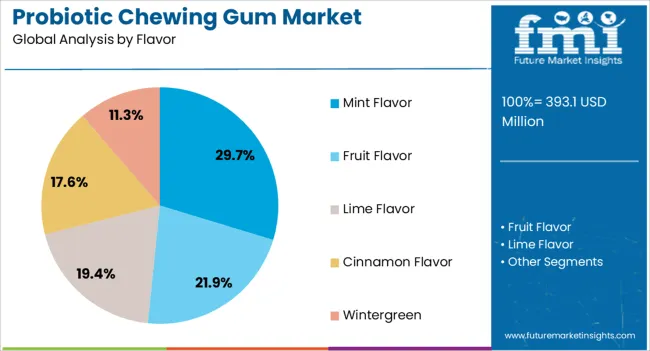
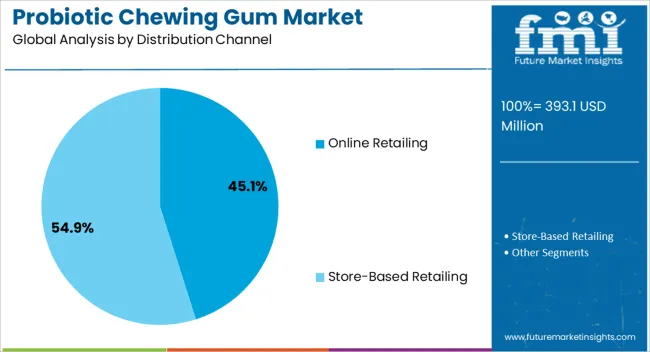
The section below shows the digestive health gum segment dominating by functionality. It is predicted to hold a market share of 23% in 2024. Based on the distribution channel, the pharmacy segment is anticipated to generate a dominant share through 2024. It is set to hold a share of 21% in 2024.

Segment Market Share (2024)
Digestive Health Gum (Functionality) 23%
Mint Flavor (Flavor) 20%
Pharmacies (Distribution Channel) 21%

Demand in the Market to Remain High for Digestive Health Gums

Based on functionality, demand for digestive health gums is expected to remain high, with a market share of around 23% in 2024. The following factors are projected to support demand:
  • Researchers have found that healthy bacteria in chewing gums can prevent and treat oral diseases such as pulpitis, periodontitis, gingivitis, and stomatitis.
  • Probiotic chewing gum is in high demand due to its potential digestive health benefits.
  • Including beneficial bacteria in the gum formulation helps to support a healthy gut microbiome, aid digestion, and alleviate symptoms such as bloating and irregular bowel movements.
  • Consumers are adopting preventive measures to maintain optimal digestive health.
  • They are incorporating probiotics into their daily routine through probiotic chewing gums.
  • The portability and ease of probiotic chewing gum make it an attractive option for individuals who are always on the move.
  • It provides a convenient way to supplement gut health, allowing consumers to prioritize their digestive well-being in a busy lifestyle.

Pharmacies and Drugstores Segment Continues to Dominate the Market

  • Pharmacies and drugstores are key distribution channels in the probiotic chewing gum market.
  • Pharmacies offer a trusted and convenient shopping experience, making them a preferred choice for buying probiotic chewing gum, especially for those looking for digestive or oral health gum products.
  • Pharmacies provide a unique advantage in offering expert oral and digestive health advice.
  • Pharmacists and pharmacy staff are knowledgeable about several health conditions. They can guide customers in selecting the most suitable probiotic chewing gum based on their needs, such as addressing digestive issues or promoting oral health.
  • Pharmacies are widely accessible, with several locations in local communities or healthcare facilities. This convenience makes it easy for consumers to purchase probiotic chewing gum during their regular visits to the pharmacy for other health-related needs.

Competitive Landscape of the Probiotic Chewing Gum Market

Leading players are introducing novel products to meet consumer demand. They also employ tactics including partnerships, distribution agreements, mergers & acquisitions, collaborations, and advertising to gain a competitive edge in the market.

To meet the increasing demand, key players are introducing new sugar-free products onto the market. Companies are also releasing chewing gums in several flavors to capture a large market share.

For instance,

  • In July 2020, Trident Gum launched a contest named #ChewTunes. In this, an augmented reality (AR) filter surrounds the brand’s new limited-edition Chew Tunes packets, inviting customers to build their beat.
  • In March 2022, the Liquid CORE Gum Company launched FLATLINER gum containing 130 g of caffeine. The manufacturer states that its chewing gum is free of sugar, gluten, and dairy. It contains only natural flavors and beneficial components.
  • In June 2021, Perfetti Van Melle announced an update to its Mentos Pure Fresh Gum packaging. According to the manufacturer, 90% of the packaging is made of paperboard and is recyclable.

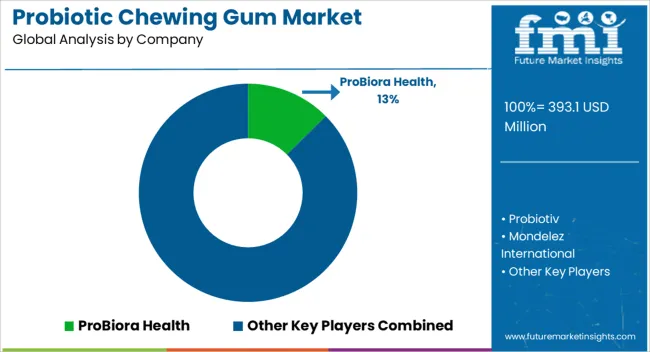
Leading Companies Profiled in the Probiotic Chewing Gum Industry

  • Probiotiv
  • Mondelez International
  • Cafosa
  • Art of Nature
  • Prairie Naturals
  • Strapharm
  • ProBiora Health
  • TopGum Industries Ltd.
  • ZOFT Gum Company
  • BLIS Probiotics
  • Bluestone Pharma

Top Segments Studied in the Probiotic Chewing Gum Market

By Functionality:

  • Digestive Health Gum
  • Oral Health Gum
  • Immune System Support Gum
  • Children's Probiotic Gum
  • Stress and Mood Support Gum

By Flavor:

  • Mint Flavor
    • Spearmint
    • Peppermint
  • Fruit Flavor
  • Lime Flavor
  • Cinnamon Flavor
  • Wintergreen

By Distribution Channel:

  • Store-based Retailing
    • Hypermarkets/Supermarkets
    • Conventional Stores
    • Pharmacies and Drugstores
    • Independent Small Groceries
  • Online Retailing

By Region:

  • North America
  • Latin America
  • Europe
  • East Asia
  • South Asia
  • Oceania
  • Middle East and Africa

Table of Content

  • 1. Executive Summary
  • 2. Market Overview
  • 3. Market Dynamics
  • 4. Value Chain Analysis
  • 5. Global - Pricing Analysis
  • 6. Global Market Size (in Value (USD million) and Volume (MT)) Analysis 2019 to 2023 and Forecast, 2024 to 2034
  • 7. Global Market Analysis 2019 to 2023 and Forecast 2024 to 2034, By Functionality
    • 7.1. Digestive Health Gum
    • 7.2. Oral Health Gum
    • 7.3. Immune System Support Gum
    • 7.4. Children's Probiotic Gum
    • 7.5. Stress and Mood Support Gum
  • 8. Global Market Analysis 2019 to 2023 and Forecast 2024 to 2034, By Flavor
    • 8.1. Mint Flavor
      • 8.1.1. Spearmint
      • 8.1.2. Peppermint
    • 8.2. Fruit Flavor
    • 8.3. Lime Flavor
    • 8.4. Cinnamon Flavor
    • 8.5. Wintergreen
  • 9. Global Market Analysis 2019 to 2023 and Forecast 2024 to 2034, By Distribution Channel
    • 9.1. Store-based Retailing
      • 9.1.1. Hypermarkets/Supermarkets
      • 9.1.2. Conventional Stores
      • 9.1.3. Pharmacies and Drugstores
      • 9.1.4. Independent Small Groceries
    • 9.2. Online Retailing
  • 10. Global Market Analysis 2019 to 2023 and Forecast 2024 to 2034, By Region
    • 10.1. North America
    • 10.2. Latin America
    • 10.3. Europe
    • 10.4. East Asia
    • 10.5. South Asia
    • 10.6. Oceania
    • 10.7. Middle East and Africa
  • 11. North America Market Analysis 2019 to 2023 and Forecast 2024 to 2034
  • 12. Latin America Market Analysis 2019 to 2023 and Forecast 2024 to 2034
  • 13. Europe Market Analysis 2019 to 2023 and Forecast 2024 to 2034
  • 14. East Asia Market Analysis 2019 to 2023 and Forecast 2024 to 2034
  • 15. South Asia Market Analysis 2019 to 2023 and Forecast 2024 to 2034
  • 16. Oceania Market Analysis 2019 to 2023 and Forecast 2024 to 2034
  • 17. Middle East and Africa Market Analysis 2019 to 2023 and Forecast 2024 to 2034
  • 18. Country-level Market Analysis, 2024
  • 19. Market Structure Analysis
  • 20. Competition Analysis
    • 20.1. Probiotiv
    • 20.2. Mondelēz International
    • 20.3. Cafosa
    • 20.4. Art of Nature
    • 20.5. Prairie Naturals
    • 20.6. Strapharm
    • 20.7. ProBiora Health
    • 20.8. TopGum Industries Ltd.
    • 20.9. ZOFT Gum Company
    • 20.10. Other Players (On Additional Requests)
  • 21. Assumptions and Acronyms Used
  • 22. Research Methodology

List of Tables

Table 1: Global Market Value (US$ million) Forecast by Region, 2019 to 2034

Table 2: Global Market Volume (MT) Forecast by Region, 2019 to 2034

Table 3: Global Market Value (US$ million) Forecast by Functionality, 2019 to 2034

Table 4: Global Market Volume (MT) Forecast by Functionality, 2019 to 2034

Table 5: Global Market Value (US$ million) Forecast by Flavor, 2019 to 2034

Table 6: Global Market Volume (MT) Forecast by Flavor, 2019 to 2034

Table 7: Global Market Value (US$ million) Forecast by Distribution Channel, 2019 to 2034

Table 8: Global Market Volume (MT) Forecast by Distribution Channel, 2019 to 2034

Table 9: North America Market Value (US$ million) Forecast by Country, 2019 to 2034

Table 10: North America Market Volume (MT) Forecast by Country, 2019 to 2034

Table 11: North America Market Value (US$ million) Forecast by Functionality, 2019 to 2034

Table 12: North America Market Volume (MT) Forecast by Functionality, 2019 to 2034

Table 13: North America Market Value (US$ million) Forecast by Flavor, 2019 to 2034

Table 14: North America Market Volume (MT) Forecast by Flavor, 2019 to 2034

Table 15: North America Market Value (US$ million) Forecast by Distribution Channel, 2019 to 2034

Table 16: North America Market Volume (MT) Forecast by Distribution Channel, 2019 to 2034

Table 17: Latin America Market Value (US$ million) Forecast by Country, 2019 to 2034

Table 18: Latin America Market Volume (MT) Forecast by Country, 2019 to 2034

Table 19: Latin America Market Value (US$ million) Forecast by Functionality, 2019 to 2034

Table 20: Latin America Market Volume (MT) Forecast by Functionality, 2019 to 2034

Table 21: Latin America Market Value (US$ million) Forecast by Flavor, 2019 to 2034

Table 22: Latin America Market Volume (MT) Forecast by Flavor, 2019 to 2034

Table 23: Latin America Market Value (US$ million) Forecast by Distribution Channel, 2019 to 2034

Table 24: Latin America Market Volume (MT) Forecast by Distribution Channel, 2019 to 2034

Table 25: Europe Market Value (US$ million) Forecast by Country, 2019 to 2034

Table 26: Europe Market Volume (MT) Forecast by Country, 2019 to 2034

Table 27: Europe Market Value (US$ million) Forecast by Functionality, 2019 to 2034

Table 28: Europe Market Volume (MT) Forecast by Functionality, 2019 to 2034

Table 29: Europe Market Value (US$ million) Forecast by Flavor, 2019 to 2034

Table 30: Europe Market Volume (MT) Forecast by Flavor, 2019 to 2034

Table 31: Europe Market Value (US$ million) Forecast by Distribution Channel, 2019 to 2034

Table 32: Europe Market Volume (MT) Forecast by Distribution Channel, 2019 to 2034

Table 33: East Asia Market Value (US$ million) Forecast by Country, 2019 to 2034

Table 34: East Asia Market Volume (MT) Forecast by Country, 2019 to 2034

Table 35: East Asia Market Value (US$ million) Forecast by Functionality, 2019 to 2034

Table 36: East Asia Market Volume (MT) Forecast by Functionality, 2019 to 2034

Table 37: East Asia Market Value (US$ million) Forecast by Flavor, 2019 to 2034

Table 38: East Asia Market Volume (MT) Forecast by Flavor, 2019 to 2034

Table 39: East Asia Market Value (US$ million) Forecast by Distribution Channel, 2019 to 2034

Table 40: East Asia Market Volume (MT) Forecast by Distribution Channel, 2019 to 2034

Table 41: South Asia Market Value (US$ million) Forecast by Country, 2019 to 2034

Table 42: South Asia Market Volume (MT) Forecast by Country, 2019 to 2034

Table 43: South Asia Market Value (US$ million) Forecast by Functionality, 2019 to 2034

Table 44: South Asia Market Volume (MT) Forecast by Functionality, 2019 to 2034

Table 45: South Asia Market Value (US$ million) Forecast by Flavor, 2019 to 2034

Table 46: South Asia Market Volume (MT) Forecast by Flavor, 2019 to 2034

Table 47: South Asia Market Value (US$ million) Forecast by Distribution Channel, 2019 to 2034

Table 48: South Asia Market Volume (MT) Forecast by Distribution Channel, 2019 to 2034

Table 49: Oceania Market Value (US$ million) Forecast by Country, 2019 to 2034

Table 50: Oceania Market Volume (MT) Forecast by Country, 2019 to 2034

Table 51: Oceania Market Value (US$ million) Forecast by Functionality, 2019 to 2034

Table 52: Oceania Market Volume (MT) Forecast by Functionality, 2019 to 2034

Table 53: Oceania Market Value (US$ million) Forecast by Flavor, 2019 to 2034

Table 54: Oceania Market Volume (MT) Forecast by Flavor, 2019 to 2034

Table 55: Oceania Market Value (US$ million) Forecast by Distribution Channel, 2019 to 2034

Table 56: Oceania Market Volume (MT) Forecast by Distribution Channel, 2019 to 2034

Table 57: Middle East and Africa Market Value (US$ million) Forecast by Country, 2019 to 2034

Table 58: Middle East and Africa Market Volume (MT) Forecast by Country, 2019 to 2034

Table 59: Middle East and Africa Market Value (US$ million) Forecast by Functionality, 2019 to 2034

Table 60: Middle East and Africa Market Volume (MT) Forecast by Functionality, 2019 to 2034

Table 61: Middle East and Africa Market Value (US$ million) Forecast by Flavor, 2019 to 2034

Table 62: Middle East and Africa Market Volume (MT) Forecast by Flavor, 2019 to 2034

Table 63: Middle East and Africa Market Value (US$ million) Forecast by Distribution Channel, 2019 to 2034

Table 64: Middle East and Africa Market Volume (MT) Forecast by Distribution Channel, 2019 to 2034

List of Figures

Figure 1: Global Market Value (US$ million) by Functionality, 2024 to 2034

Figure 2: Global Market Value (US$ million) by Flavor, 2024 to 2034

Figure 3: Global Market Value (US$ million) by Distribution Channel, 2024 to 2034

Figure 4: Global Market Value (US$ million) by Region, 2024 to 2034

Figure 5: Global Market Value (US$ million) Analysis by Region, 2019 to 2034

Figure 6: Global Market Volume (MT) Analysis by Region, 2019 to 2034

Figure 7: Global Market Value Share (%) and BPS Analysis by Region, 2024 to 2034

Figure 8: Global Market Y-o-Y Growth (%) Projections by Region, 2024 to 2034

Figure 9: Global Market Value (US$ million) Analysis by Functionality, 2019 to 2034

Figure 10: Global Market Volume (MT) Analysis by Functionality, 2019 to 2034

Figure 11: Global Market Value Share (%) and BPS Analysis by Functionality, 2024 to 2034

Figure 12: Global Market Y-o-Y Growth (%) Projections by Functionality, 2024 to 2034

Figure 13: Global Market Value (US$ million) Analysis by Flavor, 2019 to 2034

Figure 14: Global Market Volume (MT) Analysis by Flavor, 2019 to 2034

Figure 15: Global Market Value Share (%) and BPS Analysis by Flavor, 2024 to 2034

Figure 16: Global Market Y-o-Y Growth (%) Projections by Flavor, 2024 to 2034

Figure 17: Global Market Value (US$ million) Analysis by Distribution Channel, 2019 to 2034

Figure 18: Global Market Volume (MT) Analysis by Distribution Channel, 2019 to 2034

Figure 19: Global Market Value Share (%) and BPS Analysis by Distribution Channel, 2024 to 2034

Figure 20: Global Market Y-o-Y Growth (%) Projections by Distribution Channel, 2024 to 2034

Figure 21: Global Market Attractiveness by Functionality, 2024 to 2034

Figure 22: Global Market Attractiveness by Flavor, 2024 to 2034

Figure 23: Global Market Attractiveness by Distribution Channel, 2024 to 2034

Figure 24: Global Market Attractiveness by Region, 2024 to 2034

Figure 25: North America Market Value (US$ million) by Functionality, 2024 to 2034

Figure 26: North America Market Value (US$ million) by Flavor, 2024 to 2034

Figure 27: North America Market Value (US$ million) by Distribution Channel, 2024 to 2034

Figure 28: North America Market Value (US$ million) by Country, 2024 to 2034

Figure 29: North America Market Value (US$ million) Analysis by Country, 2019 to 2034

Figure 30: North America Market Volume (MT) Analysis by Country, 2019 to 2034

Figure 31: North America Market Value Share (%) and BPS Analysis by Country, 2024 to 2034

Figure 32: North America Market Y-o-Y Growth (%) Projections by Country, 2024 to 2034

Figure 33: North America Market Value (US$ million) Analysis by Functionality, 2019 to 2034

Figure 34: North America Market Volume (MT) Analysis by Functionality, 2019 to 2034

Figure 35: North America Market Value Share (%) and BPS Analysis by Functionality, 2024 to 2034

Figure 36: North America Market Y-o-Y Growth (%) Projections by Functionality, 2024 to 2034

Figure 37: North America Market Value (US$ million) Analysis by Flavor, 2019 to 2034

Figure 38: North America Market Volume (MT) Analysis by Flavor, 2019 to 2034

Figure 39: North America Market Value Share (%) and BPS Analysis by Flavor, 2024 to 2034

Figure 40: North America Market Y-o-Y Growth (%) Projections by Flavor, 2024 to 2034

Figure 41: North America Market Value (US$ million) Analysis by Distribution Channel, 2019 to 2034

Figure 42: North America Market Volume (MT) Analysis by Distribution Channel, 2019 to 2034

Figure 43: North America Market Value Share (%) and BPS Analysis by Distribution Channel, 2024 to 2034

Figure 44: North America Market Y-o-Y Growth (%) Projections by Distribution Channel, 2024 to 2034

Figure 45: North America Market Attractiveness by Functionality, 2024 to 2034

Figure 46: North America Market Attractiveness by Flavor, 2024 to 2034

Figure 47: North America Market Attractiveness by Distribution Channel, 2024 to 2034

Figure 48: North America Market Attractiveness by Country, 2024 to 2034

Figure 49: Latin America Market Value (US$ million) by Functionality, 2024 to 2034

Figure 50: Latin America Market Value (US$ million) by Flavor, 2024 to 2034

Figure 51: Latin America Market Value (US$ million) by Distribution Channel, 2024 to 2034

Figure 52: Latin America Market Value (US$ million) by Country, 2024 to 2034

Figure 53: Latin America Market Value (US$ million) Analysis by Country, 2019 to 2034

Figure 54: Latin America Market Volume (MT) Analysis by Country, 2019 to 2034

Figure 55: Latin America Market Value Share (%) and BPS Analysis by Country, 2024 to 2034

Figure 56: Latin America Market Y-o-Y Growth (%) Projections by Country, 2024 to 2034

Figure 57: Latin America Market Value (US$ million) Analysis by Functionality, 2019 to 2034

Figure 58: Latin America Market Volume (MT) Analysis by Functionality, 2019 to 2034

Figure 59: Latin America Market Value Share (%) and BPS Analysis by Functionality, 2024 to 2034

Figure 60: Latin America Market Y-o-Y Growth (%) Projections by Functionality, 2024 to 2034

Figure 61: Latin America Market Value (US$ million) Analysis by Flavor, 2019 to 2034

Figure 62: Latin America Market Volume (MT) Analysis by Flavor, 2019 to 2034

Figure 63: Latin America Market Value Share (%) and BPS Analysis by Flavor, 2024 to 2034

Figure 64: Latin America Market Y-o-Y Growth (%) Projections by Flavor, 2024 to 2034

Figure 65: Latin America Market Value (US$ million) Analysis by Distribution Channel, 2019 to 2034

Figure 66: Latin America Market Volume (MT) Analysis by Distribution Channel, 2019 to 2034

Figure 67: Latin America Market Value Share (%) and BPS Analysis by Distribution Channel, 2024 to 2034

Figure 68: Latin America Market Y-o-Y Growth (%) Projections by Distribution Channel, 2024 to 2034

Figure 69: Latin America Market Attractiveness by Functionality, 2024 to 2034

Figure 70: Latin America Market Attractiveness by Flavor, 2024 to 2034

Figure 71: Latin America Market Attractiveness by Distribution Channel, 2024 to 2034

Figure 72: Latin America Market Attractiveness by Country, 2024 to 2034

Figure 73: Europe Market Value (US$ million) by Functionality, 2024 to 2034

Figure 74: Europe Market Value (US$ million) by Flavor, 2024 to 2034

Figure 75: Europe Market Value (US$ million) by Distribution Channel, 2024 to 2034

Figure 76: Europe Market Value (US$ million) by Country, 2024 to 2034

Figure 77: Europe Market Value (US$ million) Analysis by Country, 2019 to 2034

Figure 78: Europe Market Volume (MT) Analysis by Country, 2019 to 2034

Figure 79: Europe Market Value Share (%) and BPS Analysis by Country, 2024 to 2034

Figure 80: Europe Market Y-o-Y Growth (%) Projections by Country, 2024 to 2034

Figure 81: Europe Market Value (US$ million) Analysis by Functionality, 2019 to 2034

Figure 82: Europe Market Volume (MT) Analysis by Functionality, 2019 to 2034

Figure 83: Europe Market Value Share (%) and BPS Analysis by Functionality, 2024 to 2034

Figure 84: Europe Market Y-o-Y Growth (%) Projections by Functionality, 2024 to 2034

Figure 85: Europe Market Value (US$ million) Analysis by Flavor, 2019 to 2034

Figure 86: Europe Market Volume (MT) Analysis by Flavor, 2019 to 2034

Figure 87: Europe Market Value Share (%) and BPS Analysis by Flavor, 2024 to 2034

Figure 88: Europe Market Y-o-Y Growth (%) Projections by Flavor, 2024 to 2034

Figure 89: Europe Market Value (US$ million) Analysis by Distribution Channel, 2019 to 2034

Figure 90: Europe Market Volume (MT) Analysis by Distribution Channel, 2019 to 2034

Figure 91: Europe Market Value Share (%) and BPS Analysis by Distribution Channel, 2024 to 2034

Figure 92: Europe Market Y-o-Y Growth (%) Projections by Distribution Channel, 2024 to 2034

Figure 93: Europe Market Attractiveness by Functionality, 2024 to 2034

Figure 94: Europe Market Attractiveness by Flavor, 2024 to 2034

Figure 95: Europe Market Attractiveness by Distribution Channel, 2024 to 2034

Figure 96: Europe Market Attractiveness by Country, 2024 to 2034

Figure 97: East Asia Market Value (US$ million) by Functionality, 2024 to 2034

Figure 98: East Asia Market Value (US$ million) by Flavor, 2024 to 2034

Figure 99: East Asia Market Value (US$ million) by Distribution Channel, 2024 to 2034

Figure 100: East Asia Market Value (US$ million) by Country, 2024 to 2034

Figure 101: East Asia Market Value (US$ million) Analysis by Country, 2019 to 2034

Figure 102: East Asia Market Volume (MT) Analysis by Country, 2019 to 2034

Figure 103: East Asia Market Value Share (%) and BPS Analysis by Country, 2024 to 2034

Figure 104: East Asia Market Y-o-Y Growth (%) Projections by Country, 2024 to 2034

Figure 105: East Asia Market Value (US$ million) Analysis by Functionality, 2019 to 2034

Figure 106: East Asia Market Volume (MT) Analysis by Functionality, 2019 to 2034

Figure 107: East Asia Market Value Share (%) and BPS Analysis by Functionality, 2024 to 2034

Figure 108: East Asia Market Y-o-Y Growth (%) Projections by Functionality, 2024 to 2034

Figure 109: East Asia Market Value (US$ million) Analysis by Flavor, 2019 to 2034

Figure 110: East Asia Market Volume (MT) Analysis by Flavor, 2019 to 2034

Figure 111: East Asia Market Value Share (%) and BPS Analysis by Flavor, 2024 to 2034

Figure 112: East Asia Market Y-o-Y Growth (%) Projections by Flavor, 2024 to 2034

Figure 113: East Asia Market Value (US$ million) Analysis by Distribution Channel, 2019 to 2034

Figure 114: East Asia Market Volume (MT) Analysis by Distribution Channel, 2019 to 2034

Figure 115: East Asia Market Value Share (%) and BPS Analysis by Distribution Channel, 2024 to 2034

Figure 116: East Asia Market Y-o-Y Growth (%) Projections by Distribution Channel, 2024 to 2034

Figure 117: East Asia Market Attractiveness by Functionality, 2024 to 2034

Figure 118: East Asia Market Attractiveness by Flavor, 2024 to 2034

Figure 119: East Asia Market Attractiveness by Distribution Channel, 2024 to 2034

Figure 120: East Asia Market Attractiveness by Country, 2024 to 2034

Figure 121: South Asia Market Value (US$ million) by Functionality, 2024 to 2034

Figure 122: South Asia Market Value (US$ million) by Flavor, 2024 to 2034

Figure 123: South Asia Market Value (US$ million) by Distribution Channel, 2024 to 2034

Figure 124: South Asia Market Value (US$ million) by Country, 2024 to 2034

Figure 125: South Asia Market Value (US$ million) Analysis by Country, 2019 to 2034

Figure 126: South Asia Market Volume (MT) Analysis by Country, 2019 to 2034

Figure 127: South Asia Market Value Share (%) and BPS Analysis by Country, 2024 to 2034

Figure 128: South Asia Market Y-o-Y Growth (%) Projections by Country, 2024 to 2034

Figure 129: South Asia Market Value (US$ million) Analysis by Functionality, 2019 to 2034

Figure 130: South Asia Market Volume (MT) Analysis by Functionality, 2019 to 2034

Figure 131: South Asia Market Value Share (%) and BPS Analysis by Functionality, 2024 to 2034

Figure 132: South Asia Market Y-o-Y Growth (%) Projections by Functionality, 2024 to 2034

Figure 133: South Asia Market Value (US$ million) Analysis by Flavor, 2019 to 2034

Figure 134: South Asia Market Volume (MT) Analysis by Flavor, 2019 to 2034

Figure 135: South Asia Market Value Share (%) and BPS Analysis by Flavor, 2024 to 2034

Figure 136: South Asia Market Y-o-Y Growth (%) Projections by Flavor, 2024 to 2034

Figure 137: South Asia Market Value (US$ million) Analysis by Distribution Channel, 2019 to 2034

Figure 138: South Asia Market Volume (MT) Analysis by Distribution Channel, 2019 to 2034

Figure 139: South Asia Market Value Share (%) and BPS Analysis by Distribution Channel, 2024 to 2034

Figure 140: South Asia Market Y-o-Y Growth (%) Projections by Distribution Channel, 2024 to 2034

Figure 141: South Asia Market Attractiveness by Functionality, 2024 to 2034

Figure 142: South Asia Market Attractiveness by Flavor, 2024 to 2034

Figure 143: South Asia Market Attractiveness by Distribution Channel, 2024 to 2034

Figure 144: South Asia Market Attractiveness by Country, 2024 to 2034

Figure 145: Oceania Market Value (US$ million) by Functionality, 2024 to 2034

Figure 146: Oceania Market Value (US$ million) by Flavor, 2024 to 2034

Figure 147: Oceania Market Value (US$ million) by Distribution Channel, 2024 to 2034

Figure 148: Oceania Market Value (US$ million) by Country, 2024 to 2034

Figure 149: Oceania Market Value (US$ million) Analysis by Country, 2019 to 2034

Figure 150: Oceania Market Volume (MT) Analysis by Country, 2019 to 2034

Figure 151: Oceania Market Value Share (%) and BPS Analysis by Country, 2024 to 2034

Figure 152: Oceania Market Y-o-Y Growth (%) Projections by Country, 2024 to 2034

Figure 153: Oceania Market Value (US$ million) Analysis by Functionality, 2019 to 2034

Figure 154: Oceania Market Volume (MT) Analysis by Functionality, 2019 to 2034

Figure 155: Oceania Market Value Share (%) and BPS Analysis by Functionality, 2024 to 2034

Figure 156: Oceania Market Y-o-Y Growth (%) Projections by Functionality, 2024 to 2034

Figure 157: Oceania Market Value (US$ million) Analysis by Flavor, 2019 to 2034

Figure 158: Oceania Market Volume (MT) Analysis by Flavor, 2019 to 2034

Figure 159: Oceania Market Value Share (%) and BPS Analysis by Flavor, 2024 to 2034

Figure 160: Oceania Market Y-o-Y Growth (%) Projections by Flavor, 2024 to 2034

Figure 161: Oceania Market Value (US$ million) Analysis by Distribution Channel, 2019 to 2034

Figure 162: Oceania Market Volume (MT) Analysis by Distribution Channel, 2019 to 2034

Figure 163: Oceania Market Value Share (%) and BPS Analysis by Distribution Channel, 2024 to 2034

Figure 164: Oceania Market Y-o-Y Growth (%) Projections by Distribution Channel, 2024 to 2034

Figure 165: Oceania Market Attractiveness by Functionality, 2024 to 2034

Figure 166: Oceania Market Attractiveness by Flavor, 2024 to 2034

Figure 167: Oceania Market Attractiveness by Distribution Channel, 2024 to 2034

Figure 168: Oceania Market Attractiveness by Country, 2024 to 2034

Figure 169: Middle East and Africa Market Value (US$ million) by Functionality, 2024 to 2034

Figure 170: Middle East and Africa Market Value (US$ million) by Flavor, 2024 to 2034

Figure 171: Middle East and Africa Market Value (US$ million) by Distribution Channel, 2024 to 2034

Figure 172: Middle East and Africa Market Value (US$ million) by Country, 2024 to 2034

Figure 173: Middle East and Africa Market Value (US$ million) Analysis by Country, 2019 to 2034

Figure 174: Middle East and Africa Market Volume (MT) Analysis by Country, 2019 to 2034

Figure 175: Middle East and Africa Market Value Share (%) and BPS Analysis by Country, 2024 to 2034

Figure 176: Middle East and Africa Market Y-o-Y Growth (%) Projections by Country, 2024 to 2034

Figure 177: Middle East and Africa Market Value (US$ million) Analysis by Functionality, 2019 to 2034

Figure 178: Middle East and Africa Market Volume (MT) Analysis by Functionality, 2019 to 2034

Figure 179: Middle East and Africa Market Value Share (%) and BPS Analysis by Functionality, 2024 to 2034

Figure 180: Middle East and Africa Market Y-o-Y Growth (%) Projections by Functionality, 2024 to 2034

Figure 181: Middle East and Africa Market Value (US$ million) Analysis by Flavor, 2019 to 2034

Figure 182: Middle East and Africa Market Volume (MT) Analysis by Flavor, 2019 to 2034

Figure 183: Middle East and Africa Market Value Share (%) and BPS Analysis by Flavor, 2024 to 2034

Figure 184: Middle East and Africa Market Y-o-Y Growth (%) Projections by Flavor, 2024 to 2034

Figure 185: Middle East and Africa Market Value (US$ million) Analysis by Distribution Channel, 2019 to 2034

Figure 186: Middle East and Africa Market Volume (MT) Analysis by Distribution Channel, 2019 to 2034

Figure 187: Middle East and Africa Market Value Share (%) and BPS Analysis by Distribution Channel, 2024 to 2034

Figure 188: Middle East and Africa Market Y-o-Y Growth (%) Projections by Distribution Channel, 2024 to 2034

Figure 189: Middle East and Africa Market Attractiveness by Functionality, 2024 to 2034

Figure 190: Middle East and Africa Market Attractiveness by Flavor, 2024 to 2034

Figure 191: Middle East and Africa Market Attractiveness by Distribution Channel, 2024 to 2034

Figure 192: Middle East and Africa Market Attractiveness by Country, 2024 to 2034

Frequently Asked Questions

How big is the probiotic chewing gum market?

The market is set to reach USD 373.0 million in 2024.

What is the forecast for the probiotic chewing gum market?

Demand for probiotic chewing gum is slated to expand at a 5.4% CAGR by 2034.

What is the outlook for the probiotic chewing gum market?

The market is set to reach USD 629.0 million in 2034.

Who are the key players in the probiotic chewing gum market?

Probiotiv, Mondelēz International, and Cafosa are the key players.

Which region would lead the probiotic chewing gum market?

North America is expected to lead the market with a 33% share in 2034.

Explore Similar Insights

Future Market Insights

Probiotic Chewing Gum Market