Synbiotic Pet Treats Market Size and Share Forecast Outlook 2025 to 2035

The Synbiotic Pet Treats Market is valued at USD 356.2 million in 2025 and is forecast to reach USD 627.3 million by 2035. This expansion reflects an overall increase of USD 271,1 million, advancing at a compound annual growth rate (CAGR) of 5.8% over the ten-year period.
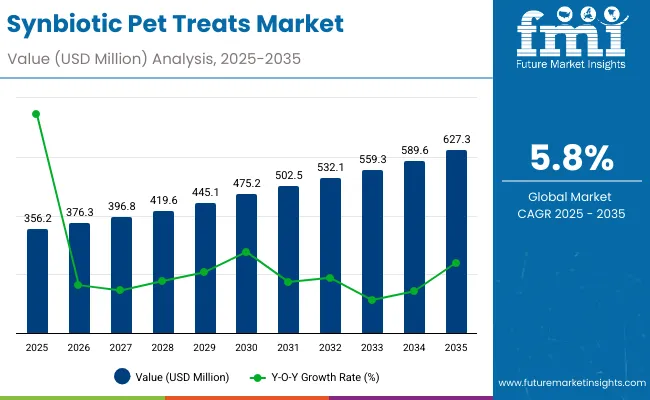
Quick Stats for Synbiotic Pet Treats Market

  • Synbiotic Pet Treats Market Value (2025): USD 356.2 million
  • Synbiotic Pet Treats Market Forecast Value (2035): USD 627.3 million
  • Synbiotic Pet Treats Market Forecast CAGR: 5.8%
  • Leading Segment in Synbiotic Pet Treats Market in 2025: Dogs (68% share)
  • Key Growth Regions in the Synbiotic Pet Treats Market: North America, South Asia & Pacific, Europe
  • Top Key Players in Synbiotic Pet Treats Market: Nestlé Purina PetCare (FortiFlora), Hill’s Pet Nutrition (Colgate-Palmolive), Zesty Paws (H&H Group), NaturVet (Garmon Corp.), Nutramax Laboratories (Proviable)

Synbiotic Pet Treats Market

Synbiotic Pet Treats Market Key Takeaways

Metric Value
Market Estimated Value in (2025E) USD 356.2 million
Market Forecast Value in (2035F) USD 627.3 million
Forecast CAGR (2025 to 2035) 5.80%

During the first phase from 2025 to 2030, the market grows from USD 356.2 million to USD 475,2 million, adding nearly USD 119 million and representing about 44% of total growth expected over the decade. This phase is marked by steady adoption of functional formulations designed to improve digestive health and immune resilience in pets.

In the second half of the forecast period, between 2030 and 2035, the market is expected to rise by a further USD 152,1 million, advancing from USD 475,2 million to USD 627,3 million. Growth in this stage is expected to be driven by rising awareness in emerging markets, particularly in South Asia and the Pacific, supported by urbanization, increasing disposable incomes, and greater investment in pet wellness. North America is projected to maintain the largest share with around 30% of global revenues in 2025, closely followed by Europe with 28%.

Dogs account for the largest share of demand at 68% in 2025, supported by high owner spending on preventive nutrition. Digestive health is positioned as the leading functionality segment with 42% contribution, while freeze-dried treats and powders are projected to outpace traditional formats, offering significant scope for premium and innovative launches over the coming years.

From 2020 to 2024, the Synbiotic Pet Treats Market expanded steadily, with dogs representing the dominant revenue stream. By 2025, the market reached nearly USD 356.2 Million, driven by digestive health formulations. Competitive advantage was maintained by leaders such as Nestlé Purina, Zesty Paws, and Nutramax through precision formulations, distribution expansion, and functional claims in soft chews and freeze-dried treats. Between 2025 and 2035, demand is projected to advance to USD 627.3 Million, supported by rising online retail adoption, functional jerky and topping formats, and innovation in multi-strain probiotic complexes. The revenue mix will gradually diversify, with software-like subscription models in direct-to-consumer channels gaining traction. Competitive strength will increasingly depend on ecosystem breadth, scientific validation, and integration of tailored health solutions across pets. Emerging entrants emphasizing digital DTC sales, customized blends, and human-grade positioning are expected to gain share, shifting the market from product-centric growth to experience-driven and evidence-backed expansion.

Why the Synbiotic Pet Treats Market is growing?

Advances in scanning hardware have improved accuracy and speed, allowing for more efficient data capture across diverse applications. Short-range scanners have gained popularity due to their suitability for detailed surface scanning and small object measurement. The rise of laser triangulation technology has contributed to enhanced resolution and real-time processing capabilities. Industries such as manufacturing, healthcare, and aerospace are driving demand for Synbiotic Pet Treatssolutions that can integrate seamlessly into existing workflows.

Expansion of automated inspection and reverse engineering processes has fueled market growth. Innovations in portable and handheld scanning devices and software enhancements are expected to open new application areas. Segment growth is expected to be led by hardware components, short-range scanners in range categories, and laser triangulation technology due to their precision and adaptability.

Segmental Analysis

The Synbiotic Pet Treats Market has been segmented on the basis of pet type, functionality, and form, reflecting the diverse needs of pet owners and the differentiated role of synbiotics across health and wellness categories. Pet type segmentation highlights demand patterns among dogs, cats, and small mammals, underlining distinct growth trajectories. Functional segmentation emphasizes digestive health, immune support, skin and coat wellness, and anxiety management, showcasing rising attention to preventive care.

Form-based segmentation covers soft chews, biscuits, freeze-dried treats, functional jerky, and powders, offering insights into how consumer preferences are shaping product innovation. Together, these segments illustrate a market moving toward specialized, science-backed solutions designed to improve overall pet well-being while aligning with premiumization and convenience trends.
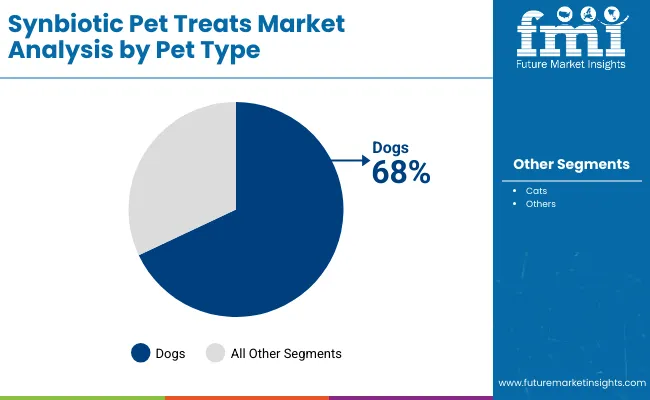
Insights into the Pet Type Segment with Dogs Leading in Market Share

Synbiotic Pet Treats Market By Pet

Component Segment Market Value Share, 2025
Dogs 68%
Cats 27%
Others (Small Mammals) 5%

The pet type segment is projected to be led by dogs, which hold 68% of the market share in 2025. This dominance is attributed to higher expenditure by dog owners, who increasingly adopt synbiotic treats to maintain digestive health and strengthen immunity. Cats represent 27% of demand, supported by rising urban cat ownership in regions such as Europe and East Asia. Although small mammals account for only 5%, niche product availability is expected to widen their adoption. Dogs will continue to anchor the market, while cats emerge as a secondary growth driver. Innovations in targeted synbiotic formulations for smaller animals are anticipated to broaden adoption and enhance market penetration across diverse consumer groups.
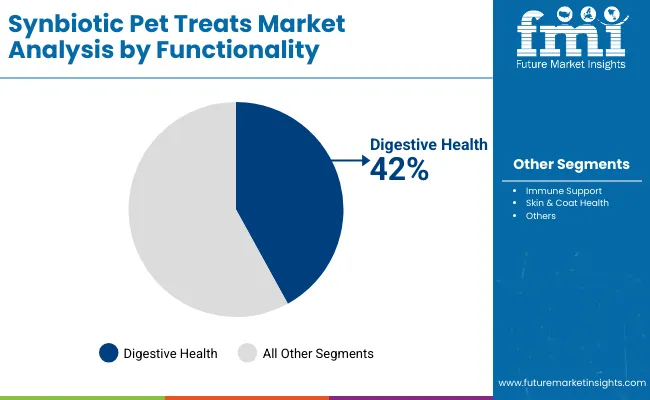
Insights into the Functionality Segment with Digestive Health Driving Adoption

Synbiotic Pet Treats Market By Functionality

Range Segment Market Value Share, 2025
Digestive Health 42%
Immune Support 27%
Skin & Coat Health 21%
Anxiety & Mood Support 10%

Digestive health dominates functionality with a 42% share in 2025, reflecting the growing prioritization of gut health as a foundation of pet wellness. Immune support follows at 27%, sustained by rising emphasis on preventive care. Skin and coat health accounts for 21%, driven by pet owners’ concerns around allergies, sensitivities, and overall grooming. Anxiety and mood support contributes 10%, showing increasing relevance of behavioral health. Across all functions, synbiotics are being positioned as daily wellness aids rather than niche solutions. Multifunctional product innovation is expected to accelerate uptake, with digestive health continuing as the anchor segment. The convergence of health claims will reinforce market maturity and diversify revenue streams over the decade.
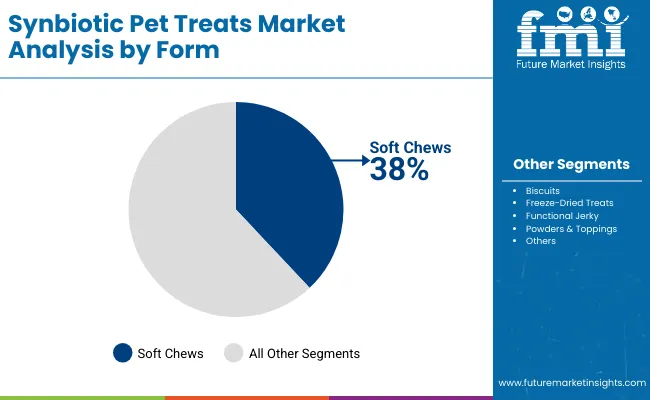
Insights into the Form Segment with Soft Chews Maintaining Dominance

Synbiotic Pet Treats Market By Form

Laser triangulation technology Market Value Share, 2025
Soft Chews 38%
Biscuits 22%
Freeze-Dried Treats 18%
Functional Jerky 14%
Powders & Toppings 8%

Soft chews are expected to dominate with 38% of market share in 2025, supported by their palatability, convenience, and established consumer familiarity. Biscuits hold 22%, favored by affordability and tradition, though growth is slower compared to emerging premium formats. Freeze-dried treats, at 18%, are projected to record strong momentum as they align with natural and nutrient-retentive positioning. Functional jerky contributes 14% but remains relatively stable in growth. Powders and toppings, though small at 8%, are expected to deliver the fastest CAGR of 8.5%, reflecting increasing customization in pet diets. This segmentation highlights a gradual shift from conventional forms toward premium and functional innovations.

What are the Drivers, Restraints, and Key Trends of the Synbiotic Pet Treats Market?

The Synbiotic Pet Treats Market is being shaped by advancing nutritional science, evolving consumer preferences, and targeted product innovation, even as challenges in pricing, awareness, and product differentiation remain. Long-term growth will depend on credible functionality and regionally adaptive strategies.

Integration of Microbiome Research into Product Development

Market expansion is being propelled by integration of advanced microbiome research into product formulation, enabling synbiotic treats to be positioned as scientifically validated health solutions. Veterinary endorsements are being influenced by this evidence base, increasing consumer trust. Research-driven differentiation is anticipated to create premium pricing opportunities, particularly in North America and Europe.

Companies are expected to leverage collaborations with research institutions to maintain product credibility and expand consumer education campaigns. The forward-looking potential lies in aligning synbiotics with broader preventive healthcare frameworks, thereby positioning functional treats as substitutes for certain supplementary medicines. This driver ensures that future demand is not just trend-based but anchored in scientific validation and long-term health outcomes.

Cross-Functional Formulation with Behavioral Health Positioning

A trend shaping the market is the evolution of cross-functional synbiotic formulations that combine digestive health with behavioral benefits, particularly anxiety and mood support. Pet owners are increasingly seeking products that address both physical and psychological well-being, and synbiotics are being reformulated to deliver multi-dimensional outcomes. Innovation pipelines are already shifting toward blends that support microbiome balance while influencing neuro-gut pathways, opening opportunities for differentiation.

This trend reflects a transition from single-function products to holistic wellness solutions, aligning pet nutrition with human wellness practices. As awareness expands, synbiotic treats are expected to occupy a unique space bridging traditional nutrition and behavioral health management, enhancing consumer loyalty and widening premium adoption.
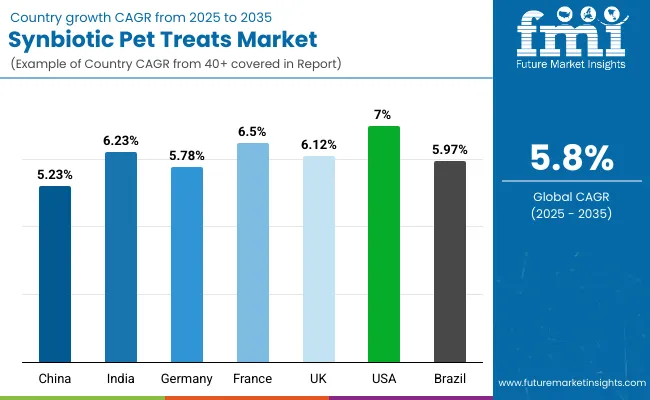
Analysis of Synbiotic Pet Treats Market By Key Countries

Synbiotic Pet Treats Market By Country

Country CAGR
China 5.23%
India 6.23%
Germany 5.78%
France 6.50%
UK. 6.12%
USA 7.00%
Brazil 5.97%

The Synbiotic Pet Treats Market demonstrates notable variation across leading economies, shaped by pet ownership structures, regulatory landscapes, and consumer willingness to invest in preventive nutrition. The United States is projected to advance at a CAGR of 7.0%, the highest among key countries, underpinned by strong premiumization, advanced veterinary networks, and heightened awareness of microbiome science in pet wellness. India follows with a CAGR of 6.23%, supported by expanding middle-class spending on companion animals and rapid urbanization, which is expected to drive synbiotic adoption beyond metropolitan centers.

France, at 6.50% CAGR, is positioned as a leading European market, reflecting its established culture of pet care premiumization and government-supported animal health frameworks. The United Kingdom, growing at 6.12%, is forecast to benefit from rising cat adoption and the spread of functional formats through online distribution. Germany, with a CAGR of 5.78%, remains a significant hub due to strict product quality standards and alignment with science-driven formulations.

China and Brazil, growing at 5.23% and 5.97% respectively, represent promising yet developing opportunities. China’s trajectory is linked to growing urban pet populations and rising demand for imported formulations, while Brazil is expected to benefit from increasing investments in veterinary infrastructure and e-commerce-driven pet care retailing.
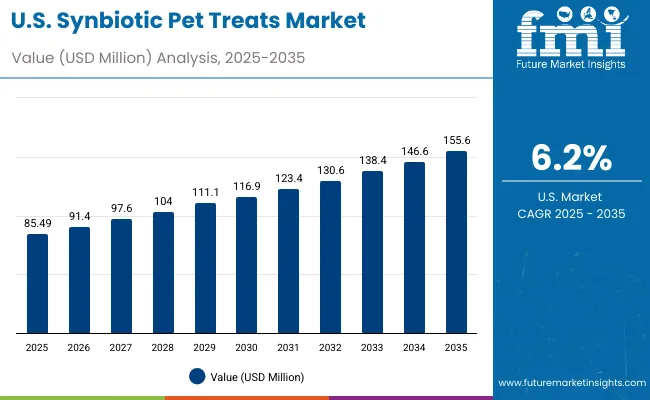
Sales Outlook for Synbiotic Pet Treats in the United States

Synbiotic Pet Treats Market Usa

Year USA Synbiotic Pet Treats Market (USD Million)
2025 85.49
2026 91.4
2027 97.6
2028 104.0
2029 111.1
2030 116.9
2031 123.4
2032 130.6
2033 138.4
2034 146.6
2035 155.6

The Synbiotic Pet Treats Market in the United States is projected to expand from US$ 85.49 million in 2025 to US$ 155.6 million in 2035, registering a CAGR of 6.2%. Growth is being shaped by strong consumer inclination toward premium functional treats and heightened veterinary recommendations supporting synbiotic use. A combination of advanced formulations and increasing owner focus on preventive healthcare is reinforcing steady year-on-year gains.

The first half of the forecast period reflects steady adoption as digestive and immune health products are prioritized by owners. The second half is expected to be driven by innovations in behavioral wellness formulations and expansion of e-commerce channels. With the USA accounting for the largest national share globally, competitive intensity is anticipated to rise as multinational brands and local players emphasize differentiated claims. The market outlook signals long-term resilience, with expansion underpinned by health-conscious consumers, advanced veterinary infrastructure, and broad retail penetration.

  • Digestive and immune health solutions are projected to remain the core drivers of product adoption.
  • Behavioral health-oriented synbiotic treats are anticipated to expand share through multifunctional claims.
  • Digital retailing and subscription models are expected to enhance consumer loyalty and category growth.

Growth and Expansion Outlook for Synbiotic Pet Treats Market in the United Kingdom

The Synbiotic Pet Treats Market in the United Kingdom is forecast to grow at a CAGR of 6.12% between 2025 and 2035. Growth is being reinforced by rising adoption of functional treats among cat owners, as urban households increasingly favor smaller pets. Premiumization of pet food categories is expected to support synbiotic positioning, with strong receptivity to digestive and immune health claims. Online retail and subscription-based purchasing models are anticipated to strengthen market penetration, particularly for premium and personalized offerings. Veterinary endorsements and science-backed claims are expected to remain critical for consumer trust in the UK.

Key Insights

  • Cat adoption trends are projected to reinforce synbiotic demand across urban centers.
  • Online channels are expected to drive significant share of future sales.
  • Premium and multifunctional treats are anticipated to strengthen brand differentiation.
  • Veterinary networks will continue to shape product credibility and adoption.

Growth and Expansion Outlook for Synbiotic Pet Treats Market in India

The Synbiotic Pet Treats Market in India is projected to advance at a CAGR of 6.23% during 2025-2035. Expansion is being supported by growing disposable incomes, rapid urbanization, and heightened awareness of pet health in tier-1 and tier-2 cities. Functional treats are increasingly being accepted as an extension of preventive care, with digestive health remaining the most preferred benefit. Growth is anticipated to accelerate further as e-commerce platforms expand access to premium products beyond metropolitan regions. Local adaptation of formulations and price-sensitive packaging strategies are expected to play a vital role in broadening adoption.

Key Insights

  • Urbanization is driving penetration of functional treats into middle-income households.
  • E-commerce expansion is expected to widen availability beyond metro cities.
  • Digestive health products are projected to remain the strongest demand driver.
  • Pricing strategies tailored to affordability will determine long-term adoption.

Sales Outlook for Synbiotic Pet Treats in China

The Synbiotic Pet Treats Market in China is estimated to grow at a CAGR of 5.23% through 2025-2035. Expansion is being shaped by rapid growth in the pet-owning population, especially among young urban professionals. Domestic demand for imported premium formulations is expected to remain strong, driven by perceived quality and trust in international brands. Regulatory oversight of pet supplements is projected to tighten, favoring established players with compliance infrastructure. Online retail ecosystems, led by large e-commerce platforms, are expected to dominate sales channels. The long-term trajectory suggests continued reliance on digestive health-focused products while multifunctional synbiotic solutions gradually gain visibility.

Key Insights
  • Imported premium brands are projected to capture high consumer trust.
  • Regulatory compliance will play a decisive role in market consolidation.
  • E-commerce platforms are anticipated to remain the dominant sales channel.
  • Urban professionals will continue to drive demand for functional synbiotics.

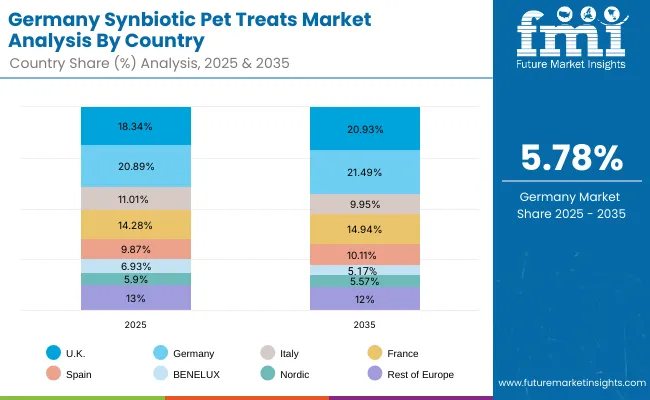
In-depth Analysis of Synbiotic Pet Treats in Germany

Synbiotic Pet Treats Market Germany

Countries 2025
UK 18.34%
Germany 20.89%
Italy 11.01%
France 14.28%
Spain 9.87%
BENELUX 6.93%
Nordic 5.90%
Rest of Europe 13%
Countries 2035
UK 20.93%
Germany 21.49%
Italy 9.95%
France 14.94%
Spain 10.11%
BENELUX 5.17%
Nordic 5.57%
Rest of Europe 12%

The Synbiotic Pet Treats Market in Germany is projected to expand at a CAGR of 5.78% over 2025-2035. Growth is being supported by stringent product quality standards and high receptivity to scientifically validated functional nutrition. Pet owners are increasingly seeking preventive health solutions, with digestive and immune health categories expected to maintain dominance. Retail distribution through specialty pet stores remains influential, although digital platforms are gaining traction with younger demographics. Strong regulatory alignment with EU standards is anticipated to favor companies with advanced R&D capabilities and transparent ingredient sourcing. Premium claims emphasizing sustainability and science-backed efficacy are expected to gain prominence.

Key Insights
  • Preventive health positioning is projected to remain a critical adoption driver.
  • Specialty retail channels continue to dominate, though online growth is accelerating.
  • EU compliance standards favor science-driven and transparent product development.
  • Premium and sustainability claims are expected to support differentiation.

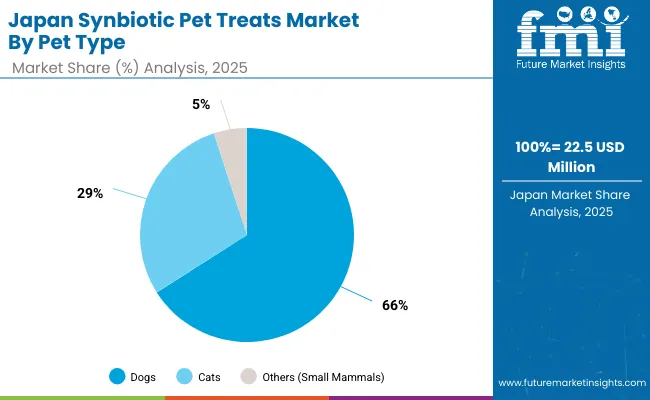
Growth Outlook for Synbiotic Pet Treats Market in Japan

Synbiotic Pet Treats Market Japan

Component Segment Market Value Share, 2025
Dogs 66%
Cats 29%
Others (Small Mammals) 5%

The Synbiotic Pet Treats Market in Japan is projected at US$ 22.5 million in 2025, representing nearly half of East Asia’s total market. Dogs account for 66% of demand, reflecting Japan’s strong canine ownership culture, while cats represent 29%, supported by rising urban households where smaller pets are preferred. Small mammals hold 5%, showing potential for niche synbiotic formulations. Growth is expected to be sustained by premiumization, with freeze-dried and powdered formats aligning with Japanese consumer preferences for quality and functionality. Veterinary endorsement is anticipated to further boost credibility, while multifunctional formulations addressing digestive, immune, and behavioral health are likely to drive stronger adoption. Japan’s position as a mature pet care market ensures that innovation-led strategies will remain central to market expansion.
  • Japan is valued at US$ 22.5 million in 2025, holding about 6.3% of the global market
  • Dogs dominate consumption at 66%, with cats rising steadily at 29%
  • Premium formats such as freeze-dried treats are projected to gain traction
  • Veterinary-backed preventive care will accelerate adoption of synbiotic solutions

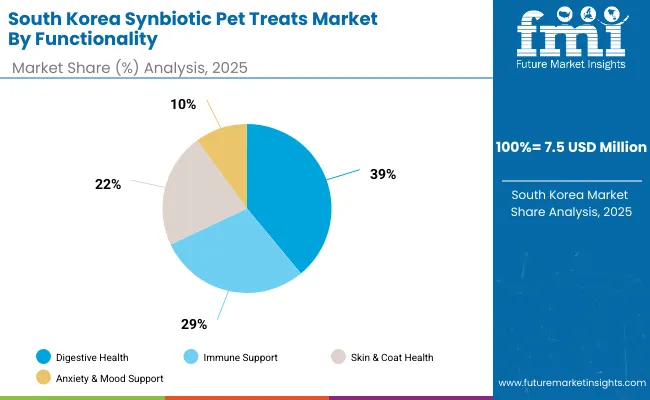
Opportunity Analysis of South Korea Synbiotic Pet Treats Market

Synbiotic Pet Treats Market South Korea

Range Segment Market Value Share, 2025
Digestive Health 39%
Immune Support 29%
Skin & Coat Health 22%
Anxiety & Mood Support 10%

The Synbiotic Pet Treats Market in South Korea is valued at US$ 7.5 million in 2025, representing a meaningful share of East Asia’s market. Digestive health dominates with 39% of revenues, supported by strong consumer interest in gut microbiome balance as a foundation for pet well-being. Immune support holds 29%, reflecting preventive healthcare adoption among pet owners. Skin and coat health, at 22%, remains significant, given the rising awareness of dermatological sensitivities in companion animals. Anxiety and mood support contributes 10%, and although smaller, this niche is gaining attention as urban pet ownership expands. Premium functional claims, coupled with innovative treat formats, are expected to accelerate adoption. South Korea’s advanced retail ecosystems and digitally active consumers are projected to reinforce demand, positioning the market for steady long-term expansion.
  • Market projected at US$ 7.5 million in 2025 (≈21% of East Asia market)
  • Digestive health leads with US$ 2.93 million, highlighting preventive care focus
  • Skin & coat health and immune support remain robust secondary categories
  • Anxiety and mood support expected to expand as urbanization intensifies pet companionship needs

Competitive Landscape of Synbiotic Pet Treats Market

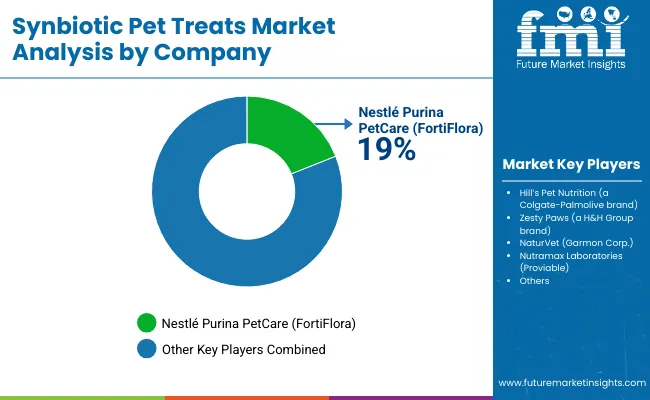
Synbiotic Pet Treats Market By Company

The Synbiotic Pet Treats Market is moderately consolidated, with leading multinational pet nutrition brands, specialized supplement developers, and emerging innovators competing for share. Global leaders such as Nestlé Purina PetCare (FortiFlora) and Hill’s Pet Nutrition (Colgate-Palmolive) dominate, leveraging extensive veterinary networks, trusted science-backed formulations, and strong retail penetration. These players emphasize R&D investment, clinical validation, and premium branding, which continue to reinforce their global leadership positions.

Mid-sized innovators including Zesty Paws (H&H Group) and NaturVet (Garmon Corp.) are actively expanding through e-commerce platforms and direct-to-consumer strategies. Their competitive edge lies in agility, premium functional positioning, and appeal to younger pet owners seeking wellness-focused and lifestyle-aligned products.

Specialized providers such as Nutramax Laboratories (Proviable) maintain influence through targeted probiotic and synbiotic solutions that are widely endorsed by veterinary professionals. Their strength lies in scientific credibility and niche expertise rather than broad-scale distribution.

Competitive differentiation in this market is increasingly shifting from basic functional claims to holistic wellness positioning, covering digestive, immune, and behavioral health. Future competition is expected to revolve around premiumization, multifunctional synbiotic formulations, and digitally enabled distribution models, with partnerships between veterinary professionals and consumer-facing brands enhancing credibility.

Key Developments in Synbiotic Pet Treats Market

  • In July 2025, Purina introduced FortiFlora PRO Synbiotic Action, a veterinary-backed synbiotic powder designed for dogs. By combining prebiotics and probiotics, the product supports digestive balance and immune defense. This launch reinforced Purina’s market leadership and expanded its footprint in science-driven, premium functional pet nutrition.
  • In April 2025, Hill’s Pet Nutrition expanded its Science Diet portfolio with ActivBiome+ Multi-Benefit technology in adult and senior dry foods. This innovation integrated targeted prebiotic fibers and antioxidants to support gut, immune, and organ health, marking a strategic advance in microbiome-led holistic wellness positioning.

Scope of the Report

Item Value
Market Value US$ 356.2 million (2025); US$ 627.3 million (2035); CAGR 5.8% (2025-2035)
Quantitative Units US$ million (value sales)
Pet Type Dogs, Cats, Others (Small Mammals)
Functionality Digestive Health, Immune Support, Skin & Coat Health, Anxiety & Mood Support
Form Soft Chews, Biscuits, Freeze-Dried Treats, Functional Jerky, Powders & Toppings
Regions Covered North America, Europe, East Asia, South Asia & Pacific, Latin America, Middle East & Africa
Countries Covered United States, Canada, Germany, France, United Kingdom, China, Japan, India, South Korea, Brazil
Key Companies Profiled Nestlé Purina PetCare (FortiFlora), Hill’s Pet Nutrition (Colgate-Palmolive), Zesty Paws (H&H Group), NaturVet (Garmon Corp.), Nutramax Laboratories (Proviable)
Additional Attributes Dollar sales by pet type, functionality, and form; segmentation CAGRs; premiumization and science-backed positioning; veterinary endorsement and clinical validation; e-commerce and subscription adoption; regional shares: North America 30%, Europe 28%, South Asia & Pacific 25%, East Asia 12%, Latin America 2%, Middle East & Africa 3%; innovation in multifunctional synbiotics; compliance and labeling trends.
Market Value US$ 356.2 million (2025); US$ 627.3 million (2035); CAGR 5.8% (2025-2035)

Key Segments

By Pet Type:

  • Dogs
  • Cats
  • Others
    • Small Mammals
    • Birds

By Functionality:

  • Digestive Health
  • Immune Support
  • Skin & Coat Health
  • Anxiety & Mood Support

By Form:

  • Soft Chews
  • Biscuits
  • Freeze-Dried Treats
  • Functional Jerky
  • Powders & Toppings

By Probiotic Type:

  • Lactobacillus spp.
  • Bifidobacterium spp.
  • Bacillus spp.
  • Multi-strain Complex

By Prebiotic Source:

  • Inulin
    • Chicory Root
  • FOS (Fructooligosaccharides)
  • MOS (Mannanoligosaccharides)
  • Beta-glucans
  • Mixed Fiber Complex

By Sales Channel:

  • Veterinary Clinics
  • Pet Specialty Stores
  • Online Retail
  • Mass Merchandisers
  • Direct-to-Consumer (DTC)

By Claim/Positioning:

  • Grain-Free
  • Organic
  • Human-Grade Ingredients
  • Non-GMO
  • Hypoallergenic

By Region:

  • North America
  • Latin America
  • Europe
  • East Asia
  • South Asia & Pacific
  • Middle East and Africa

Table of Content

  1. Executive Summary
    • Global Market Outlook
    • Demand-side Trends
    • Supply-side Trends
    • Technology Roadmap Analysis
    • Analysis and Recommendations
  2. Market Overview
    • Market Coverage / Taxonomy
    • Market Definition / Scope / Limitations
  3. Market Background
    • Market Dynamics
      • Drivers
      • Restraints
      • Opportunity
      • Trends
    • Scenario Forecast
      • Demand in Optimistic Scenario
      • Demand in Likely Scenario
      • Demand in Conservative Scenario
    • Opportunity Map Analysis
    • Product Life Cycle Analysis
    • Supply Chain Analysis
    • Investment Feasibility Matrix
    • Value Chain Analysis
    • PESTLE and Porter’s Analysis
    • Regulatory Landscape
    • Regional Parent Market Outlook
    • Production and Consumption Statistics
    • Import and Export Statistics
  4. Global Market Analysis 2020 to 2024 and Forecast, 2025 to 2035
    • Historical Market Size Value (USD Million) & Volume (Units) Analysis, 2020 to 2024
    • Current and Future Market Size Value (USD Million) & Volume (Units) Projections, 2025 to 2035
      • Y-o-Y Growth Trend Analysis
      • Absolute $ Opportunity Analysis
  5. Global Market Pricing Analysis 2020 to 2024 and Forecast 2025 to 2035
  6. Global Market Analysis 2020 to 2024 and Forecast 2025 to 2035, By Pet Type
    • Introduction / Key Findings
    • Historical Market Size Value (USD Million) & Volume (Units) Analysis By Pet Type, 2020 to 2024
    • Current and Future Market Size Value (USD Million) & Volume (Units) Analysis and Forecast By Pet Type, 2025 to 2035
      • Dogs
      • Cats
      • Others
        • Small Mammals
        • Birds
    • Y-o-Y Growth Trend Analysis By Pet Type, 2020 to 2024
    • Absolute $ Opportunity Analysis By Pet Type, 2025 to 2035
  7. Global Market Analysis 2020 to 2024 and Forecast 2025 to 2035, By Functionality
    • Introduction / Key Findings
    • Historical Market Size Value (USD Million) & Volume (Units) Analysis By Functionality, 2020 to 2024
    • Current and Future Market Size Value (USD Million) & Volume (Units) Analysis and Forecast By Functionality, 2025 to 2035
      • Digestive Health
      • Immune Support
      • Skin & Coat Health
      • Anxiety & Mood Support
    • Y-o-Y Growth Trend Analysis By Functionality, 2020 to 2024
    • Absolute $ Opportunity Analysis By Functionality, 2025 to 2035
  8. Global Market Analysis 2020 to 2024 and Forecast 2025 to 2035, By Form
    • Introduction / Key Findings
    • Historical Market Size Value (USD Million) & Volume (Units) Analysis By Form, 2020 to 2024
    • Current and Future Market Size Value (USD Million) & Volume (Units) Analysis and Forecast By Form, 2025 to 2035
      • Soft Chews
      • Biscuits
      • Freeze-Dried Treats
      • Functional Jerky
      • Powders & Toppings
    • Y-o-Y Growth Trend Analysis By Form, 2020 to 2024
    • Absolute $ Opportunity Analysis By Form, 2025 to 2035
  9. Global Market Analysis 2020 to 2024 and Forecast 2025 to 2035, By Probiotic Type
    • Introduction / Key Findings
    • Historical Market Size Value (USD Million) & Volume (Units) Analysis By Probiotic Type, 2020 to 2024
    • Current and Future Market Size Value (USD Million) & Volume (Units) Analysis and Forecast By Probiotic Type, 2025 to 2035
      • Lactobacillus spp.
      • Bifidobacterium spp.
      • Bacillus spp.
      • Multi-strain Complex
    • Y-o-Y Growth Trend Analysis By Probiotic Type, 2020 to 2024
    • Absolute $ Opportunity Analysis By Probiotic Type, 2025 to 2035
  10. Global Market Analysis 2020 to 2024 and Forecast 2025 to 2035, By Prebiotic Source
    • Introduction / Key Findings
    • Historical Market Size Value (USD Million) & Volume (Units) Analysis By Prebiotic Source, 2020 to 2024
    • Current and Future Market Size Value (USD Million) & Volume (Units) Analysis and Forecast By Prebiotic Source, 2025 to 2035
      • Inulin
        • Chicory Root
      • FOS (Fructooligosaccharides)
      • MOS (Mannanoligosaccharides)
      • Beta-glucans
      • Mixed Fiber Complex
    • Y-o-Y Growth Trend Analysis By Prebiotic Source, 2020 to 2024
    • Absolute $ Opportunity Analysis By Prebiotic Source, 2025 to 2035
  11. Global Market Analysis 2020 to 2024 and Forecast 2025 to 2035, By Sales Channel
    • Introduction / Key Findings
    • Historical Market Size Value (USD Million) & Volume (Units) Analysis By Sales Channel, 2020 to 2024
    • Current and Future Market Size Value (USD Million) & Volume (Units) Analysis and Forecast By Sales Channel, 2025 to 2035
      • Veterinary Clinics
      • Pet Specialty Stores
      • Online Retail
      • Mass Merchandisers
      • Direct-to-Consumer (DTC)
    • Y-o-Y Growth Trend Analysis By Sales Channel, 2020 to 2024
    • Absolute $ Opportunity Analysis By Sales Channel, 2025 to 2035
  12. Global Market Analysis 2020 to 2024 and Forecast 2025 to 2035, By Claim/Positioning
    • Introduction / Key Findings
    • Historical Market Size Value (USD Million) & Volume (Units) Analysis By Claim/Positioning, 2020 to 2024
    • Current and Future Market Size Value (USD Million) & Volume (Units) Analysis and Forecast By Claim/Positioning, 2025 to 2035
      • Grain-Free
      • Organic
      • Human-Grade Ingredients
      • Non-GMO
      • Hypoallergenic
    • Y-o-Y Growth Trend Analysis By Claim/Positioning, 2020 to 2024
    • Absolute $ Opportunity Analysis By Claim/Positioning, 2025 to 2035
  13. Global Market Analysis 2020 to 2024 and Forecast 2025 to 2035, By Region
    • Introduction
    • Historical Market Size Value (USD Million) & Volume (Units) Analysis By Region, 2020 to 2024
    • Current Market Size Value (USD Million) & Volume (Units) Analysis and Forecast By Region, 2025 to 2035
      • North America
      • Latin America
      • Europe
      • East Asia
      • South Asia & Pacific
      • Middle East and Africa
    • Market Attractiveness Analysis By Region
  14. North America Market Analysis 2020 to 2024 and Forecast 2025 to 2035, By Country
    • Historical Market Size Value (USD Million) & Volume (Units) Trend Analysis By Market Taxonomy, 2020 to 2024
    • Market Size Value (USD Million) & Volume (Units) Forecast By Market Taxonomy, 2025 to 2035
      • By Country
        • USA
        • Canada
      • By Pet Type
      • By Functionality
      • By Form
      • By Probiotic Type
      • By Prebiotic Source
      • By Sales Channel
      • By Claim/Positioning
    • Market Attractiveness Analysis
      • By Country
      • By Pet Type
      • By Functionality
      • By Form
      • By Probiotic Type
      • By Prebiotic Source
      • By Sales Channel
      • By Claim/Positioning
    • Key Takeaways
  15. Latin America Market Analysis 2020 to 2024 and Forecast 2025 to 2035, By Country
    • Historical Market Size Value (USD Million) & Volume (Units) Trend Analysis By Market Taxonomy, 2020 to 2024
    • Market Size Value (USD Million) & Volume (Units) Forecast By Market Taxonomy, 2025 to 2035
      • By Country
        • Brazil
        • Mexico
        • Colombia
        • Rest of Latin America
      • By Pet Type
      • By Functionality
      • By Form
      • By Probiotic Type
      • By Prebiotic Source
      • By Sales Channel
      • By Claim/Positioning
    • Market Attractiveness Analysis
      • By Country
      • By Pet Type
      • By Functionality
      • By Form
      • By Probiotic Type
      • By Prebiotic Source
      • By Sales Channel
      • By Claim/Positioning
    • Key Takeaways
  16. Europe Market Analysis 2020 to 2024 and Forecast 2025 to 2035, By Country
    • Historical Market Size Value (USD Million) & Volume (Units) Trend Analysis By Market Taxonomy, 2020 to 2024
    • Market Size Value (USD Million) & Volume (Units) Forecast By Market Taxonomy, 2025 to 2035
      • By Country
        • Germany
        • UK
        • France
        • Italy
        • Spain
        • Belgium
        • Netherlands
        • Nordic
        • Switzerland
        • Russia
        • Poland
        • Rest of Europe
      • By Pet Type
      • By Functionality
      • By Form
      • By Probiotic Type
      • By Prebiotic Source
      • By Sales Channel
      • By Claim/Positioning
    • Market Attractiveness Analysis
      • By Country
      • By Pet Type
      • By Functionality
      • By Form
      • By Probiotic Type
      • By Prebiotic Source
      • By Sales Channel
      • By Claim/Positioning
    • Key Takeaways
  17. East Asia Market Analysis 2020 to 2024 and Forecast 2025 to 2035, By Country
    • Historical Market Size Value (USD Million) & Volume (Units) Trend Analysis By Market Taxonomy, 2020 to 2024
    • Market Size Value (USD Million) & Volume (Units) Forecast By Market Taxonomy, 2025 to 2035
      • By Country
        • China
        • Japan
        • South Korea
      • By Pet Type
      • By Functionality
      • By Form
      • By Probiotic Type
      • By Prebiotic Source
      • By Sales Channel
      • By Claim/Positioning
    • Market Attractiveness Analysis
      • By Country
      • By Pet Type
      • By Functionality
      • By Form
      • By Probiotic Type
      • By Prebiotic Source
      • By Sales Channel
      • By Claim/Positioning
    • Key Takeaways
  18. South Asia & Pacific Market Analysis 2020 to 2024 and Forecast 2025 to 2035, By Country
    • Historical Market Size Value (USD Million) & Volume (Units) Trend Analysis By Market Taxonomy, 2020 to 2024
    • Market Size Value (USD Million) & Volume (Units) Forecast By Market Taxonomy, 2025 to 2035
      • By Country
        • India
        • Thailand
        • Malaysia
        • Indonesia
        • Singapore
        • Vietnam
        • Australia
        • New Zealand
        • Rest of South Asia
      • By Pet Type
      • By Functionality
      • By Form
      • By Probiotic Type
      • By Prebiotic Source
      • By Sales Channel
      • By Claim/Positioning
    • Market Attractiveness Analysis
      • By Country
      • By Pet Type
      • By Functionality
      • By Form
      • By Probiotic Type
      • By Prebiotic Source
      • By Sales Channel
      • By Claim/Positioning
    • Key Takeaways
  19. Middle East and Africa Market Analysis 2020 to 2024 and Forecast 2025 to 2035, By Country
    • Historical Market Size Value (USD Million) & Volume (Units) Trend Analysis By Market Taxonomy, 2020 to 2024
    • Market Size Value (USD Million) & Volume (Units) Forecast By Market Taxonomy, 2025 to 2035
      • By Country
        • Turkey
        • UAE
        • Saudi Arabia
        • Israel
        • Other GCC Countries
        • North Africa
        • South Africa
      • By Pet Type
      • By Functionality
      • By Form
      • By Probiotic Type
      • By Prebiotic Source
      • By Sales Channel
      • By Claim/Positioning
    • Market Attractiveness Analysis
      • By Country
      • By Pet Type
      • By Functionality
      • By Form
      • By Probiotic Type
      • By Prebiotic Source
      • By Sales Channel
      • By Claim/Positioning
    • Key Takeaways
  20. Key Countries Market Analysis
    • USA
      • Pricing Analysis
      • Market Share Analysis, 2024
        • By Pet Type
        • By Functionality
        • By Form
        • By Probiotic Type
        • By Prebiotic Source
        • By Sales Channel
        • By Claim/Positioning
    • Canada
      • Pricing Analysis
      • Market Share Analysis, 2024
        • By Pet Type
        • By Functionality
        • By Form
        • By Probiotic Type
        • By Prebiotic Source
        • By Sales Channel
        • By Claim/Positioning
    • Brazil
      • Pricing Analysis
      • Market Share Analysis, 2024
        • By Pet Type
        • By Functionality
        • By Form
        • By Probiotic Type
        • By Prebiotic Source
        • By Sales Channel
        • By Claim/Positioning
    • Mexico
      • Pricing Analysis
      • Market Share Analysis, 2024
        • By Pet Type
        • By Functionality
        • By Form
        • By Probiotic Type
        • By Prebiotic Source
        • By Sales Channel
        • By Claim/Positioning
    • Colombia
      • Pricing Analysis
      • Market Share Analysis, 2024
        • By Pet Type
        • By Functionality
        • By Form
        • By Probiotic Type
        • By Prebiotic Source
        • By Sales Channel
        • By Claim/Positioning
    • Germany
      • Pricing Analysis
      • Market Share Analysis, 2024
        • By Pet Type
        • By Functionality
        • By Form
        • By Probiotic Type
        • By Prebiotic Source
        • By Sales Channel
        • By Claim/Positioning
    • UK
      • Pricing Analysis
      • Market Share Analysis, 2024
        • By Pet Type
        • By Functionality
        • By Form
        • By Probiotic Type
        • By Prebiotic Source
        • By Sales Channel
        • By Claim/Positioning
    • France
      • Pricing Analysis
      • Market Share Analysis, 2024
        • By Pet Type
        • By Functionality
        • By Form
        • By Probiotic Type
        • By Prebiotic Source
        • By Sales Channel
        • By Claim/Positioning
    • Italy
      • Pricing Analysis
      • Market Share Analysis, 2024
        • By Pet Type
        • By Functionality
        • By Form
        • By Probiotic Type
        • By Prebiotic Source
        • By Sales Channel
        • By Claim/Positioning
    • Spain
      • Pricing Analysis
      • Market Share Analysis, 2024
        • By Pet Type
        • By Functionality
        • By Form
        • By Probiotic Type
        • By Prebiotic Source
        • By Sales Channel
        • By Claim/Positioning
    • Belgium
      • Pricing Analysis
      • Market Share Analysis, 2024
        • By Pet Type
        • By Functionality
        • By Form
        • By Probiotic Type
        • By Prebiotic Source
        • By Sales Channel
        • By Claim/Positioning
    • Netherlands
      • Pricing Analysis
      • Market Share Analysis, 2024
        • By Pet Type
        • By Functionality
        • By Form
        • By Probiotic Type
        • By Prebiotic Source
        • By Sales Channel
        • By Claim/Positioning
    • Nordic
      • Pricing Analysis
      • Market Share Analysis, 2024
        • By Pet Type
        • By Functionality
        • By Form
        • By Probiotic Type
        • By Prebiotic Source
        • By Sales Channel
        • By Claim/Positioning
    • Switzerland
      • Pricing Analysis
      • Market Share Analysis, 2024
        • By Pet Type
        • By Functionality
        • By Form
        • By Probiotic Type
        • By Prebiotic Source
        • By Sales Channel
        • By Claim/Positioning
    • Russia
      • Pricing Analysis
      • Market Share Analysis, 2024
        • By Pet Type
        • By Functionality
        • By Form
        • By Probiotic Type
        • By Prebiotic Source
        • By Sales Channel
        • By Claim/Positioning
    • Poland
      • Pricing Analysis
      • Market Share Analysis, 2024
        • By Pet Type
        • By Functionality
        • By Form
        • By Probiotic Type
        • By Prebiotic Source
        • By Sales Channel
        • By Claim/Positioning
    • China
      • Pricing Analysis
      • Market Share Analysis, 2024
        • By Pet Type
        • By Functionality
        • By Form
        • By Probiotic Type
        • By Prebiotic Source
        • By Sales Channel
        • By Claim/Positioning
    • Japan
      • Pricing Analysis
      • Market Share Analysis, 2024
        • By Pet Type
        • By Functionality
        • By Form
        • By Probiotic Type
        • By Prebiotic Source
        • By Sales Channel
        • By Claim/Positioning
    • South Korea
      • Pricing Analysis
      • Market Share Analysis, 2024
        • By Pet Type
        • By Functionality
        • By Form
        • By Probiotic Type
        • By Prebiotic Source
        • By Sales Channel
        • By Claim/Positioning
    • India
      • Pricing Analysis
      • Market Share Analysis, 2024
        • By Pet Type
        • By Functionality
        • By Form
        • By Probiotic Type
        • By Prebiotic Source
        • By Sales Channel
        • By Claim/Positioning
    • Thailand
      • Pricing Analysis
      • Market Share Analysis, 2024
        • By Pet Type
        • By Functionality
        • By Form
        • By Probiotic Type
        • By Prebiotic Source
        • By Sales Channel
        • By Claim/Positioning
    • Malaysia
      • Pricing Analysis
      • Market Share Analysis, 2024
        • By Pet Type
        • By Functionality
        • By Form
        • By Probiotic Type
        • By Prebiotic Source
        • By Sales Channel
        • By Claim/Positioning
    • Indonesia
      • Pricing Analysis
      • Market Share Analysis, 2024
        • By Pet Type
        • By Functionality
        • By Form
        • By Probiotic Type
        • By Prebiotic Source
        • By Sales Channel
        • By Claim/Positioning
    • Singapore
      • Pricing Analysis
      • Market Share Analysis, 2024
        • By Pet Type
        • By Functionality
        • By Form
        • By Probiotic Type
        • By Prebiotic Source
        • By Sales Channel
        • By Claim/Positioning
    • Vietnam
      • Pricing Analysis
      • Market Share Analysis, 2024
        • By Pet Type
        • By Functionality
        • By Form
        • By Probiotic Type
        • By Prebiotic Source
        • By Sales Channel
        • By Claim/Positioning
    • Australia
      • Pricing Analysis
      • Market Share Analysis, 2024
        • By Pet Type
        • By Functionality
        • By Form
        • By Probiotic Type
        • By Prebiotic Source
        • By Sales Channel
        • By Claim/Positioning
    • Turkey
      • Pricing Analysis
      • Market Share Analysis, 2024
        • By Pet Type
        • By Functionality
        • By Form
        • By Probiotic Type
        • By Prebiotic Source
        • By Sales Channel
        • By Claim/Positioning
    • UAE
      • Pricing Analysis
      • Market Share Analysis, 2024
        • By Pet Type
        • By Functionality
        • By Form
        • By Probiotic Type
        • By Prebiotic Source
        • By Sales Channel
        • By Claim/Positioning
  21. Market Structure Analysis
    • Competition Dashboard
    • Competition Benchmarking
    • Market Share Analysis of Top Players
      • By Regional
      • By Pet Type
      • By Functionality
      • By Form
      • By Probiotic Type
      • By Prebiotic Source
      • By Sales Channel
      • By Claim/Positioning
  22. Competition Analysis
    • Competition Deep Dive
      • Nestlé Purina PetCare (FortiFlora)
        • Overview
        • Product Portfolio
        • Profitability by Market Segments (Product/Age /Sales Channel/Region)
        • Sales Footprint
        • Strategy Overview
        • Hill’s Pet Nutrition (a Colgate-Palmolive brand)
        • Zesty Paws (a H&H Group brand)
        • NaturVet (Garmon Corp.)
        • Nutramax Laboratories (Proviable)
    • Assumptions & Acronyms Used
    • Research Methodology

List of Tables

  • Table 1: Global Market Value (USD Million) Forecast by Region, 2020-2035
  • Table 2: Global Market Volume (Units) Forecast by Region, 2020-2035
  • Table 3: Global Market Value (USD Million) Forecast by Pet Type, 2020-2035
  • Table 4: Global Market Volume (Units) Forecast by Pet Type, 2020-2035
  • Table 5: Global Market Value (USD Million) Forecast by Functionality, 2020-2035
  • Table 6: Global Market Volume (Units) Forecast by Functionality, 2020-2035
  • Table 7: Global Market Value (USD Million) Forecast by Form, 2020-2035
  • Table 8: Global Market Volume (Units) Forecast by Form, 2020-2035
  • Table 9: Global Market Value (USD Million) Forecast by Probiotic Type, 2020-2035
  • Table 10: Global Market Volume (Units) Forecast by Probiotic Type, 2020-2035
  • Table 11: Global Market Value (USD Million) Forecast by Prebiotic Source, 2020-2035
  • Table 12: Global Market Volume (Units) Forecast by Prebiotic Source, 2020-2035
  • Table 13: Global Market Value (USD Million) Forecast by Sales Channel, 2020-2035
  • Table 14: Global Market Volume (Units) Forecast by Sales Channel, 2020-2035
  • Table 15: Global Market Value (USD Million) Forecast by Claim/Positioning, 2020-2035
  • Table 16: Global Market Volume (Units) Forecast by Claim/Positioning, 2020-2035
  • Table 17: North America Market Value (USD Million) Forecast by Country, 2020-2035
  • Table 18: North America Market Volume (Units) Forecast by Country, 2020-2035
  • Table 19: North America Market Value (USD Million) Forecast by Pet Type, 2020-2035
  • Table 20: North America Market Volume (Units) Forecast by Pet Type, 2020-2035
  • Table 21: North America Market Value (USD Million) Forecast by Functionality, 2020-2035
  • Table 22: North America Market Volume (Units) Forecast by Functionality, 2020-2035
  • Table 23: North America Market Value (USD Million) Forecast by Form, 2020-2035
  • Table 24: North America Market Volume (Units) Forecast by Form, 2020-2035
  • Table 25: North America Market Value (USD Million) Forecast by Probiotic Type, 2020-2035
  • Table 26: North America Market Volume (Units) Forecast by Probiotic Type, 2020-2035
  • Table 27: North America Market Value (USD Million) Forecast by Prebiotic Source, 2020-2035
  • Table 28: North America Market Volume (Units) Forecast by Prebiotic Source, 2020-2035
  • Table 29: North America Market Value (USD Million) Forecast by Sales Channel, 2020-2035
  • Table 30: North America Market Volume (Units) Forecast by Sales Channel, 2020-2035
  • Table 31: North America Market Value (USD Million) Forecast by Claim/Positioning, 2020-2035
  • Table 32: North America Market Volume (Units) Forecast by Claim/Positioning, 2020-2035
  • Table 33: Latin America Market Value (USD Million) Forecast by Country, 2020-2035
  • Table 34: Latin America Market Volume (Units) Forecast by Country, 2020-2035
  • Table 35: Latin America Market Value (USD Million) Forecast by Pet Type, 2020-2035
  • Table 36: Latin America Market Volume (Units) Forecast by Pet Type, 2020-2035
  • Table 37: Latin America Market Value (USD Million) Forecast by Functionality, 2020-2035
  • Table 38: Latin America Market Volume (Units) Forecast by Functionality, 2020-2035
  • Table 39: Latin America Market Value (USD Million) Forecast by Form, 2020-2035
  • Table 40: Latin America Market Volume (Units) Forecast by Form, 2020-2035
  • Table 41: Latin America Market Value (USD Million) Forecast by Probiotic Type, 2020-2035
  • Table 42: Latin America Market Volume (Units) Forecast by Probiotic Type, 2020-2035
  • Table 43: Latin America Market Value (USD Million) Forecast by Prebiotic Source, 2020-2035
  • Table 44: Latin America Market Volume (Units) Forecast by Prebiotic Source, 2020-2035
  • Table 45: Latin America Market Value (USD Million) Forecast by Sales Channel, 2020-2035
  • Table 46: Latin America Market Volume (Units) Forecast by Sales Channel, 2020-2035
  • Table 47: Latin America Market Value (USD Million) Forecast by Claim/Positioning, 2020-2035
  • Table 48: Latin America Market Volume (Units) Forecast by Claim/Positioning, 2020-2035
  • Table 49: Europe Market Value (USD Million) Forecast by Country, 2020-2035
  • Table 50: Europe Market Volume (Units) Forecast by Country, 2020-2035
  • Table 51: Europe Market Value (USD Million) Forecast by Pet Type, 2020-2035
  • Table 52: Europe Market Volume (Units) Forecast by Pet Type, 2020-2035
  • Table 53: Europe Market Value (USD Million) Forecast by Functionality, 2020-2035
  • Table 54: Europe Market Volume (Units) Forecast by Functionality, 2020-2035
  • Table 55: Europe Market Value (USD Million) Forecast by Form, 2020-2035
  • Table 56: Europe Market Volume (Units) Forecast by Form, 2020-2035
  • Table 57: Europe Market Value (USD Million) Forecast by Probiotic Type, 2020-2035
  • Table 58: Europe Market Volume (Units) Forecast by Probiotic Type, 2020-2035
  • Table 59: Europe Market Value (USD Million) Forecast by Prebiotic Source, 2020-2035
  • Table 60: Europe Market Volume (Units) Forecast by Prebiotic Source, 2020-2035
  • Table 61: Europe Market Value (USD Million) Forecast by Sales Channel, 2020-2035
  • Table 62: Europe Market Volume (Units) Forecast by Sales Channel, 2020-2035
  • Table 63: Europe Market Value (USD Million) Forecast by Claim/Positioning, 2020-2035
  • Table 64: Europe Market Volume (Units) Forecast by Claim/Positioning, 2020-2035
  • Table 65: East Asia Market Value (USD Million) Forecast by Country, 2020-2035
  • Table 66: East Asia Market Volume (Units) Forecast by Country, 2020-2035
  • Table 67: East Asia Market Value (USD Million) Forecast by Pet Type, 2020-2035
  • Table 68: East Asia Market Volume (Units) Forecast by Pet Type, 2020-2035
  • Table 69: East Asia Market Value (USD Million) Forecast by Functionality, 2020-2035
  • Table 70: East Asia Market Volume (Units) Forecast by Functionality, 2020-2035
  • Table 71: East Asia Market Value (USD Million) Forecast by Form, 2020-2035
  • Table 72: East Asia Market Volume (Units) Forecast by Form, 2020-2035
  • Table 73: East Asia Market Value (USD Million) Forecast by Probiotic Type, 2020-2035
  • Table 74: East Asia Market Volume (Units) Forecast by Probiotic Type, 2020-2035
  • Table 75: East Asia Market Value (USD Million) Forecast by Prebiotic Source, 2020-2035
  • Table 76: East Asia Market Volume (Units) Forecast by Prebiotic Source, 2020-2035
  • Table 77: East Asia Market Value (USD Million) Forecast by Sales Channel, 2020-2035
  • Table 78: East Asia Market Volume (Units) Forecast by Sales Channel, 2020-2035
  • Table 79: East Asia Market Value (USD Million) Forecast by Claim/Positioning, 2020-2035
  • Table 80: East Asia Market Volume (Units) Forecast by Claim/Positioning, 2020-2035
  • Table 81: South Asia & Pacific Market Value (USD Million) Forecast by Country, 2020-2035
  • Table 82: South Asia & Pacific Market Volume (Units) Forecast by Country, 2020-2035
  • Table 83: South Asia & Pacific Market Value (USD Million) Forecast by Pet Type, 2020-2035
  • Table 84: South Asia & Pacific Market Volume (Units) Forecast by Pet Type, 2020-2035
  • Table 85: South Asia & Pacific Market Value (USD Million) Forecast by Functionality, 2020-2035
  • Table 86: South Asia & Pacific Market Volume (Units) Forecast by Functionality, 2020-2035
  • Table 87: South Asia & Pacific Market Value (USD Million) Forecast by Form, 2020-2035
  • Table 88: South Asia & Pacific Market Volume (Units) Forecast by Form, 2020-2035
  • Table 89: South Asia & Pacific Market Value (USD Million) Forecast by Probiotic Type, 2020-2035
  • Table 90: South Asia & Pacific Market Volume (Units) Forecast by Probiotic Type, 2020-2035
  • Table 91: South Asia & Pacific Market Value (USD Million) Forecast by Prebiotic Source, 2020-2035
  • Table 92: South Asia & Pacific Market Volume (Units) Forecast by Prebiotic Source, 2020-2035
  • Table 93: South Asia & Pacific Market Value (USD Million) Forecast by Sales Channel, 2020-2035
  • Table 94: South Asia & Pacific Market Volume (Units) Forecast by Sales Channel, 2020-2035
  • Table 95: South Asia & Pacific Market Value (USD Million) Forecast by Claim/Positioning, 2020-2035
  • Table 96: South Asia & Pacific Market Volume (Units) Forecast by Claim/Positioning, 2020-2035
  • Table 97: Middle East and Africa Market Value (USD Million) Forecast by Country, 2020-2035
  • Table 98: Middle East and Africa Market Volume (Units) Forecast by Country, 2020-2035
  • Table 99: Middle East and Africa Market Value (USD Million) Forecast by Pet Type, 2020-2035
  • Table 100: Middle East and Africa Market Volume (Units) Forecast by Pet Type, 2020-2035
  • Table 101: Middle East and Africa Market Value (USD Million) Forecast by Functionality, 2020-2035
  • Table 102: Middle East and Africa Market Volume (Units) Forecast by Functionality, 2020-2035
  • Table 103: Middle East and Africa Market Value (USD Million) Forecast by Form, 2020-2035
  • Table 104: Middle East and Africa Market Volume (Units) Forecast by Form, 2020-2035
  • Table 105: Middle East and Africa Market Value (USD Million) Forecast by Probiotic Type, 2020-2035
  • Table 106: Middle East and Africa Market Volume (Units) Forecast by Probiotic Type, 2020-2035
  • Table 107: Middle East and Africa Market Value (USD Million) Forecast by Prebiotic Source, 2020-2035
  • Table 108: Middle East and Africa Market Volume (Units) Forecast by Prebiotic Source, 2020-2035
  • Table 109: Middle East and Africa Market Value (USD Million) Forecast by Sales Channel, 2020-2035
  • Table 110: Middle East and Africa Market Volume (Units) Forecast by Sales Channel, 2020-2035
  • Table 111: Middle East and Africa Market Value (USD Million) Forecast by Claim/Positioning, 2020-2035
  • Table 112: Middle East and Africa Market Volume (Units) Forecast by Claim/Positioning, 2020-2035

List of Figures

  • Figure 1: Global Market Volume (Units) Forecast 2020-2035
  • Figure 2: Global Market Pricing Analysis
  • Figure 3: Global Market Value (USD Million) Forecast 2020-2035
  • Figure 4: Global Market Value Share and BPS Analysis by Pet Type, 2025 and 2035
  • Figure 5: Global Market Y-o-Y Growth Comparison by Pet Type, 2025-2035
  • Figure 6: Global Market Attractiveness Analysis by Pet Type
  • Figure 7: Global Market Value Share and BPS Analysis by Functionality, 2025 and 2035
  • Figure 8: Global Market Y-o-Y Growth Comparison by Functionality, 2025-2035
  • Figure 9: Global Market Attractiveness Analysis by Functionality
  • Figure 10: Global Market Value Share and BPS Analysis by Form, 2025 and 2035
  • Figure 11: Global Market Y-o-Y Growth Comparison by Form, 2025-2035
  • Figure 12: Global Market Attractiveness Analysis by Form
  • Figure 13: Global Market Value Share and BPS Analysis by Probiotic Type, 2025 and 2035
  • Figure 14: Global Market Y-o-Y Growth Comparison by Probiotic Type, 2025-2035
  • Figure 15: Global Market Attractiveness Analysis by Probiotic Type
  • Figure 16: Global Market Value Share and BPS Analysis by Prebiotic Source, 2025 and 2035
  • Figure 17: Global Market Y-o-Y Growth Comparison by Prebiotic Source, 2025-2035
  • Figure 18: Global Market Attractiveness Analysis by Prebiotic Source
  • Figure 19: Global Market Value Share and BPS Analysis by Sales Channel, 2025 and 2035
  • Figure 20: Global Market Y-o-Y Growth Comparison by Sales Channel, 2025-2035
  • Figure 21: Global Market Attractiveness Analysis by Sales Channel
  • Figure 22: Global Market Value Share and BPS Analysis by Claim/Positioning, 2025 and 2035
  • Figure 23: Global Market Y-o-Y Growth Comparison by Claim/Positioning, 2025-2035
  • Figure 24: Global Market Attractiveness Analysis by Claim/Positioning
  • Figure 25: Global Market Value (USD Million) Share and BPS Analysis by Region, 2025 and 2035
  • Figure 26: Global Market Y-o-Y Growth Comparison by Region, 2025-2035
  • Figure 27: Global Market Attractiveness Analysis by Region
  • Figure 28: North America Market Incremental $ Opportunity, 2025-2035
  • Figure 29: Latin America Market Incremental $ Opportunity, 2025-2035
  • Figure 30: Europe Market Incremental $ Opportunity, 2025-2035
  • Figure 31: East Asia Market Incremental $ Opportunity, 2025-2035
  • Figure 32: South Asia & Pacific Market Incremental $ Opportunity, 2025-2035
  • Figure 33: Middle East and Africa Market Incremental $ Opportunity, 2025-2035
  • Figure 34: North America Market Value Share and BPS Analysis by Country, 2025 and 2035
  • Figure 35: North America Market Value Share and BPS Analysis by Pet Type, 2025 and 2035
  • Figure 36: North America Market Y-o-Y Growth Comparison by Pet Type, 2025-2035
  • Figure 37: North America Market Attractiveness Analysis by Pet Type
  • Figure 38: North America Market Value Share and BPS Analysis by Functionality, 2025 and 2035
  • Figure 39: North America Market Y-o-Y Growth Comparison by Functionality, 2025-2035
  • Figure 40: North America Market Attractiveness Analysis by Functionality
  • Figure 41: North America Market Value Share and BPS Analysis by Form, 2025 and 2035
  • Figure 42: North America Market Y-o-Y Growth Comparison by Form, 2025-2035
  • Figure 43: North America Market Attractiveness Analysis by Form
  • Figure 44: North America Market Value Share and BPS Analysis by Probiotic Type, 2025 and 2035
  • Figure 45: North America Market Y-o-Y Growth Comparison by Probiotic Type, 2025-2035
  • Figure 46: North America Market Attractiveness Analysis by Probiotic Type
  • Figure 47: North America Market Value Share and BPS Analysis by Prebiotic Source, 2025 and 2035
  • Figure 48: North America Market Y-o-Y Growth Comparison by Prebiotic Source, 2025-2035
  • Figure 49: North America Market Attractiveness Analysis by Prebiotic Source
  • Figure 50: North America Market Value Share and BPS Analysis by Sales Channel, 2025 and 2035
  • Figure 51: North America Market Y-o-Y Growth Comparison by Sales Channel, 2025-2035
  • Figure 52: North America Market Attractiveness Analysis by Sales Channel
  • Figure 53: North America Market Value Share and BPS Analysis by Claim/Positioning, 2025 and 2035
  • Figure 54: North America Market Y-o-Y Growth Comparison by Claim/Positioning, 2025-2035
  • Figure 55: North America Market Attractiveness Analysis by Claim/Positioning
  • Figure 56: Latin America Market Value Share and BPS Analysis by Country, 2025 and 2035
  • Figure 57: Latin America Market Value Share and BPS Analysis by Pet Type, 2025 and 2035
  • Figure 58: Latin America Market Y-o-Y Growth Comparison by Pet Type, 2025-2035
  • Figure 59: Latin America Market Attractiveness Analysis by Pet Type
  • Figure 60: Latin America Market Value Share and BPS Analysis by Functionality, 2025 and 2035
  • Figure 61: Latin America Market Y-o-Y Growth Comparison by Functionality, 2025-2035
  • Figure 62: Latin America Market Attractiveness Analysis by Functionality
  • Figure 63: Latin America Market Value Share and BPS Analysis by Form, 2025 and 2035
  • Figure 64: Latin America Market Y-o-Y Growth Comparison by Form, 2025-2035
  • Figure 65: Latin America Market Attractiveness Analysis by Form
  • Figure 66: Latin America Market Value Share and BPS Analysis by Probiotic Type, 2025 and 2035
  • Figure 67: Latin America Market Y-o-Y Growth Comparison by Probiotic Type, 2025-2035
  • Figure 68: Latin America Market Attractiveness Analysis by Probiotic Type
  • Figure 69: Latin America Market Value Share and BPS Analysis by Prebiotic Source, 2025 and 2035
  • Figure 70: Latin America Market Y-o-Y Growth Comparison by Prebiotic Source, 2025-2035
  • Figure 71: Latin America Market Attractiveness Analysis by Prebiotic Source
  • Figure 72: Latin America Market Value Share and BPS Analysis by Sales Channel, 2025 and 2035
  • Figure 73: Latin America Market Y-o-Y Growth Comparison by Sales Channel, 2025-2035
  • Figure 74: Latin America Market Attractiveness Analysis by Sales Channel
  • Figure 75: Latin America Market Value Share and BPS Analysis by Claim/Positioning, 2025 and 2035
  • Figure 76: Latin America Market Y-o-Y Growth Comparison by Claim/Positioning, 2025-2035
  • Figure 77: Latin America Market Attractiveness Analysis by Claim/Positioning
  • Figure 78: Europe Market Value Share and BPS Analysis by Country, 2025 and 2035
  • Figure 79: Europe Market Value Share and BPS Analysis by Pet Type, 2025 and 2035
  • Figure 80: Europe Market Y-o-Y Growth Comparison by Pet Type, 2025-2035
  • Figure 81: Europe Market Attractiveness Analysis by Pet Type
  • Figure 82: Europe Market Value Share and BPS Analysis by Functionality, 2025 and 2035
  • Figure 83: Europe Market Y-o-Y Growth Comparison by Functionality, 2025-2035
  • Figure 84: Europe Market Attractiveness Analysis by Functionality
  • Figure 85: Europe Market Value Share and BPS Analysis by Form, 2025 and 2035
  • Figure 86: Europe Market Y-o-Y Growth Comparison by Form, 2025-2035
  • Figure 87: Europe Market Attractiveness Analysis by Form
  • Figure 88: Europe Market Value Share and BPS Analysis by Probiotic Type, 2025 and 2035
  • Figure 89: Europe Market Y-o-Y Growth Comparison by Probiotic Type, 2025-2035
  • Figure 90: Europe Market Attractiveness Analysis by Probiotic Type
  • Figure 91: Europe Market Value Share and BPS Analysis by Prebiotic Source, 2025 and 2035
  • Figure 92: Europe Market Y-o-Y Growth Comparison by Prebiotic Source, 2025-2035
  • Figure 93: Europe Market Attractiveness Analysis by Prebiotic Source
  • Figure 94: Europe Market Value Share and BPS Analysis by Sales Channel, 2025 and 2035
  • Figure 95: Europe Market Y-o-Y Growth Comparison by Sales Channel, 2025-2035
  • Figure 96: Europe Market Attractiveness Analysis by Sales Channel
  • Figure 97: Europe Market Value Share and BPS Analysis by Claim/Positioning, 2025 and 2035
  • Figure 98: Europe Market Y-o-Y Growth Comparison by Claim/Positioning, 2025-2035
  • Figure 99: Europe Market Attractiveness Analysis by Claim/Positioning
  • Figure 100: East Asia Market Value Share and BPS Analysis by Country, 2025 and 2035
  • Figure 101: East Asia Market Value Share and BPS Analysis by Pet Type, 2025 and 2035
  • Figure 102: East Asia Market Y-o-Y Growth Comparison by Pet Type, 2025-2035
  • Figure 103: East Asia Market Attractiveness Analysis by Pet Type
  • Figure 104: East Asia Market Value Share and BPS Analysis by Functionality, 2025 and 2035
  • Figure 105: East Asia Market Y-o-Y Growth Comparison by Functionality, 2025-2035
  • Figure 106: East Asia Market Attractiveness Analysis by Functionality
  • Figure 107: East Asia Market Value Share and BPS Analysis by Form, 2025 and 2035
  • Figure 108: East Asia Market Y-o-Y Growth Comparison by Form, 2025-2035
  • Figure 109: East Asia Market Attractiveness Analysis by Form
  • Figure 110: East Asia Market Value Share and BPS Analysis by Probiotic Type, 2025 and 2035
  • Figure 111: East Asia Market Y-o-Y Growth Comparison by Probiotic Type, 2025-2035
  • Figure 112: East Asia Market Attractiveness Analysis by Probiotic Type
  • Figure 113: East Asia Market Value Share and BPS Analysis by Prebiotic Source, 2025 and 2035
  • Figure 114: East Asia Market Y-o-Y Growth Comparison by Prebiotic Source, 2025-2035
  • Figure 115: East Asia Market Attractiveness Analysis by Prebiotic Source
  • Figure 116: East Asia Market Value Share and BPS Analysis by Sales Channel, 2025 and 2035
  • Figure 117: East Asia Market Y-o-Y Growth Comparison by Sales Channel, 2025-2035
  • Figure 118: East Asia Market Attractiveness Analysis by Sales Channel
  • Figure 119: East Asia Market Value Share and BPS Analysis by Claim/Positioning, 2025 and 2035
  • Figure 120: East Asia Market Y-o-Y Growth Comparison by Claim/Positioning, 2025-2035
  • Figure 121: East Asia Market Attractiveness Analysis by Claim/Positioning
  • Figure 122: South Asia & Pacific Market Value Share and BPS Analysis by Country, 2025 and 2035
  • Figure 123: South Asia & Pacific Market Value Share and BPS Analysis by Pet Type, 2025 and 2035
  • Figure 124: South Asia & Pacific Market Y-o-Y Growth Comparison by Pet Type, 2025-2035
  • Figure 125: South Asia & Pacific Market Attractiveness Analysis by Pet Type
  • Figure 126: South Asia & Pacific Market Value Share and BPS Analysis by Functionality, 2025 and 2035
  • Figure 127: South Asia & Pacific Market Y-o-Y Growth Comparison by Functionality, 2025-2035
  • Figure 128: South Asia & Pacific Market Attractiveness Analysis by Functionality
  • Figure 129: South Asia & Pacific Market Value Share and BPS Analysis by Form, 2025 and 2035
  • Figure 130: South Asia & Pacific Market Y-o-Y Growth Comparison by Form, 2025-2035
  • Figure 131: South Asia & Pacific Market Attractiveness Analysis by Form
  • Figure 132: South Asia & Pacific Market Value Share and BPS Analysis by Probiotic Type, 2025 and 2035
  • Figure 133: South Asia & Pacific Market Y-o-Y Growth Comparison by Probiotic Type, 2025-2035
  • Figure 134: South Asia & Pacific Market Attractiveness Analysis by Probiotic Type
  • Figure 135: South Asia & Pacific Market Value Share and BPS Analysis by Prebiotic Source, 2025 and 2035
  • Figure 136: South Asia & Pacific Market Y-o-Y Growth Comparison by Prebiotic Source, 2025-2035
  • Figure 137: South Asia & Pacific Market Attractiveness Analysis by Prebiotic Source
  • Figure 138: South Asia & Pacific Market Value Share and BPS Analysis by Sales Channel, 2025 and 2035
  • Figure 139: South Asia & Pacific Market Y-o-Y Growth Comparison by Sales Channel, 2025-2035
  • Figure 140: South Asia & Pacific Market Attractiveness Analysis by Sales Channel
  • Figure 141: South Asia & Pacific Market Value Share and BPS Analysis by Claim/Positioning, 2025 and 2035
  • Figure 142: South Asia & Pacific Market Y-o-Y Growth Comparison by Claim/Positioning, 2025-2035
  • Figure 143: South Asia & Pacific Market Attractiveness Analysis by Claim/Positioning
  • Figure 144: Middle East and Africa Market Value Share and BPS Analysis by Country, 2025 and 2035
  • Figure 145: Middle East and Africa Market Value Share and BPS Analysis by Pet Type, 2025 and 2035
  • Figure 146: Middle East and Africa Market Y-o-Y Growth Comparison by Pet Type, 2025-2035
  • Figure 147: Middle East and Africa Market Attractiveness Analysis by Pet Type
  • Figure 148: Middle East and Africa Market Value Share and BPS Analysis by Functionality, 2025 and 2035
  • Figure 149: Middle East and Africa Market Y-o-Y Growth Comparison by Functionality, 2025-2035
  • Figure 150: Middle East and Africa Market Attractiveness Analysis by Functionality
  • Figure 151: Middle East and Africa Market Value Share and BPS Analysis by Form, 2025 and 2035
  • Figure 152: Middle East and Africa Market Y-o-Y Growth Comparison by Form, 2025-2035
  • Figure 153: Middle East and Africa Market Attractiveness Analysis by Form
  • Figure 154: Middle East and Africa Market Value Share and BPS Analysis by Probiotic Type, 2025 and 2035
  • Figure 155: Middle East and Africa Market Y-o-Y Growth Comparison by Probiotic Type, 2025-2035
  • Figure 156: Middle East and Africa Market Attractiveness Analysis by Probiotic Type
  • Figure 157: Middle East and Africa Market Value Share and BPS Analysis by Prebiotic Source, 2025 and 2035
  • Figure 158: Middle East and Africa Market Y-o-Y Growth Comparison by Prebiotic Source, 2025-2035
  • Figure 159: Middle East and Africa Market Attractiveness Analysis by Prebiotic Source
  • Figure 160: Middle East and Africa Market Value Share and BPS Analysis by Sales Channel, 2025 and 2035
  • Figure 161: Middle East and Africa Market Y-o-Y Growth Comparison by Sales Channel, 2025-2035
  • Figure 162: Middle East and Africa Market Attractiveness Analysis by Sales Channel
  • Figure 163: Middle East and Africa Market Value Share and BPS Analysis by Claim/Positioning, 2025 and 2035
  • Figure 164: Middle East and Africa Market Y-o-Y Growth Comparison by Claim/Positioning, 2025-2035
  • Figure 165: Middle East and Africa Market Attractiveness Analysis by Claim/Positioning
  • Figure 166: Global Market - Tier Structure Analysis
  • Figure 167: Global Market - Company Share Analysis

Frequently Asked Questions

How big is the Synbiotic Pet Treats Market in 2025?

The global Synbiotic Pet Treats Market is estimated to be valued at US$ 356.2 million in 2025.

What will be the size of the Synbiotic Pet Treats Market in 2035?

The market size for the Synbiotic Pet Treats Market is projected to reach US$ 627.3 million by 2035.

How much will the Synbiotic Pet Treats Market grow between 2025 and 2035?

The Synbiotic Pet Treats Market is expected to expand at a CAGR of 5.8% between 2025 and 2035.

What are the key product types in the Synbiotic Pet Treats Market?

The key product types in the Synbiotic Pet Treats Market are soft chews, biscuits, freeze-dried treats, functional jerky, and powders & toppings.

Which pet type will contribute a significant share in the Synbiotic Pet Treats Market in 2025?

In terms of pet type, the dog segment is expected to command 68% share in the Synbiotic Pet Treats Market in 2025.

Explore Similar Insights

Future Market Insights

Synbiotic Pet Treats Market

Chat With

MaRIA

Hi There, I am MaRIA, Your Market Research Intelligence Assistant. How may I help you?