
- Market Size (2026)
- USD 486.7 Mn
- Forecast (2036)
- USD 1003.1 Mn
- CAGR (2026 to 2036)
- 7.5%
How big is the Synbiotic Animal Feed Market in 2026?
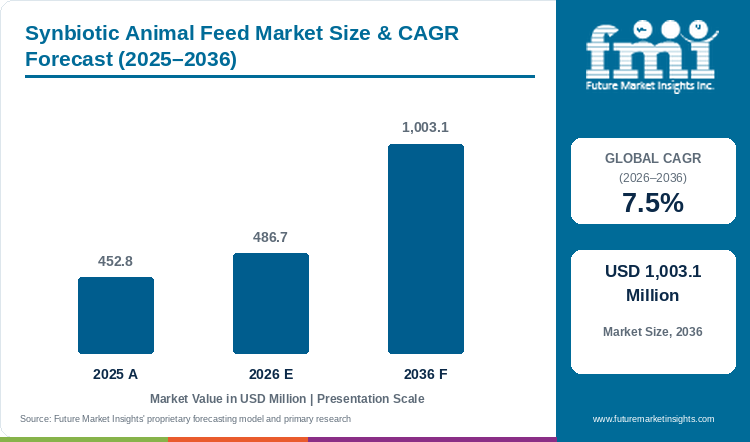
The Synbiotic Animal Feed Market is projected to reach USD 1,003.1 million by 2036, growing at a 7.5% CAGR from 2026 to 2036. F
MI estimates the market at USD 486.7 million in 2026, after it was valued at USD 452.8 million in 2025. Demand rests on pressure to cut antibiotic use, because livestock farming uses 73% of all antibiotics worldwide, according to Evonik. A synbiotic answers that pressure by pairing a live probiotic with a prebiotic fibre that feeds it. Global probiotic sales in animal feed reached around USD 4.0 billion in 2025 and are growing about 7.0% a year. Synbiotics are a smaller part of that pool, growing at a 7.5% CAGR to 2036.
WOAH reports antimicrobial use fell 5% to 97 mg per kilogram of animal biomass between 2020 and 2022. Europe cut use by 23%, the Americas by 4% and Asia and the Pacific by only 2%. A UCL study found cuts of 29% in China and 28% in the United States by 2020. United States sales of medically important antimicrobials then rose 16% in 2024 after stable volumes since 2017. India's antimicrobial footprint rose 16% over the decade, so replacement demand sits mainly in Asia, not Europe.
Key Market Trends & Insights
- From 3 September 2026 the EU requires exporting countries to meet two antimicrobial restrictions. Animals intended for export to the EU must receive no antimicrobials for growth promotion and none reserved for human medicine. Brazil was left off the authorised list for animal products including beef, poultry meat and honey.
- Producers are upgrading the quality of animal feed probiotics, the live component of synbiotic blends. One supplier reports that its Ecobiol PRO raised survival by 50.0% in broilers exposed to Clostridium perfringens, against a standard probiotic. FMI expects buyers to compare strains on proven outgrowth and field results.
- Animal nutrition portfolios are being reshaped. dsm-firmenich agreed on 9 February 2026 to sell its Animal Nutrition & Health business to CVC. The enterprise value is about EUR 2.2 billion. The seller had earlier sold its feed enzymes activities to Novonesis for EUR 1.5 billion in 2025. The business will split into two standalone companies named Noviwest and Panavora on 22 October 2026.
Regional Highlights
- In Latin America, Brazil produced 89.9 million tonnes of compound feed in 2025, up 2.8%. The EU left Brazil off its authorised list for several animal products, which raises the value of compliant feed programmes.
- In Asia, large commercial feed volumes meet strict antibiotic policy, with China and India both expanding commercial feed output.
Synbiotic Animal Feed Market Size and Forecast
Table 1: Synbiotic Animal Feed Market Size and Forecast
| Market size and forecast | Value |
|---|---|
| Market size in 2025 | USD 452.8 million |
| Estimated market size in 2026 | USD 486.7 million |
| Projected market size by 2036 | USD 1,003.1 million |
| CAGR from 2026 to 2036 | 7.5% |
Source: Future Market Insights analysis of the synbiotic animal feed market, 2026.
Analyst Perspective
“Feed mills and integrators buy synbiotics for antibiotic-reduction programmes. They judge products on feed conversion, mortality and cost per tonne of feed. Suppliers with documented field trials, regulatory approvals and a presence in the main producing countries can win multi-year contracts. Regulation is the main commercial driver, and each new approval decides which species and countries a product may serve.”
- Nandini Roy Choudhury, Principal Analyst at Future Market Insights
How is the Synbiotic Animal Feed Market segmented?
- By animal type: Poultry, Swine, Aquaculture, Ruminants, Pets and equine.
- By microbial source: Bacteria-based, Yeast and other non-bacterial.
- By form: Powder, Liquid, Granules, Capsules, Cubes.
- By region: North America, Latin America, Europe, East Asia, South Asia, Oceania, Middle East and Africa.
Why does Poultry lead by Animal Type in the Synbiotic Animal Feed Market in 2026?
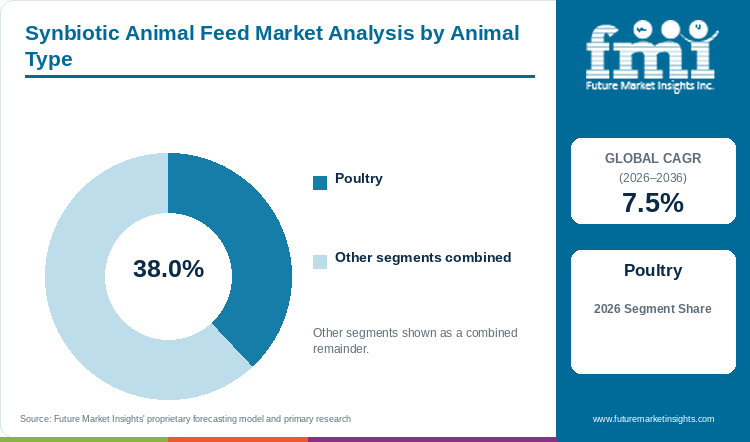
Poultry is estimated to account for 38.0% of the Synbiotic Animal Feed Market by animal type in 2026.
Broiler feed reached 400.4 million tonnes and layer feed 180.1 million tonnes in 2025, against 380.9 million tonnes for pigs. Subclinical necrotic enteritis costs poultry USD 4.0 billion to USD 6.0 billion a year worldwide, according to Evonik. The other four animal types together hold the remaining 62.0%. Aquaculture feed reached 55.5 million tonnes and grew 4.7%, the fastest of any species group.
Table 2: Animal Type, 2026 Share
| Leading Share | 2026 market share |
|---|---|
| Poultry | 38.0% |
| All Other Segments Combined Share | 62.0% |
Source: Future Market Insights analysis of the synbiotic animal feed market, 2026.
Why do Bacteria-based products lead by Microbial Source in the Synbiotic Animal Feed Market in 2026?
Bacteria-based products are estimated to account for 82.0% of the Synbiotic Animal Feed Market by microbial source in 2026.
Spore-forming Bacillus strains survive feed processing and storage, which makes them practical for feed mills. One Bacillus velezensis strain already holds EU approval as a gut flora stabiliser for pigs. Yeast and other non-bacterial products hold the remaining 18.0%. They are used for ruminants and in some aquaculture programmes, where yeast cell wall fractions act as prebiotics and immune support.
Table 3: Microbial Source, 2026 Share
| Leading Share | 2026 market share |
|---|---|
| Bacteria-based | 82.0% |
| All Other Segments Combined Share | 18.0% |
Source: Future Market Insights analysis of the synbiotic animal feed market, 2026.
Why does Powder lead by Form in the Synbiotic Animal Feed Market in 2026?
Powder is estimated to account for 32.0% of the Synbiotic Animal Feed Market by form in 2026.
Powders blend easily into premixes and compound feed, keep longer than liquids and cost less to store and ship. Feed mills already have mixers and premix lines built for dry additives. Compound feed is the main route to market, with global production at 1.44 billion tonnes in 2025. Liquid, granules, capsules and cubes together hold the remaining 68.0%. Granules suit spore-forming strains in pelleted feed, and liquids go on after pelleting or into drinking water. Capsules and cubes serve pets and equine owners, where tonnage is small but prices per kilogram are higher.
Table 4: Form, 2026 Share
| Leading Share | 2026 market share |
|---|---|
| Powder | 32.0% |
| All Other Segments Combined Share | 68.0% |
Source: Future Market Insights analysis of the synbiotic animal feed market, 2026.
What are the key drivers, restraints and opportunities?
Driver
Antibiotic restrictions on producers and exporters. Rules against antibiotic growth promoters are widening. China ended feed with growth-promoting drugs in 2020. EU sales of veterinary antimicrobials were 89.6 mg per population correction unit in 2024. That is 24.3% below 2018 but the second year of increase, so pressure to cut further remains.
Feed volume growth in intensive production. Global feed production rose 2.9% in 2025, with broiler and pig feed growing 3.7% and 3.0%. More compound feed means more places to add a gut health product.
Restraint
Variable farm results and trial cost. Results vary with feed composition, and one supplier reports that competing Bacillus products were slower or more variable across feed types. Supplier claims rest on trials, such as the university challenge study behind a 50.0% gain in broiler survival.
Authorisation by species and country. Each strain needs approval for specific animal categories. One Bacillus velezensis strain gained EU approval for all pig categories in December 2024. Earlier approval covered sows and weaned piglets only. Species claims therefore arrive in steps, so each new animal category needs its own approval.
Opportunity
Export-driven compliance programmes. Exporting countries must show that animals received no growth-promoting antimicrobials and none reserved for human medicine. The Commission audited Brazil on site from 24 August to 4 September 2026. FMI expects producers facing such audits to test alternatives, including probiotics, prebiotics and synbiotics.
Aquaculture and Asian growth. Commercial feed use is expanding in aquaculture, China and India, so synbiotic suppliers with local registrations can enter early.
Synbiotic Animal Feed Market by Country (2026 to 2036)
Table 5: Synbiotic Animal Feed Market Country Growth Forecast
| Country | CAGR, 2026 to 2036 |
|---|---|
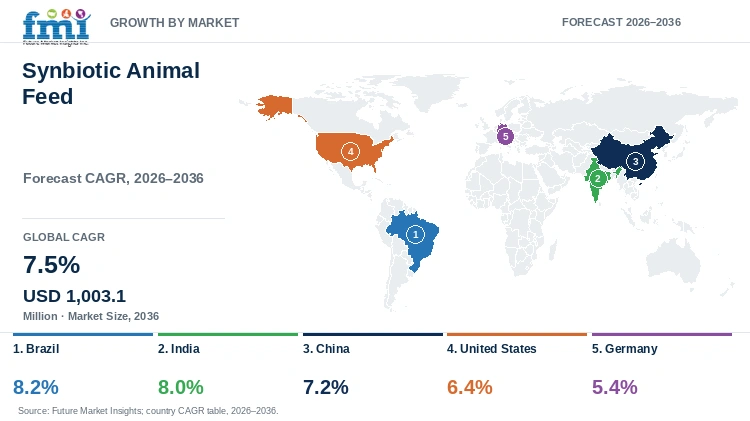
| Brazil | 8.2% |
| India | 8.0% |
| China | 7.2% |
| United States | 6.4% |
| Germany | 5.4% |
Source: Future Market Insights analysis of the synbiotic animal feed market, 2026.
Brazil
Brazil is forecast to grow fastest among the profiled countries, as feed output keeps rising. Sindiracoes projects total feed of 97.3 million tonnes in 2026, up 3.3%, of which broilers take 39.1 million tonnes. Compliance with EU antimicrobial restrictions is now a condition of access to the EU market. That supports an 8.2% CAGR from 2026 to 2036, although the trade dispute remains a risk.
USDA forecasts Brazilian chicken meat output at 16.0 million tonnes in 2026 and 16.3 million tonnes in 2027. Exports account for about one third of that volume, and EU sales now require antimicrobial compliance. The EU took 3.9% of chicken meat exports from January to July 2026. USDA calls it a display market, so losing it could damage perceptions of Brazilian chicken elsewhere. Feed made up 62.5% of chicken production cost in July 2026, so replacing antibiotics is largely a feed decision. Animal health costs rose fastest in Paraná, up 35.7% year on year, so additives that reduce treatment spending gain value.
Brazil's market access now depends on antimicrobial controls. A Commission audit from 24 August to 4 September 2026 covered broiler meat and honey. It found Brazil's controls capable of delivering the required guarantees and made no recommendations. In October the Commission said it intends to propose relisting for poultry meat and honey but not for beef. Member states are expected to vote at the committee meeting scheduled for 16 and 17 November 2026. USDA's October forecast still assumes the restriction lasts through 2027, so integrators should not wait for relisting to change feed programmes.
India
India is the second-fastest market, with feed output of 57.7 million tonnes in 2025, up 4.5%. Commercial feed is replacing on-farm mixing as poultry demand rises. A small base for synbiotics and price sensitivity set the pace, and FMI forecasts an 8.0% CAGR from 2026 to 2036.
India's food rules from 1 April 2025 bar listed antibiotics at any stage of poultry, egg and meat production. The list covers colistin, glycopeptides and nitrofurans, with a residue limit of 0.001 mg per kg. India's antimicrobial footprint grew 16% from 2010 to 2020, so the new rule meets a large pool of use. USDA's September 2026 oilseeds report cites industry sources for feed costs up more than 45%. Poultry producers responded by trimming output by roughly 20%. Corn diversion to ethanol is pushing poultry producers toward soybean meal even at higher prices. Mills squeezed by those costs resist premium additives, which keeps India's growth below its regulatory potential.
The rule covers food for the domestic market, so it reaches the whole poultry chain. Enforcement capacity will decide how fast mills switch to alternatives such as synbiotics. Producers that trimmed output by roughly 20% have fewer tonnes of feed to dose with additives. With feed costs up more than 45%, mills will weigh any synbiotic premium against measured feed conversion gains.
China
China produced 330.1 million tonnes of feed in 2025, up 4.8%. Farms have moved to commercial feed and alternatives to antibiotics since the 2020 ban on growth-promoting drugs. That supports a 7.2% CAGR from 2026 to 2036, although price competition from local producers limits premium products.
Veterinary antibiotic use in China fell 53% from 69,292 tonnes in 2014 to about 32,500 tonnes in 2021. China and the United States together hold about 60% of global livestock antimicrobial use. That residual 32,500 tonnes is the pool that prescription rules and alternatives are meant to shrink. The 2022 to 2025 national action plan targets prescription sales above 80% of veterinary antibiotics by 2025. USDA estimates Chinese chicken output at 18.0 million tonnes in 2026, up 9% from 16.5 million tonnes in 2025. Large integrated producers are adding capacity from breeding to processing, which favours volume contracts over small premium purchases.
Researchers cite inconsistent quality, low viable counts and excess moisture across China's microecological preparations industry. Documented strain counts therefore give branded blends a case on quality. China banned growth-promoting feed drugs in 2020, about five years before India's rule took effect. USDA forecasts Chinese chicken exports at 1.9 million tonnes in 2027, up 25%. Exporters selling to the EU need feed records, because EU health certificates now carry an attestation on antimicrobial use.
United States
The United States produced 267.4 million tonnes of feed in 2025, down 0.8% as the cattle cycle tightened. It withdrew growth-promotion claims for medically important antimicrobials in 2017 and gave the EU export guarantees. Growth is in broilers and dairy, and a mature base supports a 6.4% CAGR from 2026 to 2036.
Even after the 2024 rebound, FDA reports sales 27% below the 2015 peak. German supply fell 67% from 2011, so the US base still holds more volume to replace. Growth promotion claims are gone, so remaining sales serve disease use, which synbiotics replace only in part. By species, 43% of 2024 sales went to swine and 41% to cattle, against 4% for chickens. Swine and cattle account for 84% of sales, so replacement demand follows them more than chickens. Tetracyclines were 69% of sales and 58% of drugs delivered through feed, so one class sets the replacement target.
USDA estimates US chicken output at 22.6 million tonnes in 2026, up 3.7% on 2025. US exporters are forecast to hold 20% of world chicken trade in 2026, down from 26% in 2020. Exports are forecast 1% lower at 3.0 million tonnes in 2027, so demand rests mainly on domestic integrators. USDA forecasts 22.8 million tonnes in 2027, and positive margins leave integrators room to fund gut health trials.
Germany
Germany applies EU rules that banned antibiotic growth promoters on 1 January 2006 and now limit prophylactic use. Europe's feed output grew 1.0% in 2025, and a mature market gives a 5.4% CAGR from 2026 to 2036.
The German regulator BVL recorded 562 tonnes of antibiotics supplied for animals in 2025, 67% below 2011. The volume was flat against 2024, so the market has moved from a falling base to a stable one. Penicillins and tetracyclines make up 332 tonnes, or 59% of the total, which concentrates the volume left to replace. Colistin supply fell from 31 to 26 tonnes in 2025 after stricter rules required susceptibility testing. Fluoroquinolone supply rose 18% in 2025, so single classes can rebound even where the total is flat. Replacement opportunities therefore arise class by class and not through broad bans.
A review of the EU ban reports more therapeutic use and disease in year one, then lower overall use. Germany passed that adjustment years ago, so synbiotic demand now follows herd and flock numbers more than regulation. Since 2023 the BVL figures also include supply to other recipients such as pharmacies, so they compare only partly with earlier years. BVL cannot assign supplied volumes to animal species. The poultry and pig share of the remaining 332 tonnes of penicillins and tetracyclines is therefore not published.
Who are the notable companies in the Synbiotic Animal Feed Market?
Notable companies in the Synbiotic Animal Feed Market include Kemin, Evonik, dsm-firmenich, Cargill and Novonesis.
Suppliers differ on whether they sell a live strain alone or paired with a prebiotic substrate. Among the profiled companies, dsm-firmenich sells PoultryStar, which pairs probiotic strains patented by BIOMIN with fructooligosaccharides from inulin. A microencapsulated form resists high temperatures and enters feed before pelleting, and a soluble form suits drinking water. EFSA gave PoultryStar a positive scientific opinion on safety and efficacy for the target species.
Kemin and Evonik sell stand-alone Bacillus probiotics, which sit outside the market definition and serve as adjacent context. Kemin's Clostat has EU approval for all pig categories, valid from 8 January 2025 for ten years. Evonik's Ecobiol PRO is a poultry probiotic that raised broiler survival by 50.0% against a standard probiotic in a challenge study. Cargill lists phytogenics, postbiotics and organic acids in its feed additive range. It agreed in June 2022 to acquire Delacon, a phytogenics specialist with about 150 people in 25 countries. Novonesis lists probiotics and enzymes for poultry, swine, cattle and aquaculture. It bought dsm-firmenich's feed enzymes activities for EUR 1.5 billion in 2025.
dsm-firmenich agreed on 9 February 2026 to sell its Animal Nutrition & Health business to CVC. The enterprise value is about EUR 2.2 billion, and 2025 annualised net sales were about EUR 3.5 billion. PoultryStar sits in Performance Solutions, which the sale places in the Solutions company. On 22 October 2026 the company named the two standalone businesses Noviwest and Panavora. Completion remains subject to regulatory approvals and employee consultation. The February announcement expected completion at the end of 2026. Feed mills buying its products should confirm supply terms and support contacts until completion.
Key Developments in the Synbiotic Animal Feed Market
- In February 2026, dsm-firmenich AG announced the divestiture of its Animal Nutrition & Health segment to CVC Capital Partners in a transaction valued at approximately EUR 2.2 billion. The deal separates the Animal Nutrition & Health business, which includes the PoultryStar synbiotic range for poultry, from the broader dsm-firmenich specialty chemicals group. The transaction marks a structural shift in ownership for one of the synbiotic animal feed market’s principal commercial players and is expected to allow the ANH business to operate with greater focus under independent management. [28]
- In October 2026, dsm-firmenich AG announced that the Animal Nutrition & Health business acquired by CVC Capital Partners had been incorporated as Noviwest AG and that the product portfolio had been rebranded under the Panavora name. The Panavora brand encompasses the full range of animal nutrition products previously marketed under the dsm-firmenich ANH umbrella, including the PoultryStar synbiotic product for poultry. The renaming completes the operational separation from dsm-firmenich and establishes Noviwest AG as an independent commercial entity in the animal nutrition sector. [29]
Key Players in the Synbiotic Animal Feed Market
- Kemin Industries, Inc.
- Evonik Industries AG
- dsm-firmenich AG (Animal Nutrition & Health)
- Cargill, Incorporated
- Novonesis A/S
Synbiotic Animal Feed Market Report Scope
Table 6: Synbiotic Animal Feed Market Report Scope
| Coverage field | Report scope |
|---|---|
| Market definition | Feed additives that combine live probiotic microorganisms with prebiotic substrates, sold for poultry, swine, aquaculture, ruminants, pets and equine, valued at manufacturer selling prices. Stand-alone probiotics and prebiotics are excluded. |
| Animal Type | Poultry; Swine; Aquaculture; Ruminants; Pets and equine |
| Microbial Source | Bacteria-based; Yeast and other non-bacterial |
| Form | Powder; Liquid; Granules; Capsules; Cubes |
| Regions and profiled countries | North America, Latin America, Europe, East Asia, South Asia, Oceania, Middle East and Africa. Profiled countries: Brazil, India, China, United States, Germany |
| Companies covered | Kemin Industries, Inc.; Evonik Industries AG; dsm-firmenich AG (Animal Nutrition & Health); Cargill, Incorporated; Novonesis A/S |
| Quantitative Units | USD million |
Synbiotic Animal Feed Market by Segments
Synbiotic Animal Feed Market segmented by Animal Type:
- Poultry
- Swine
- Aquaculture
- Ruminants
- Pets and equine
Synbiotic Animal Feed Market segmented by Microbial Source:
- Bacteria-based
- Yeast and other non-bacterial
Synbiotic Animal Feed Market segmented by Form:
- Powder
- Liquid
- Granules
- Capsules
- Cubes
Synbiotic Animal Feed Market by Region
- North America
- Latin America
- Europe
- East Asia
- South Asia
- Oceania
- Middle East
- Africa
- Brazil
- India
- China
- United States
- Germany
Research Sources and Bibliography
- [1] Evonik Industries AG. (2026, June 10). Probiotics instead of antibiotics in livestock production. Press release. https://www.evonik.com/en/news/press-releases/2026/06/probiotics-instead-of-antibiotics-in-livestock-production.html
- [2] Food Times. (2026, September 2). Animal Health Law and the EU ban to Brazilian beef. https://www.foodtimes.eu/food-system/eu-bans-brazilian-beef-antibiotics-animal-health-law-2026/
- [3] dsm-firmenich. (2026, February 9). dsm-firmenich announces agreement to divest Animal Nutrition & Health to CVC Capital Partners. Press release. https://our-company.dsm-firmenich.com/en/our-company/news/press-releases/2026/dsm-firmenich-announces-agreement-to-divest-animal-nutrition-and-health-to-cvc-capital-partners.html
- [4] Alltech. (2026, April 21). 2026 Alltech Agri-Food Outlook shares global feed production survey data. https://www.alltech.com/press-release/2026-alltech-agri-food-outlook-shares-global-feed-production-survey-data
- [5] Zheng S. et al. (2025). Solutions to the dilemma of antibiotics use in livestock and poultry farming. PubMed Central. https://pmc.ncbi.nlm.nih.gov/articles/PMC12115607/
- [6] Feed & Additive Magazine. (2025). EU approves Kemin's gut stabiliser for entire pig production cycle. https://www.feedandadditive.com/eu-approves-kemins-gut-stabiliser-for-entire-pig-production-cycle/
- [7] All About Feed. (2026, April 19). Brazil's animal feed production set to grow 3.3% in 2026 (Sindiracoes). https://www.foodagribusiness.world/feed/brazils-animal-feed-production-set-to-grow-3-3-in-2026
- [8] Pinho J.O. et al. (2025). Evaluation of guidelines on antimicrobials use in food-producing animals. PubMed Central. https://pmc.ncbi.nlm.nih.gov/articles/PMC12351981/
- [9] Cargill, Inc. (2022, June 23). Cargill, Delacon to join together to create a leading plant-based phytogenic feed additives business for healthier animal nutrition. Press release. https://www.cargill.com/2022/cargill-delacon-to-join-together-to-create-a-leading-plant
- [10] World Organisation for Animal Health (WOAH). (2025, May 24). Less antimicrobial use in animals: a win for everyone. https://www.woah.org/en/article/less-antimicrobial-use-in-animals-a-win-for-everyone/
- [11] U.S. Food and Drug Administration. (2025, December 5). FDA Releases Annual Summary of Sales and Distribution of Antimicrobials in 2024 for Use in Food-Producing Animals. https://www.fda.gov/animal-veterinary/cvm-updates/fda-releases-annual-summary-sales-and-distribution-antimicrobials-2024-use-food-producing-animals
- [12] University College London (UCL). (2026, January 27). Global livestock antibiotic use falls, but trade shifts the problem abroad. https://www.ucl.ac.uk/news/2026/jan/global-livestock-antibiotic-use-falls-trade-shifts-problem-abroad
- [13] U.S. Department of Agriculture, Foreign Agricultural Service. (2026, September 15). Poultry and Products Annual, Brazil (BR2026-0037). https://apps.fas.usda.gov/newgainapi/api/Report/DownloadReportByFileName?fileName=Poultry%20and%20Products%20Annual_Brasilia_Brazil_BR2026-0037.pdf
- [14] U.S. Department of Agriculture, Foreign Agricultural Service. (2026, October 9). Livestock and Poultry: World Markets and Trade. https://apps.fas.usda.gov/psdonline/circulars/livestock_poultry.pdf
- [15] Bundesamt fuer Verbraucherschutz und Lebensmittelsicherheit (BVL). (2026, October 6). Antibiotikaabgabe in der Tiermedizin weiter auf niedrigem Niveau. Press release. https://www.bvl.bund.de/SharedDocs/Pressemitteilungen/05_tierarzneimittel/2026/PM_Antibiotika-Abgabemengen.html
- [16] Food Safety and Standards Authority of India. (2025, April 1). Food Safety and Standards (Contaminants, Toxins and Residues) Regulations, 2011, compendium version VIII. https://www.fssai.gov.in/upload/uploadfiles/files/Comp_Contaminants_Regulations_2_4_2025_VIII.pdf
- [17] U.S. Department of Agriculture, Foreign Agricultural Service. (2026, September 3). Oilseeds and Products Update, India (IN2026-0047). https://apps.fas.usda.gov/newgainapi/api/Report/DownloadReportByFileName?fileName=Oilseeds%20and%20Products%20Update_New%20Delhi_India_IN2026-0047.pdf
- [18] Van Beusekom M. (CIDRAP). (2025, December 18). US sales of antibiotics for livestock climbed 16% last year, FDA report shows. https://www.cidrap.umn.edu/antimicrobial-stewardship/us-sales-antibiotics-livestock-climbed-16-last-year-fda-report-shows
- [19] European Commission, Directorate-General for Health and Food Safety. (2026, September 2). EU antimicrobial rules for imports of animals and animal products. https://food.ec.europa.eu/animals/animal-health/veterinary-medicines/eu-antimicrobial-rules-imports-animals-and-animal-products_en?prefLang=en
- [20] European Commission, Directorate-General for Health and Food Safety. (2026, September 28). Final report of an audit carried out in Brazil from 24 August to 4 September 2026 to evaluate compliance with the prohibition of use of certain antimicrobials in animals and animal products for export to the EU (CT-2026-0202). https://ec.europa.eu/food/audits-analysis/audit-report/download/17354
- [21] Fleischwirtschaft. (2026, October 23). Trade barrier: EU moves to reinstate Brazilian poultry and honey imports. https://english.fleischwirtschaft.de/economy/news/trade-barrier-eu-moves-to-reinstate-brazilian-poultry-and-honey-imports-67502
- [22] The European Post. (2026, October 29). Brazil Meat Ban Eases For Poultry And Honey But Not Beef. https://theeuropeanpost.eu/external-relations/brazil-meat-ban-eases-for-poultry-and-honey-but-not-beef/
- [23] dsm-firmenich Animal Nutrition & Health. (2026). PoultryStar: a poultry specific synbiotic. https://www.dsm-firmenich.com/anh/en_NA/products-and-services/products/eubiotics/poultrystar.html
- [24] dsm-firmenich. (2026, October 22). dsm-firmenich Animal Nutrition & Health prepares for future as two focused companies: Noviwest and Panavora. Press release. https://www.dsm-firmenich.com/anh/news/press-releases/2026/2026-10-22-dsm-firmenich-animal-nutrition-and-health-prepares-for-future-as-two-focused-companies-noviwest-and-panavora.html
- [25] Cargill. (2026). Feed additives: micronutrition and health solutions. https://www.cargill.com/animal-nutrition/species/feed-additives
- [26] Novonesis. (2026). Animal biosolutions. https://www.novonesis.com/en/biosolutions/animal-and-plant/animal
- [27] Evonik Industries AG. (2026). Ecobiol PRO. https://www.evonik.com/en/products/an/pr_52049943.html
- [28] dsm-firmenich AG. (2026, February 9). dsm-firmenich to divest Animal Nutrition & Health to CVC Capital Partners [press release]. https://www.dsm-firmenich.com/en/media/news/2026/dsm-firmenich-to-divest-anh-to-cvc.html
- [29] dsm-firmenich AG. (2026, October 22). Animal Nutrition & Health becomes Noviwest and launches Panavora brand [press release]. https://www.dsm-firmenich.com/en/media/news/2026/anh-becomes-noviwest-panavora.html
Table of Content
- Key Takeaways
- Market Size and CAGR
- Top Growth Driver
- Fastest Growing Segment
- Leading Region
- Key Companies
- Emerging Opportunities
- Executive Summary
- Global Market Outlook
- Demand-side Trends
- Supply-side Trends
- Technology Roadmap Analysis
- Analysis and Recommendations
- Analyst Perspective (What is happening? Why now? What should investors know?)
- Key Questions Answered
- How large is the market?
- What is the CAGR?
- What are key trends?
- Which region dominates?
- Who are the leaders?
Read More...
- Market Overview
- Market Coverage / Taxonomy
- Market Definition / Scope / Limitations
- Research Methodology
- Chapter Orientation
- Analytical Lens and Working Hypotheses
- Market Structure, Signals, and Trend Drivers
- Benchmarking and Cross-market Comparability
- Market Sizing, Forecasting, and Opportunity Mapping
- Research Design and Evidence Framework
- Desk Research Programme (Secondary Evidence)
- Expert Input and Fieldwork (Primary Evidence)
- Tooling, Models, and Reference Databases
- Data Engineering and Model Build
- Quality Assurance and Audit Trail
- Market Background
- Market Dynamics (Drivers, Restraints, Opportunity, Trends)
- Scenario Forecast (Optimistic, Likely, Conservative)
- Impact Analysis
- AI Impact
- Sustainability Impact
- Regulatory Impact
- Technology Impact
- Consumer / Buyer Analysis
- Purchase Drivers
- Adoption Barriers
- Buyer Journey
- Opportunity Map Analysis
- Product Life Cycle Analysis
- Supply Chain Analysis
- Investment Feasibility Matrix
- Value Chain Analysis
- PESTLE and Porter's Analysis
- Regulatory Landscape
- Regional Parent Market Outlook
- Production and Consumption Statistics
- Import and Export Statistics
- Global Market Analysis and Forecast, 2021 to 2036
- Historical Market Size Value (USD Million) Analysis, 2021 to 2025
- Current and Future Market Size Value (USD Million) Projections, 2026 to 2036
- Y-o-Y Growth Trend Analysis
- Absolute $ Opportunity Analysis
- Global Market Pricing Analysis, 2021 to 2036
- Global Market Analysis and Forecast, By Animal Type, 2021 to 2036
- Introduction / Key Findings
- Historical Market Size Value (USD Million) Analysis By Animal Type, 2021 to 2025
- Current and Future Market Size Value (USD Million) Analysis and Forecast By Animal Type, 2026 to 2036
- Poultry
- Swine
- Aquaculture
- Ruminants
- Pets and equine
- Y-o-Y Growth Trend Analysis By Animal Type, 2021 to 2025
- Absolute $ Opportunity Analysis By Animal Type, 2026 to 2036
- Global Market Analysis and Forecast, By Microbial Source, 2021 to 2036
- Introduction / Key Findings
- Historical Market Size Value (USD Million) Analysis By Microbial Source, 2021 to 2025
- Current and Future Market Size Value (USD Million) Analysis and Forecast By Microbial Source, 2026 to 2036
- Bacteria-based
- Yeast and other non-bacterial
- Y-o-Y Growth Trend Analysis By Microbial Source, 2021 to 2025
- Absolute $ Opportunity Analysis By Microbial Source, 2026 to 2036
- Global Market Analysis and Forecast, By Form, 2021 to 2036
- Introduction / Key Findings
- Historical Market Size Value (USD Million) Analysis By Form, 2021 to 2025
- Current and Future Market Size Value (USD Million) Analysis and Forecast By Form, 2026 to 2036
- Powder
- Liquid
- Granules
- Capsules
- Cubes
- Y-o-Y Growth Trend Analysis By Form, 2021 to 2025
- Absolute $ Opportunity Analysis By Form, 2026 to 2036
- Global Market Analysis and Forecast, By Region, 2021 to 2036
- Introduction
- Historical Market Size Value (USD Million) Analysis By Region, 2021 to 2025
- Current Market Size Value (USD Million) Analysis and Forecast By Region, 2026 to 2036
- North America
- Latin America
- Europe
- East Asia
- South Asia
- Oceania
- Middle East
- Africa
- Market Attractiveness Analysis By Region
- North America Market Analysis and Forecast, By Country, 2021 to 2036
- Historical Market Size Value (USD Million) Trend Analysis By Market Taxonomy, 2021 to 2025
- Market Size Value (USD Million) Forecast By Market Taxonomy, 2026 to 2036
- By Country
- By Animal Type
- By Microbial Source
- By Form
- Market Attractiveness Analysis
- By Country
- By Animal Type
- By Microbial Source
- By Form
- Key Takeaways
- Latin America Market Analysis and Forecast, By Country
- Historical Market Size Value (USD Million) Trend Analysis By Market Taxonomy, 2021 to 2025
- Market Size Value (USD Million) Forecast By Market Taxonomy, 2026 to 2036
- By Country
- By Animal Type
- By Microbial Source
- By Form
- Market Attractiveness Analysis
- By Country
- By Animal Type
- By Microbial Source
- By Form
- Key Takeaways
- Europe Market Analysis and Forecast, By Country
- Historical Market Size Value (USD Million) Trend Analysis By Market Taxonomy, 2021 to 2025
- Market Size Value (USD Million) Forecast By Market Taxonomy, 2026 to 2036
- By Country
- By Animal Type
- By Microbial Source
- By Form
- Market Attractiveness Analysis
- By Country
- By Animal Type
- By Microbial Source
- By Form
- Key Takeaways
- East Asia Market Analysis and Forecast, By Country
- Historical Market Size Value (USD Million) Trend Analysis By Market Taxonomy, 2021 to 2025
- Market Size Value (USD Million) Forecast By Market Taxonomy, 2026 to 2036
- By Country
- By Animal Type
- By Microbial Source
- By Form
- Market Attractiveness Analysis
- By Country
- By Animal Type
- By Microbial Source
- By Form
- Key Takeaways
- South Asia Market Analysis and Forecast, By Country
- Historical Market Size Value (USD Million) Trend Analysis By Market Taxonomy, 2021 to 2025
- Market Size Value (USD Million) Forecast By Market Taxonomy, 2026 to 2036
- By Country
- By Animal Type
- By Microbial Source
- By Form
- Market Attractiveness Analysis
- By Country
- By Animal Type
- By Microbial Source
- By Form
- Key Takeaways
- Oceania Market Analysis and Forecast, By Country
- Historical Market Size Value (USD Million) Trend Analysis By Market Taxonomy, 2021 to 2025
- Market Size Value (USD Million) Forecast By Market Taxonomy, 2026 to 2036
- By Country
- By Animal Type
- By Microbial Source
- By Form
- Market Attractiveness Analysis
- By Country
- By Animal Type
- By Microbial Source
- By Form
- Key Takeaways
- Middle East Market Analysis and Forecast, By Country
- Historical Market Size Value (USD Million) Trend Analysis By Market Taxonomy, 2021 to 2025
- Market Size Value (USD Million) Forecast By Market Taxonomy, 2026 to 2036
- By Country
- By Animal Type
- By Microbial Source
- By Form
- Market Attractiveness Analysis
- By Country
- By Animal Type
- By Microbial Source
- By Form
- Key Takeaways
- Africa Market Analysis and Forecast, By Country
- Historical Market Size Value (USD Million) Trend Analysis By Market Taxonomy, 2021 to 2025
- Market Size Value (USD Million) Forecast By Market Taxonomy, 2026 to 2036
- By Country
- Brazil
- India
- China
- United States
- Germany
- By Animal Type
- By Microbial Source
- By Form
- By Country
- Market Attractiveness Analysis
- By Country
- By Animal Type
- By Microbial Source
- By Form
- Key Takeaways
- Key Countries Market Analysis
- United States
- Pricing Analysis
- Market Share Analysis, 2025
- By Animal Type
- By Microbial Source
- By Form
- Brazil
- Pricing Analysis
- Market Share Analysis, 2025
- By Animal Type
- By Microbial Source
- By Form
- Germany
- Pricing Analysis
- Market Share Analysis, 2025
- By Animal Type
- By Microbial Source
- By Form
- India
- Pricing Analysis
- Market Share Analysis, 2025
- By Animal Type
- By Microbial Source
- By Form
- China
- Pricing Analysis
- Market Share Analysis, 2025
- By Animal Type
- By Microbial Source
- By Form
- United States
- Market Structure Analysis
- Competition Dashboard
- Competition Benchmarking
- Market Share Analysis of Top Players
- By Regional
- By Animal Type
- By Microbial Source
- By Form
- Emerging Startups
- Innovation Benchmarking
- Competition Analysis
- Competition Deep Dive
- Kemin Industries, Inc.
- Overview
- Product Portfolio
- Profitability by Market Segments
- Sales Footprint
- Strategy Overview
- Marketing Strategy
- Product Strategy
- Channel Strategy
- Evonik Industries AG
- dsm-firmenich AG (Animal Nutrition & Health)
- Cargill, Incorporated
- Novonesis A/S
- Kemin Industries, Inc.
- Case Studies
- Success Stories
- Recent Developments
- Competition Deep Dive
- Assumptions & Acronyms Used
List of Tables
- Table 1: Global Market Value (USD Million) Forecast by Region, 2021 to 2036
- Table 2: Global Market Value (USD Million) Forecast by Animal Type, 2021 to 2036
- Table 3: Global Market Value (USD Million) Forecast by Microbial Source, 2021 to 2036
- Table 4: Global Market Value (USD Million) Forecast by Form, 2021 to 2036
- Table 5: North America Market Value (USD Million) Forecast by Country, 2021 to 2036
- Table 6: North America Market Value (USD Million) Forecast by Animal Type, 2021 to 2036
- Table 7: North America Market Value (USD Million) Forecast by Microbial Source, 2021 to 2036
- Table 8: North America Market Value (USD Million) Forecast by Form, 2021 to 2036
- Table 9: Latin America Market Value (USD Million) Forecast by Country, 2021 to 2036
- Table 10: Latin America Market Value (USD Million) Forecast by Animal Type, 2021 to 2036
- Table 11: Latin America Market Value (USD Million) Forecast by Microbial Source, 2021 to 2036
- Table 12: Latin America Market Value (USD Million) Forecast by Form, 2021 to 2036
- Table 13: Europe Market Value (USD Million) Forecast by Country, 2021 to 2036
- Table 14: Europe Market Value (USD Million) Forecast by Animal Type, 2021 to 2036
- Table 15: Europe Market Value (USD Million) Forecast by Microbial Source, 2021 to 2036
- Table 16: Europe Market Value (USD Million) Forecast by Form, 2021 to 2036
- Table 17: East Asia Market Value (USD Million) Forecast by Country, 2021 to 2036
- Table 18: East Asia Market Value (USD Million) Forecast by Animal Type, 2021 to 2036
- Table 19: East Asia Market Value (USD Million) Forecast by Microbial Source, 2021 to 2036
- Table 20: East Asia Market Value (USD Million) Forecast by Form, 2021 to 2036
- Table 21: South Asia Market Value (USD Million) Forecast by Country, 2021 to 2036
- Table 22: South Asia Market Value (USD Million) Forecast by Animal Type, 2021 to 2036
- Table 23: South Asia Market Value (USD Million) Forecast by Microbial Source, 2021 to 2036
- Table 24: South Asia Market Value (USD Million) Forecast by Form, 2021 to 2036
- Table 25: Oceania Market Value (USD Million) Forecast by Country, 2021 to 2036
- Table 26: Oceania Market Value (USD Million) Forecast by Animal Type, 2021 to 2036
- Table 27: Oceania Market Value (USD Million) Forecast by Microbial Source, 2021 to 2036
- Table 28: Oceania Market Value (USD Million) Forecast by Form, 2021 to 2036
- Table 29: Middle East Market Value (USD Million) Forecast by Country, 2021 to 2036
- Table 30: Middle East Market Value (USD Million) Forecast by Animal Type, 2021 to 2036
- Table 31: Middle East Market Value (USD Million) Forecast by Microbial Source, 2021 to 2036
- Table 32: Middle East Market Value (USD Million) Forecast by Form, 2021 to 2036
- Table 33: Africa Market Value (USD Million) Forecast by Country, 2021 to 2036
- Table 34: Africa Market Value (USD Million) Forecast by Animal Type, 2021 to 2036
- Table 35: Africa Market Value (USD Million) Forecast by Microbial Source, 2021 to 2036
- Table 36: Africa Market Value (USD Million) Forecast by Form, 2021 to 2036
List of Figures
- Figure 1: Global Market Pricing Analysis
- Figure 2: Global Market Value (USD Million) Forecast 2021-2036
- Figure 3: Global Market Value Share and BPS Analysis by Animal Type, 2026 and 2036
- Figure 4: Global Market Y-o-Y Growth Comparison by Animal Type, 2026-2036
- Figure 5: Global Market Attractiveness Analysis by Animal Type
- Figure 6: Global Market Value Share and BPS Analysis by Microbial Source, 2026 and 2036
- Figure 7: Global Market Y-o-Y Growth Comparison by Microbial Source, 2026-2036
- Figure 8: Global Market Attractiveness Analysis by Microbial Source
- Figure 9: Global Market Value Share and BPS Analysis by Form, 2026 and 2036
- Figure 10: Global Market Y-o-Y Growth Comparison by Form, 2026-2036
- Figure 11: Global Market Attractiveness Analysis by Form
- Figure 12: Global Market Value (USD Million) Share and BPS Analysis by Region, 2026 and 2036
- Figure 13: Global Market Y-o-Y Growth Comparison by Region, 2026-2036
- Figure 14: Global Market Attractiveness Analysis by Region
- Figure 15: North America Market Incremental Dollar Opportunity, 2026-2036
- Figure 16: Latin America Market Incremental Dollar Opportunity, 2026-2036
- Figure 17: Europe Market Incremental Dollar Opportunity, 2026-2036
- Figure 18: East Asia Market Incremental Dollar Opportunity, 2026-2036
- Figure 19: South Asia Market Incremental Dollar Opportunity, 2026-2036
- Figure 20: Oceania Market Incremental Dollar Opportunity, 2026-2036
- Figure 21: Middle East Market Incremental Dollar Opportunity, 2026-2036
- Figure 22: Africa Market Incremental Dollar Opportunity, 2026-2036
- Figure 23: North America Market Value Share and BPS Analysis by Country, 2026 and 2036
- Figure 24: North America Market Value Share and BPS Analysis by Animal Type, 2026 and 2036
- Figure 25: North America Market Y-o-Y Growth Comparison by Animal Type, 2026-2036
- Figure 26: North America Market Attractiveness Analysis by Animal Type
- Figure 27: North America Market Value Share and BPS Analysis by Microbial Source, 2026 and 2036
- Figure 28: North America Market Y-o-Y Growth Comparison by Microbial Source, 2026-2036
- Figure 29: North America Market Attractiveness Analysis by Microbial Source
- Figure 30: North America Market Value Share and BPS Analysis by Form, 2026 and 2036
- Figure 31: North America Market Y-o-Y Growth Comparison by Form, 2026-2036
- Figure 32: North America Market Attractiveness Analysis by Form
- Figure 33: Latin America Market Value Share and BPS Analysis by Country, 2026 and 2036
- Figure 34: Latin America Market Value Share and BPS Analysis by Animal Type, 2026 and 2036
- Figure 35: Latin America Market Y-o-Y Growth Comparison by Animal Type, 2026-2036
- Figure 36: Latin America Market Attractiveness Analysis by Animal Type
- Figure 37: Latin America Market Value Share and BPS Analysis by Microbial Source, 2026 and 2036
- Figure 38: Latin America Market Y-o-Y Growth Comparison by Microbial Source, 2026-2036
- Figure 39: Latin America Market Attractiveness Analysis by Microbial Source
- Figure 40: Latin America Market Value Share and BPS Analysis by Form, 2026 and 2036
- Figure 41: Latin America Market Y-o-Y Growth Comparison by Form, 2026-2036
- Figure 42: Latin America Market Attractiveness Analysis by Form
- Figure 43: Europe Market Value Share and BPS Analysis by Country, 2026 and 2036
- Figure 44: Europe Market Value Share and BPS Analysis by Animal Type, 2026 and 2036
- Figure 45: Europe Market Y-o-Y Growth Comparison by Animal Type, 2026-2036
- Figure 46: Europe Market Attractiveness Analysis by Animal Type
- Figure 47: Europe Market Value Share and BPS Analysis by Microbial Source, 2026 and 2036
- Figure 48: Europe Market Y-o-Y Growth Comparison by Microbial Source, 2026-2036
- Figure 49: Europe Market Attractiveness Analysis by Microbial Source
- Figure 50: Europe Market Value Share and BPS Analysis by Form, 2026 and 2036
- Figure 51: Europe Market Y-o-Y Growth Comparison by Form, 2026-2036
- Figure 52: Europe Market Attractiveness Analysis by Form
- Figure 53: East Asia Market Value Share and BPS Analysis by Country, 2026 and 2036
- Figure 54: East Asia Market Value Share and BPS Analysis by Animal Type, 2026 and 2036
- Figure 55: East Asia Market Y-o-Y Growth Comparison by Animal Type, 2026-2036
- Figure 56: East Asia Market Attractiveness Analysis by Animal Type
- Figure 57: East Asia Market Value Share and BPS Analysis by Microbial Source, 2026 and 2036
- Figure 58: East Asia Market Y-o-Y Growth Comparison by Microbial Source, 2026-2036
- Figure 59: East Asia Market Attractiveness Analysis by Microbial Source
- Figure 60: East Asia Market Value Share and BPS Analysis by Form, 2026 and 2036
- Figure 61: East Asia Market Y-o-Y Growth Comparison by Form, 2026-2036
- Figure 62: East Asia Market Attractiveness Analysis by Form
- Figure 63: South Asia Market Value Share and BPS Analysis by Country, 2026 and 2036
- Figure 64: South Asia Market Value Share and BPS Analysis by Animal Type, 2026 and 2036
- Figure 65: South Asia Market Y-o-Y Growth Comparison by Animal Type, 2026-2036
- Figure 66: South Asia Market Attractiveness Analysis by Animal Type
- Figure 67: South Asia Market Value Share and BPS Analysis by Microbial Source, 2026 and 2036
- Figure 68: South Asia Market Y-o-Y Growth Comparison by Microbial Source, 2026-2036
- Figure 69: South Asia Market Attractiveness Analysis by Microbial Source
- Figure 70: South Asia Market Value Share and BPS Analysis by Form, 2026 and 2036
- Figure 71: South Asia Market Y-o-Y Growth Comparison by Form, 2026-2036
- Figure 72: South Asia Market Attractiveness Analysis by Form
- Figure 73: Oceania Market Value Share and BPS Analysis by Country, 2026 and 2036
- Figure 74: Oceania Market Value Share and BPS Analysis by Animal Type, 2026 and 2036
- Figure 75: Oceania Market Y-o-Y Growth Comparison by Animal Type, 2026-2036
- Figure 76: Oceania Market Attractiveness Analysis by Animal Type
- Figure 77: Oceania Market Value Share and BPS Analysis by Microbial Source, 2026 and 2036
- Figure 78: Oceania Market Y-o-Y Growth Comparison by Microbial Source, 2026-2036
- Figure 79: Oceania Market Attractiveness Analysis by Microbial Source
- Figure 80: Oceania Market Value Share and BPS Analysis by Form, 2026 and 2036
- Figure 81: Oceania Market Y-o-Y Growth Comparison by Form, 2026-2036
- Figure 82: Oceania Market Attractiveness Analysis by Form
- Figure 83: Middle East Market Value Share and BPS Analysis by Country, 2026 and 2036
- Figure 84: Middle East Market Value Share and BPS Analysis by Animal Type, 2026 and 2036
- Figure 85: Middle East Market Y-o-Y Growth Comparison by Animal Type, 2026-2036
- Figure 86: Middle East Market Attractiveness Analysis by Animal Type
- Figure 87: Middle East Market Value Share and BPS Analysis by Microbial Source, 2026 and 2036
- Figure 88: Middle East Market Y-o-Y Growth Comparison by Microbial Source, 2026-2036
- Figure 89: Middle East Market Attractiveness Analysis by Microbial Source
- Figure 90: Middle East Market Value Share and BPS Analysis by Form, 2026 and 2036
- Figure 91: Middle East Market Y-o-Y Growth Comparison by Form, 2026-2036
- Figure 92: Middle East Market Attractiveness Analysis by Form
- Figure 93: Africa Market Value Share and BPS Analysis by Country, 2026 and 2036
- Figure 94: Africa Market Value Share and BPS Analysis by Animal Type, 2026 and 2036
- Figure 95: Africa Market Y-o-Y Growth Comparison by Animal Type, 2026-2036
- Figure 96: Africa Market Attractiveness Analysis by Animal Type
- Figure 97: Africa Market Value Share and BPS Analysis by Microbial Source, 2026 and 2036
- Figure 98: Africa Market Y-o-Y Growth Comparison by Microbial Source, 2026-2036
- Figure 99: Africa Market Attractiveness Analysis by Microbial Source
- Figure 100: Africa Market Value Share and BPS Analysis by Form, 2026 and 2036
- Figure 101: Africa Market Y-o-Y Growth Comparison by Form, 2026-2036
- Figure 102: Africa Market Attractiveness Analysis by Form
- Figure 103: Global Market - Tier Structure Analysis
- Figure 104: Global Market - Company Share Analysis
Frequently Asked Questions
How big is the Synbiotic Animal Feed Marke in 2026?
FMI estimates the market at USD 486.7 million in 2026, up from USD 452.8 million in 2025. It is forecast to reach USD 1,003.1 million by 2036 at a 7.5% CAGR.
Which animal type leads the Synbiotic Animal Feed Marke in 2026?
Poultry leads by animal type with 38.0% in 2026, and all other animal types together hold 62.0%.
Which microbial source and form lead?
Bacteria-based products hold 82.0% by microbial source and powders hold 32.0% by form in FMI's 2026 assessment.
Which country is forecast to grow fastest through 2036?
Brazil has the highest forecast CAGR among the profiled countries at 8.2% during 2026 to 2036, followed by India at 8.0%.
What is a synbiotic in animal feed?
A synbiotic combines a live probiotic microorganism with a prebiotic fibre that feeds it. The aim is better gut health and less reliance on antibiotics.
How do EU rules affect feed additive demand outside Europe?
The EU bars antimicrobials for growth promotion and those reserved for human medicine in animals exported to it [19]. Since 3 September 2026 only listed third countries may export affected products, and Brazil was left off for several [2][19]. Exporters therefore look to alternatives such as probiotics and synbiotics.
Preview the report firsthand - request a free sample
Get SampleGet the brochure for pricing and purchase details.
Get PDF
