Prebiotic Fiber Market Size and Share Forecast Outlook 2025 to 2035

The global prebiotic fiber market is worth USD 7.1 billion in 2025 and is expected to reach USD 13.1 billion by 2035, reflecting a CAGR of 6.3%. Growth in the market will be driven by rising awareness around gut health, increased incorporation of prebiotic ingredients in food and beverage applications, and growing preference for natural functional ingredients.
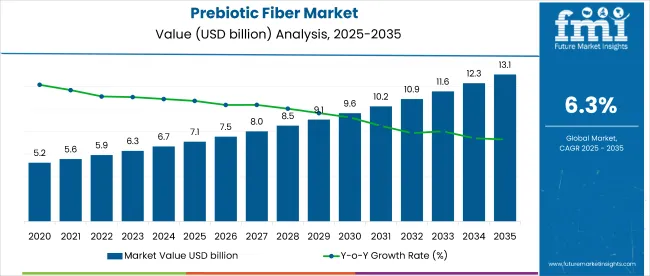
Quick Stats for Prebiotic Fiber Market

  • Market Value (2025): USD 7.1 billion
  • Forecast Value (2035): USD 13.1 billion
  • Forecast CAGR: 6.3%
  • Nature Leader in 2025: Conventional (68% market share)
  • Top Application Segment: Food & Beverage (45% share)
  • Key Growth Region: East Asia (Japan is the fastest-growing market with 6.4% CAGR)

Prebiotic Fiber Market Market Value Analysis

Metric Value
Estimated Size (2025E) USD 7.1 billion
Projected Value (2035F) USD 13.1 billion
CAGR (2025 to 2035) 6.3%

The aging global population, shifting consumer dietary habits, and the ongoing expansion of nutraceutical and dairy markets are further expected to boost demand over the forecast period.

Japan is projected to grow at a rapid pace of 6.4% CAGR, with demand driven by a deep-rooted consumer culture around digestive wellness. Meanwhile, the USA and the UK closely follow this significant growth with respective CAGRs of 6.1% and 5.8%. Galacto-oligosaccharides are set to dominate the product type segment with a 35% market share, supported by their increasing use in infant nutrition and bakery products. Meanwhile, the food & beverage application segment is anticipated to lead with a 45% share in 2025.

The market holds a notable share across several broader categories. Within the dietary fiber market, it accounts for 25%, driven by its specific functional benefits for gut health. In the digestive health ingredients market, prebiotic fiber comprises about 30%, given its central role in promoting microbiome balance.

It accounts for 18% of the nutraceutical ingredients market and around 15% of the functional food ingredients market. In the clean label ingredients market, it represents nearly 12%, supported by demand for natural, plant-derived solutions. Overall, prebiotic fiber is a high-impact niche with expanding influence across health-centric ingredient sectors.

Moving forward, market growth is expected to benefit from favorable government regulations supporting gut health claims on food labels and increasing R&D investment in natural fiber innovation. Innovations such as encapsulated prebiotic powders and customized fiber blends for personalized nutrition are being introduced. Moreover, rising interest in clean-label ingredients and the growth of plant-based product lines are expected to open new opportunities in both developed and emerging markets over the next decade.

Prebiotic Fiber Market Analysis by Top Investment Segment

ifThe global market is segmented into nature, product type, application, sales channel and region. By nature, the market is segmented into organic and conventional. By product type, the market includes galacto-oligosaccharide, fructo-oligosaccharide, mannan-oligosaccharide, inulin and others (polydextrose and resistant starch).

By application, the market provides food and beverages, baked foods, dairy, breakfast snacks, animal feed, nutritional supplements, and others (infant formula and dietary products). By sales channel, the market is segmented into direct sales, indirect sales, supermarket/hypermarket, online stores and retail stores. By Region, the market covers North America, Latin America, Europe, East Asia, South Asia, Oceania, the Middle East & Africa.
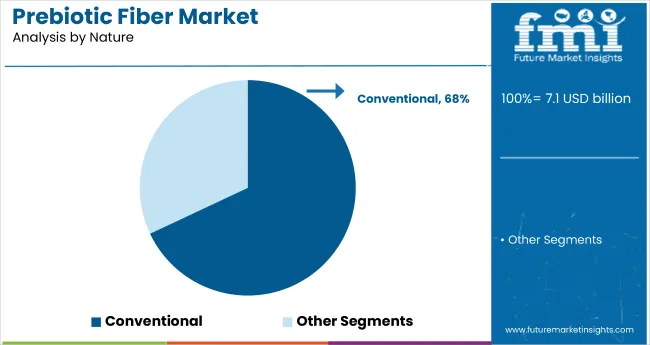
By Nature, the Conventional Segment Accounts for 68% of the Market Share

Prebiotic Fiber Market Analysis By Nature

The conventional segment is projected to dominate the nature category, accounting for 68% of the market share in 2025. Its high availability and cost-effectiveness make conventional prebiotic fibers the preferred choice among both manufacturers and consumers. Most prebiotics used in processed foods and beverages are derived from traditional sources, ensuring scalability and consistent supply.
  • Conventional prebiotics offer affordable, large-scale manufacturing.
  • Widely used in commercial food and beverage applications.
  • Organic segment growing steadily with premium health-conscious demand.
  • Regulatory support driving organic product launches.

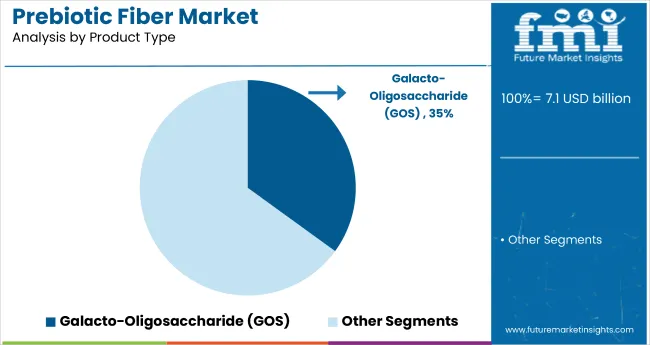
By Product Type, Galacto-Oligosaccharide (GOS) Accounts for 35% of the Market Share

Prebiotic Fiber Market Analysis By Product Type

Galacto-oligosaccharide (GOS) is projected to lead the product type segment with a 35% market share in 2025. GOS offers multiple health benefits, including promoting bifidobacteria growth, reducing the risk of colon cancer, and alleviating constipation. Its increasing use in infant formula and baked goods, along with low caloric content, supports wider adoption. The clean-label and non-GMO status of many GOS ingredients is further contributing to segment growth.
  • GOS is widely incorporated in infant nutrition and dairy.
  • High digestive benefits supported by clinical studies.
  • Popular in Europe and Asia for functional foods.
  • Innovation in GOS blends is gaining traction.

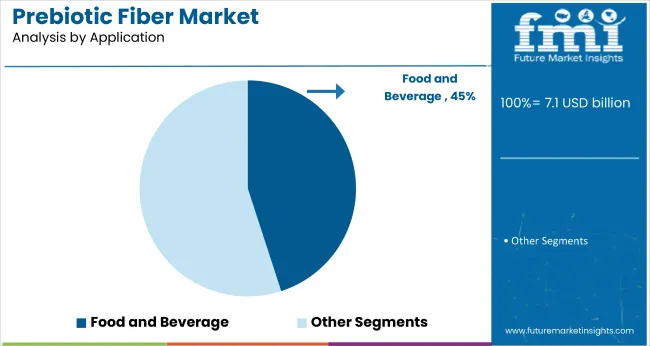
By Application, the Food & Beverage Segment Accounts for 45% of the Market Share

Prebiotic Fiber Market Analysis By Application

The food and beverage is anticipated to dominate the application segment with a 45% share in 2025. Rising demand for fortified products, functional beverages, and health-focused snacks has accelerated the use of prebiotic fiber in this category. Growing consumer interest in gut health is prompting manufacturers to incorporate prebiotics into dairy, beverages, and baked goods.
  • Prebiotics enhance the nutritional profile of everyday food.
  • Strong penetration in functional dairy and health drinks.
  • Growth supported by wellness-focused product innovations.
  • B2B demand rising from large-scale food producers.

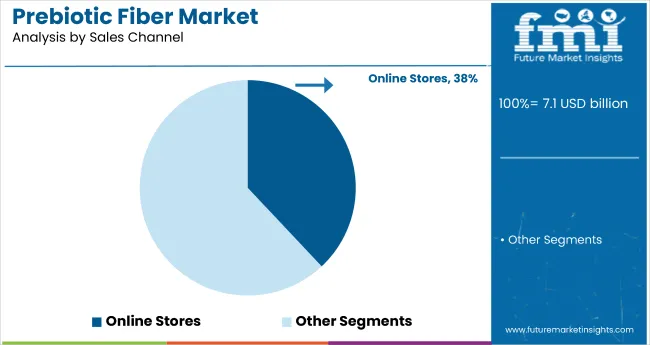
By Sales Channel, Online Stores Account for 38% of the Market Share

Prebiotic Fiber Market Analysis By Sales Channel

Online stores are projected to lead the sales channel segment with a 38% share in 2025. The convenience of e-commerce platforms, broader product visibility, and rising consumer trust in digital purchases have made this channel highly lucrative. The increasing popularity of health supplements and fiber-enriched products is fueling the growth of online health food retailers and specialty nutrition marketplaces, particularly in urban areas.

  • Surge in online health supplement sales post-pandemic.
  • Subscription-based models for prebiotic powders are increasing.
  • Social media influencing prebiotic brand choices.
  • Discount strategies and doorstep delivery attract buyers.

Top Prebiotic Fiber Market Dynamics

Recent Trends in the Prebiotic Fiber Market

  • Rising incorporation of prebiotic fiber in plant-based dairy alternatives and health beverages.
  • Surge in demand for clean-label and organic prebiotic ingredients across developed markets.
  • Increased focus on personalized nutrition is driving innovation in fiber blends and formulations.
  • Expansion of e-commerce platforms is boosting global visibility of prebiotic fiber supplements.

Key Challenges in the Prebiotic Fiber Market
  • High cost of organic and specialty prebiotic ingredients limits mass adoption.
  • Limited awareness of prebiotic benefits in rural and underdeveloped regions.
  • Regulatory differences across regions delay product launches and standardization.
  • Shelf-life and stability issues in prebiotic-infused functional foods pose formulation challenges.

Analyzing Top Countries Producing, Using, and Supplying Prebiotic Fiber

Prebiotic Fiber Market Cagr Analysis By Country

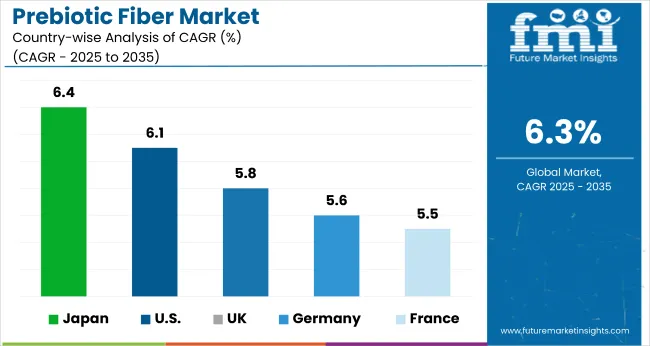
Among the top countries in the market, Japan is projected to register the highest CAGR at 6.4% from 2025 to 2035, driven by a deep-rooted digestive health culture, aging population concerns, and continuous innovation in functional foods and beverages.

The USA follows closely with a 6.1% CAGR, supported by the country’s high intake of dietary supplements, growing awareness of gut health, and widespread adoption of functional food formats. In the UK, the market is expected to expand at a 5.8% CAGR, fueled by clean-label preferences, plant-based food innovation, and strong veganism trends.

Meanwhile, Germany is forecasted to grow at 5.6%, underpinned by research-backed ingredient demand and increasing fortified dairy consumption. France, at 5.5% CAGR, benefits from a combination of product reformulation initiatives and rising interest in organic digestive health solutions, especially in yogurts and cereals. Together, these five countries are shaping the global trajectory of the prebiotic fiber market.

The report covers an in-depth analysis of 40+ countries; five top-performing OECD countries are highlighted below.
USA Prebiotic Fiber Analysis

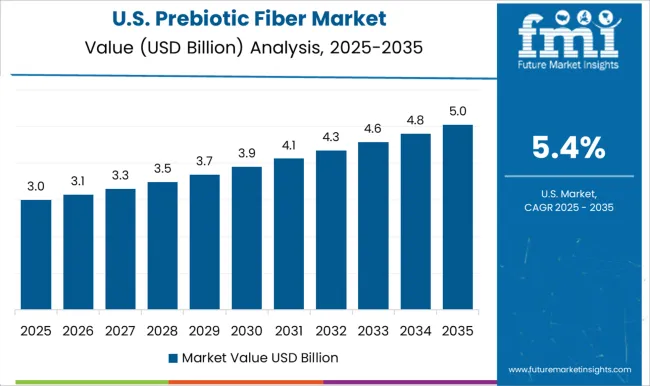
Prebiotic fiber revenue in the USA is projected to grow at a CAGR of 6.1% from 2025 to 2035. Growth is driven by rising demand for gut health supplements, broad awareness of digestive wellness, and increased use of prebiotic fiber in fortified food products. Prebiotics are increasingly incorporated into sports nutrition, dairy alternatives, and breakfast cereals targeting health-conscious consumers.

  • Growing consumer focus on digestive health and clean-label products.
  • Increasing demand for functional foods and beverages.
  • Strong presence of nutraceutical brands and direct-to-consumer platforms.

Prebiotic Fiber Demand Analysis in the UK

The prebiotic fiber market in the UK is expected to grow at a CAGR of 5.8% from 2025 to 2035. Rising adoption of prebiotic dietary supplements and growing preference for organic products are fueling market demand. The shift toward vegan and plant-based diets is accelerating the use of prebiotic fiber in bakery items, non-dairy yogurts, and nutrition bars.
  • Expansion of plant-based and vegan food sectors.
  • High penetration of functional bakery products with added fiber.
  • Consumer shift toward organic and sustainable ingredients.

Germany Prebiotic Fiber Sales Analysis

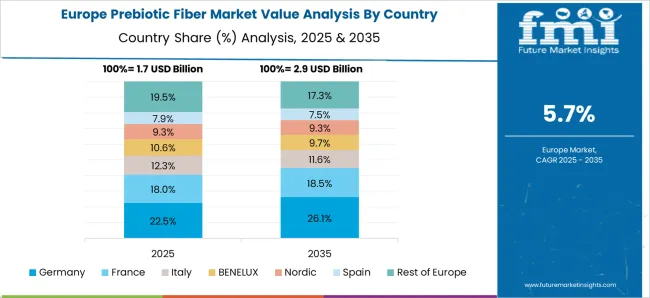
Sales of prebiotic fiber in Germany are projected to grow at a CAGR of 5.6% from 2025 to 2035. The country remains a key innovation hub in Europe, with a strong presence of health food brands and research-driven supplement manufacturers. Prebiotic fibers such as inulin and GOS are widely used in functional yogurts, digestive shots, and health drinks.

  • Growing interest in prebiotics for metabolic and digestive health.
  • Strong research ecosystem supporting product innovation.
  • Rising consumption of fortified dairy and supplement powders.

Prebiotic Fiber Demand Analysis in France

Revenue from prebiotic fiber in France is expected to grow at a CAGR of 5.5% from 2025 to 2035. The country is experiencing steady demand for natural digestive aids and functional foods. Market growth is supported by France’s active involvement in clinical trials and dietary fiber awareness campaigns. Functional beverages and premium nutritional supplements are increasingly being fortified with prebiotics.

  • Increased demand for clean-label digestive wellness products.
  • Chicory and inulin are gaining preference as natural prebiotic sources.
  • Retailers promoting functional beverages and fortified snack bars.

Japan Prebiotic Fiber Analysis

The prebiotic fiber market in Japan is projected to grow at a CAGR of 6.4% from 2025 to 2035. This surge is fueled by the country’s deep-rooted emphasis on gut health, widespread consumption of fermented foods, and increasing demand for functional beverages. An aging population and interest in preventive nutrition are also driving innovation in digestive wellness products.
  • Deep-rooted consumer culture around digestive wellness.
  • Prebiotics are widely incorporated into beverages and ready-to-drink formats.
  • Advanced R&D and clinical trials supporting product efficacy.

Leading Prebiotic Fiber Suppliers

Prebiotic Fiber Market Analysis By Company

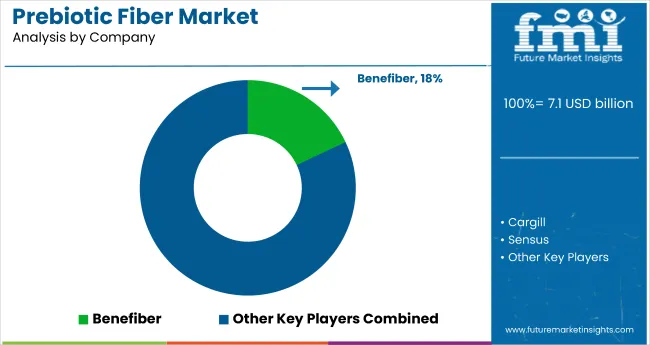
The market is moderately fragmented, with several key players operating across functional food, dietary supplements, and nutraceutical sectors. Prominent companies such as Cargill, FrieslandCampina Domo, Now Foods, and Sensus dominate due to strong product portfolios and global distribution capabilities. These companies are competing on pricing strategies, formulation innovation, strategic partnerships with health food brands, and regional expansion into high-growth markets such as Asia Pacific and Latin America.

Company strategies are increasingly focused on launching clinically supported fiber blends, expanding into e-commerce, and scaling sustainable production. Leading players are aligning product development with consumer demand for organic, non-GMO, and clean-label ingredients. Additionally, strategic acquisitions and R&D collaborations are enabling firms like Cargill and FrieslandCampina to tap into emerging application segments, such as infant nutrition and personalized gut health solutions.

Prebiotic Fiber Market Report Scope

Report Attributes Details
Current Total Market Size (2025) USD 7.1 billion
Projected Market Size (2035) USD 13.1 billion
CAGR (2025 to 2035) 6.3%
Base Year for Estimation 2024
Historical Period 2020 to 2024
Projections Period 2025 to 2035
Market Analysis Parameters Revenue in USD billions / Volume in metric tons
By Nature Organic and Conventional
By Product Type Galacto-Oligosaccharide, Fructo-Oligosaccharide, Mannan-Oligosaccharide, Inulin, and Others
By Sales Channel Direct Sales, Indirect Sales, Supermarket/Hypermarket, Online Stores, Retail Stores
By Application Food and Beverages, Baked Food, Dairy, Breakfast Snacks, Animal Feed, Nutritional Supplements, Others
Regions Covered North America, Latin America, Europe, East Asia, South Asia, Oceania, the Middle East and Africa
Countries Covered United States, Canada, United Kingdom, Germany, France, China, Japan, South Korea, Brazil, Australia and 40+ Countries
Key Players Benefiber, Prebiotin, Now Foods, Cargill, Sensus, Kraft Foods Inc., Yakult Honsha Co. Ltd., KeVita, Maveron, Evolve Biosystems, Attune Foods, Indiebio, BioGaia, Solvay Pharmaceuticals SA, Roquette America Inc., FrieslandCampina Domo, Cosucra Groupe Warcoing SA, GTC Nutrition, and Parmalat S.p.A.
Additional Attributes Dollar sales by value, segment-wise market share, and country-level growth insights provided to guide strategic decisions, identify high-potential regions, and evaluate key application and product trends across the forecast period

Key Segments

By Nature:

  • Organic
  • Conventional

By Product Type:

  • Galacto-Oligosaccharide
  • Fructo-Oligosaccharide
  • Mannan-Oligosaccharide
  • Inulin
  • Other

By Application:

  • Food and Beverages
  • Baked Foods
  • Dairy
  • Breakfast Snacks
  • Animal Feed
  • Nutritional Supplements
  • Others

By Sales Channel:

  • Direct Sales
  • Indirect Sales
  • Supermarket/Hypermarket
  • Online Stores
  • Retail Stores

By Region:

  • North America
  • Latin America
  • Western Europe
  • Eastern Europe
  • East Asia
  • South Asia & Pacific
  • Middle East and Africa

Table of Content

  1. Executive Summary
    • Global Market Outlook
    • Demand-side Trends
    • Supply-side Trends
    • Technology Roadmap Analysis
    • Analysis and Recommendations
  2. Market Overview
    • Market Coverage / Taxonomy
    • Market Definition / Scope / Limitations
  3. Market Background
    • Market Dynamics
      • Drivers
      • Restraints
      • Opportunity
      • Trends
    • Scenario Forecast
      • Demand in Optimistic Scenario
      • Demand in Likely Scenario
      • Demand in Conservative Scenario
    • Opportunity Map Analysis
    • Product Life Cycle Analysis
    • Supply Chain Analysis
      • Supply Side Participants and their Roles
        • Producers
        • Mid-Level Participants (Traders/ Agents/ Brokers)
        • Wholesalers and Distributors
      • Value Added and Value Created at Node in the Supply Chain
      • List of Raw Material Suppliers
      • List of Existing and Potential Buyer’s
    • Investment Feasibility Matrix
    • Value Chain Analysis
      • Profit Margin Analysis
      • Wholesalers and Distributors
      • Retailers
    • PESTLE and Porter’s Analysis
    • Regulatory Landscape
      • By Key Regions
      • By Key Countries
    • Regional Parent Market Outlook
    • Production and Consumption Statistics
    • Import and Export Statistics
  4. Global Market Analysis 2020 to 2024 and Forecast, 2025 to 2035
    • Historical Market Size Value (USD Billion) & Volume (Metric Tons) Analysis, 2020 to 2024
    • Current and Future Market Size Value (USD Billion) & Volume (Metric Tons) Projections, 2025 to 2035
      • Y-o-Y Growth Trend Analysis
      • Absolute $ Opportunity Analysis
  5. Global Market Pricing Analysis 2020 to 2024 and Forecast 2025 to 2035
  6. Global Market Analysis 2020 to 2024 and Forecast 2025 to 2035, By Nature
    • Introduction / Key Findings
    • Historical Market Size Value (USD Billion) & Volume (Metric Tons) Analysis By Nature, 2020 to 2024
    • Current and Future Market Size Value (USD Billion) & Volume (Metric Tons) Analysis and Forecast By Nature, 2025 to 2035
      • Organic
      • Conventional
    • Y-o-Y Growth Trend Analysis By Nature, 2020 to 2024
    • Absolute $ Opportunity Analysis By Nature, 2025 to 2035
  7. Global Market Analysis 2020 to 2024 and Forecast 2025 to 2035, By Product Type
    • Introduction / Key Findings
    • Historical Market Size Value (USD Billion) & Volume (Metric Tons) Analysis By Product Type, 2020 to 2024
    • Current and Future Market Size Value (USD Billion) & Volume (Metric Tons) Analysis and Forecast By Product Type, 2025 to 2035
      • Galacto-Oligosaccharide
      • Fructo-Oligosaccharide
      • Mannan-Oligosaccharide
      • Inulin
      • Other
    • Y-o-Y Growth Trend Analysis By Product Type, 2020 to 2024
    • Absolute $ Opportunity Analysis By Product Type, 2025 to 2035
  8. Global Market Analysis 2020 to 2024 and Forecast 2025 to 2035, By Application
    • Introduction / Key Findings
    • Historical Market Size Value (USD Billion) & Volume (Metric Tons) Analysis By Application, 2020 to 2024
    • Current and Future Market Size Value (USD Billion) & Volume (Metric Tons) Analysis and Forecast By Application, 2025 to 2035
      • Food and Beverages
      • Baked Foods
      • Dairy
      • Breakfast Snacks
      • Animal Feed
      • Nutritional Supplements
      • Others
    • Y-o-Y Growth Trend Analysis By Application, 2020 to 2024
    • Absolute $ Opportunity Analysis By Application, 2025 to 2035
  9. Global Market Analysis 2020 to 2024 and Forecast 2025 to 2035, By Sales Channel
    • Introduction / Key Findings
    • Historical Market Size Value (USD Billion) & Volume (Metric Tons) Analysis By Sales Channel, 2020 to 2024
    • Current and Future Market Size Value (USD Billion) & Volume (Metric Tons) Analysis and Forecast By Sales Channel, 2025 to 2035
      • Direct Sales
      • Indirect Sales
      • Supermarket/Hypermarket
      • Online Stores
      • Retail Stores
    • Y-o-Y Growth Trend Analysis By Sales Channel, 2020 to 2024
    • Absolute $ Opportunity Analysis By Sales Channel, 2025 to 2035
  10. Global Market Analysis 2020 to 2024 and Forecast 2025 to 2035, By Region
    • Introduction
    • Historical Market Size Value (USD Billion) & Volume (Metric Tons) Analysis By Region, 2020 to 2024
    • Current Market Size Value (USD Billion) & Volume (Metric Tons) Analysis and Forecast By Region, 2025 to 2035
      • North America
      • Latin America
      • Western Europe
      • Eastern Europe
      • East Asia
      • South Asia & Pacific
      • Middle East and Africa
    • Market Attractiveness Analysis By Region
  11. North America Market Analysis 2020 to 2024 and Forecast 2025 to 2035, By Country
    • Historical Market Size Value (USD Billion) & Volume (Metric Tons) Trend Analysis By Market Taxonomy, 2020 to 2024
    • Market Size Value (USD Billion) & Volume (Metric Tons) Forecast By Market Taxonomy, 2025 to 2035
      • By Country
        • USA
        • Canada
        • Mexico
      • By Nature
      • By Product Type
      • By Application
      • By Sales Channel
    • Market Attractiveness Analysis
      • By Country
      • By Nature
      • By Product Type
      • By Application
      • By Sales Channel
    • Key Takeaways
  12. Latin America Market Analysis 2020 to 2024 and Forecast 2025 to 2035, By Country
    • Historical Market Size Value (USD Billion) & Volume (Metric Tons) Trend Analysis By Market Taxonomy, 2020 to 2024
    • Market Size Value (USD Billion) & Volume (Metric Tons) Forecast By Market Taxonomy, 2025 to 2035
      • By Country
        • Brazil
        • Argentina
        • Rest of LATAM
      • By Nature
      • By Product Type
      • By Application
      • By Sales Channel
    • Market Attractiveness Analysis
      • By Country
      • By Nature
      • By Product Type
      • By Application
      • By Sales Channel
    • Key Takeaways
  13. Western Europe Market Analysis 2020 to 2024 and Forecast 2025 to 2035, By Country
    • Historical Market Size Value (USD Billion) & Volume (Metric Tons) Trend Analysis By Market Taxonomy, 2020 to 2024
    • Market Size Value (USD Billion) & Volume (Metric Tons) Forecast By Market Taxonomy, 2025 to 2035
      • By Country
        • Germany
        • Italy
        • France
        • UK
        • Spain
        • BENELUX
        • Nordic
        • Rest of W.Europe
      • By Nature
      • By Product Type
      • By Application
      • By Sales Channel
    • Market Attractiveness Analysis
      • By Country
      • By Nature
      • By Product Type
      • By Application
      • By Sales Channel
    • Key Takeaways
  14. Eastern Europe Market Analysis 2020 to 2024 and Forecast 2025 to 2035, By Country
    • Historical Market Size Value (USD Billion) & Volume (Metric Tons) Trend Analysis By Market Taxonomy, 2020 to 2024
    • Market Size Value (USD Billion) & Volume (Metric Tons) Forecast By Market Taxonomy, 2025 to 2035
      • By Country
        • Russia
        • Hungary
        • Poland
        • Balkan & Baltics
        • Rest of E. Europe
      • By Nature
      • By Product Type
      • By Application
      • By Sales Channel
    • Market Attractiveness Analysis
      • By Country
      • By Nature
      • By Product Type
      • By Application
      • By Sales Channel
    • Key Takeaways
  15. East Asia Market Analysis 2020 to 2024 and Forecast 2025 to 2035, By Country
    • Historical Market Size Value (USD Billion) & Volume (Metric Tons) Trend Analysis By Market Taxonomy, 2020 to 2024
    • Market Size Value (USD Billion) & Volume (Metric Tons) Forecast By Market Taxonomy, 2025 to 2035
      • By Country
        • China
        • Japan
        • South Korea
      • By Nature
      • By Product Type
      • By Application
      • By Sales Channel
    • Market Attractiveness Analysis
      • By Country
      • By Nature
      • By Product Type
      • By Application
      • By Sales Channel
    • Key Takeaways
  16. South Asia & Pacific Market Analysis 2020 to 2024 and Forecast 2025 to 2035, By Country
    • Historical Market Size Value (USD Billion) & Volume (Metric Tons) Trend Analysis By Market Taxonomy, 2020 to 2024
    • Market Size Value (USD Billion) & Volume (Metric Tons) Forecast By Market Taxonomy, 2025 to 2035
      • By Country
        • India
        • Australia & New Zealand
        • ASEAN
        • Rest of SAP
      • By Nature
      • By Product Type
      • By Application
      • By Sales Channel
    • Market Attractiveness Analysis
      • By Country
      • By Nature
      • By Product Type
      • By Application
      • By Sales Channel
    • Key Takeaways
  17. Middle East and Africa Market Analysis 2020 to 2024 and Forecast 2025 to 2035, By Country
    • Historical Market Size Value (USD Billion) & Volume (Metric Tons) Trend Analysis By Market Taxonomy, 2020 to 2024
    • Market Size Value (USD Billion) & Volume (Metric Tons) Forecast By Market Taxonomy, 2025 to 2035
      • By Country
        • GCC Countries
        • Northern Africa
        • South Africa
        • Turkiye
        • Rest of MEA
      • By Nature
      • By Product Type
      • By Application
      • By Sales Channel
    • Market Attractiveness Analysis
      • By Country
      • By Nature
      • By Product Type
      • By Application
      • By Sales Channel
    • Key Takeaways
  18. Key Countries Market Analysis
    • USA
      • Pricing Analysis
      • Market Share Analysis, 2024
        • By Nature
        • By Product Type
        • By Application
        • By Sales Channel
    • Canada
      • Pricing Analysis
      • Market Share Analysis, 2024
        • By Nature
        • By Product Type
        • By Application
        • By Sales Channel
    • Brazil
      • Pricing Analysis
      • Market Share Analysis, 2024
        • By Nature
        • By Product Type
        • By Application
        • By Sales Channel
    • Mexico
      • Pricing Analysis
      • Market Share Analysis, 2024
        • By Nature
        • By Product Type
        • By Application
        • By Sales Channel
    • Argentina
      • Pricing Analysis
      • Market Share Analysis, 2024
        • By Nature
        • By Product Type
        • By Application
        • By Sales Channel
  19. Market Structure Analysis
    • Competition Dashboard
    • Competition Benchmarking
    • Market Share Analysis of Top Players
      • By Regional
      • By Nature
      • By Product Type
      • By Application
      • By Sales Channel
  20. Competition Analysis
    • Competition Deep Dive
      • Benefiber
        • Overview
        • Product Portfolio
        • Profitability by Market Segments (Product/Age /Sales Channel/Region)
        • Sales Footprint
        • Strategy Overview
          • Marketing Strategy
          • Product Strategy
          • Channel Strategy
      • Prebiotin
        • Overview
        • Product Portfolio
        • Profitability by Market Segments (Product/Age /Sales Channel/Region)
        • Sales Footprint
        • Strategy Overview
          • Marketing Strategy
          • Product Strategy
          • Channel Strategy
      • Now Foods
        • Overview
        • Product Portfolio
        • Profitability by Market Segments (Product/Age /Sales Channel/Region)
        • Sales Footprint
        • Strategy Overview
          • Marketing Strategy
          • Product Strategy
          • Channel Strategy
      • Cargill
        • Overview
        • Product Portfolio
        • Profitability by Market Segments (Product/Age /Sales Channel/Region)
        • Sales Footprint
        • Strategy Overview
          • Marketing Strategy
          • Product Strategy
          • Channel Strategy
      • Sensus
        • Overview
        • Product Portfolio
        • Profitability by Market Segments (Product/Age /Sales Channel/Region)
        • Sales Footprint
        • Strategy Overview
          • Marketing Strategy
          • Product Strategy
          • Channel Strategy
      • Kraft Foods Inc.
        • Overview
        • Product Portfolio
        • Profitability by Market Segments (Product/Age /Sales Channel/Region)
        • Sales Footprint
        • Strategy Overview
          • Marketing Strategy
          • Product Strategy
          • Channel Strategy
      • Yakult Honsha Co. Ltd.
        • Overview
        • Product Portfolio
        • Profitability by Market Segments (Product/Age /Sales Channel/Region)
        • Sales Footprint
        • Strategy Overview
          • Marketing Strategy
          • Product Strategy
          • Channel Strategy
      • KeVita
        • Overview
        • Product Portfolio
        • Profitability by Market Segments (Product/Age /Sales Channel/Region)
        • Sales Footprint
        • Strategy Overview
          • Marketing Strategy
          • Product Strategy
          • Channel Strategy
      • Maveron
        • Overview
        • Product Portfolio
        • Profitability by Market Segments (Product/Age /Sales Channel/Region)
        • Sales Footprint
        • Strategy Overview
          • Marketing Strategy
          • Product Strategy
          • Channel Strategy
      • Evolve Biosystems
        • Overview
        • Product Portfolio
        • Profitability by Market Segments (Product/Age /Sales Channel/Region)
        • Sales Footprint
        • Strategy Overview
          • Marketing Strategy
          • Product Strategy
          • Channel Strategy
      • Attune Foods
        • Overview
        • Product Portfolio
        • Profitability by Market Segments (Product/Age /Sales Channel/Region)
        • Sales Footprint
        • Strategy Overview
          • Marketing Strategy
          • Product Strategy
          • Channel Strategy
      • Indiebio
        • Overview
        • Product Portfolio
        • Profitability by Market Segments (Product/Age /Sales Channel/Region)
        • Sales Footprint
        • Strategy Overview
          • Marketing Strategy
          • Product Strategy
          • Channel Strategy
      • BioGaia
        • Overview
        • Product Portfolio
        • Profitability by Market Segments (Product/Age /Sales Channel/Region)
        • Sales Footprint
        • Strategy Overview
          • Marketing Strategy
          • Product Strategy
          • Channel Strategy
      • Solvay Pharmaceuticals SA
        • Overview
        • Product Portfolio
        • Profitability by Market Segments (Product/Age /Sales Channel/Region)
        • Sales Footprint
        • Strategy Overview
          • Marketing Strategy
          • Product Strategy
          • Channel Strategy
      • Roquette America, Inc.
        • Overview
        • Product Portfolio
        • Profitability by Market Segments (Product/Age /Sales Channel/Region)
        • Sales Footprint
        • Strategy Overview
          • Marketing Strategy
          • Product Strategy
          • Channel Strategy
      • FrieslandCampina Domo
        • Overview
        • Product Portfolio
        • Profitability by Market Segments (Product/Age /Sales Channel/Region)
        • Sales Footprint
        • Strategy Overview
          • Marketing Strategy
          • Product Strategy
          • Channel Strategy
      • Cosucra Groupe Warcoing SA
        • Overview
        • Product Portfolio
        • Profitability by Market Segments (Product/Age /Sales Channel/Region)
        • Sales Footprint
        • Strategy Overview
          • Marketing Strategy
          • Product Strategy
          • Channel Strategy
      • GTC Nutrition
        • Overview
        • Product Portfolio
        • Profitability by Market Segments (Product/Age /Sales Channel/Region)
        • Sales Footprint
        • Strategy Overview
          • Marketing Strategy
          • Product Strategy
          • Channel Strategy
      • Parmalat S.p.A.
        • Overview
        • Product Portfolio
        • Profitability by Market Segments (Product/Age /Sales Channel/Region)
        • Sales Footprint
        • Strategy Overview
          • Marketing Strategy
          • Product Strategy
          • Channel Strategy
  21. Assumptions & Acronyms Used
  22. Research Methodology

List of Tables

  • Table 1: Global Market Value (USD Billion) Forecast by Region, 2020-2035
  • Table 2: Global Market Volume (Metric Tons) Forecast by Region, 2020-2035
  • Table 3: Global Market Value (USD Billion) Forecast by Nature, 2020-2035
  • Table 4: Global Market Volume (Metric Tons) Forecast by Nature, 2020-2035
  • Table 5: Global Market Value (USD Billion) Forecast by Product Type, 2020-2035
  • Table 6: Global Market Volume (Metric Tons) Forecast by Product Type, 2020-2035
  • Table 7: Global Market Value (USD Billion) Forecast by Application, 2020-2035
  • Table 8: Global Market Volume (Metric Tons) Forecast by Application, 2020-2035
  • Table 9: Global Market Value (USD Billion) Forecast by Sales Channel, 2020-2035
  • Table 10: Global Market Volume (Metric Tons) Forecast by Sales Channel, 2020-2035
  • Table 11: North America Market Value (USD Billion) Forecast by Country, 2020-2035
  • Table 12: North America Market Volume (Metric Tons) Forecast by Country, 2020-2035
  • Table 13: North America Market Value (USD Billion) Forecast by Nature, 2020-2035
  • Table 14: North America Market Volume (Metric Tons) Forecast by Nature, 2020-2035
  • Table 15: North America Market Value (USD Billion) Forecast by Product Type, 2020-2035
  • Table 16: North America Market Volume (Metric Tons) Forecast by Product Type, 2020-2035
  • Table 17: North America Market Value (USD Billion) Forecast by Application, 2020-2035
  • Table 18: North America Market Volume (Metric Tons) Forecast by Application, 2020-2035
  • Table 19: North America Market Value (USD Billion) Forecast by Sales Channel, 2020-2035
  • Table 20: North America Market Volume (Metric Tons) Forecast by Sales Channel, 2020-2035
  • Table 21: Latin America Market Value (USD Billion) Forecast by Country, 2020-2035
  • Table 22: Latin America Market Volume (Metric Tons) Forecast by Country, 2020-2035
  • Table 23: Latin America Market Value (USD Billion) Forecast by Nature, 2020-2035
  • Table 24: Latin America Market Volume (Metric Tons) Forecast by Nature, 2020-2035
  • Table 25: Latin America Market Value (USD Billion) Forecast by Product Type, 2020-2035
  • Table 26: Latin America Market Volume (Metric Tons) Forecast by Product Type, 2020-2035
  • Table 27: Latin America Market Value (USD Billion) Forecast by Application, 2020-2035
  • Table 28: Latin America Market Volume (Metric Tons) Forecast by Application, 2020-2035
  • Table 29: Latin America Market Value (USD Billion) Forecast by Sales Channel, 2020-2035
  • Table 30: Latin America Market Volume (Metric Tons) Forecast by Sales Channel, 2020-2035
  • Table 31: Western Europe Market Value (USD Billion) Forecast by Country, 2020-2035
  • Table 32: Western Europe Market Volume (Metric Tons) Forecast by Country, 2020-2035
  • Table 33: Western Europe Market Value (USD Billion) Forecast by Nature, 2020-2035
  • Table 34: Western Europe Market Volume (Metric Tons) Forecast by Nature, 2020-2035
  • Table 35: Western Europe Market Value (USD Billion) Forecast by Product Type, 2020-2035
  • Table 36: Western Europe Market Volume (Metric Tons) Forecast by Product Type, 2020-2035
  • Table 37: Western Europe Market Value (USD Billion) Forecast by Application, 2020-2035
  • Table 38: Western Europe Market Volume (Metric Tons) Forecast by Application, 2020-2035
  • Table 39: Western Europe Market Value (USD Billion) Forecast by Sales Channel, 2020-2035
  • Table 40: Western Europe Market Volume (Metric Tons) Forecast by Sales Channel, 2020-2035
  • Table 41: Eastern Europe Market Value (USD Billion) Forecast by Country, 2020-2035
  • Table 42: Eastern Europe Market Volume (Metric Tons) Forecast by Country, 2020-2035
  • Table 43: Eastern Europe Market Value (USD Billion) Forecast by Nature, 2020-2035
  • Table 44: Eastern Europe Market Volume (Metric Tons) Forecast by Nature, 2020-2035
  • Table 45: Eastern Europe Market Value (USD Billion) Forecast by Product Type, 2020-2035
  • Table 46: Eastern Europe Market Volume (Metric Tons) Forecast by Product Type, 2020-2035
  • Table 47: Eastern Europe Market Value (USD Billion) Forecast by Application, 2020-2035
  • Table 48: Eastern Europe Market Volume (Metric Tons) Forecast by Application, 2020-2035
  • Table 49: Eastern Europe Market Value (USD Billion) Forecast by Sales Channel, 2020-2035
  • Table 50: Eastern Europe Market Volume (Metric Tons) Forecast by Sales Channel, 2020-2035
  • Table 51: East Asia Market Value (USD Billion) Forecast by Country, 2020-2035
  • Table 52: East Asia Market Volume (Metric Tons) Forecast by Country, 2020-2035
  • Table 53: East Asia Market Value (USD Billion) Forecast by Nature, 2020-2035
  • Table 54: East Asia Market Volume (Metric Tons) Forecast by Nature, 2020-2035
  • Table 55: East Asia Market Value (USD Billion) Forecast by Product Type, 2020-2035
  • Table 56: East Asia Market Volume (Metric Tons) Forecast by Product Type, 2020-2035
  • Table 57: East Asia Market Value (USD Billion) Forecast by Application, 2020-2035
  • Table 58: East Asia Market Volume (Metric Tons) Forecast by Application, 2020-2035
  • Table 59: East Asia Market Value (USD Billion) Forecast by Sales Channel, 2020-2035
  • Table 60: East Asia Market Volume (Metric Tons) Forecast by Sales Channel, 2020-2035
  • Table 61: South Asia & Pacific Market Value (USD Billion) Forecast by Country, 2020-2035
  • Table 62: South Asia & Pacific Market Volume (Metric Tons) Forecast by Country, 2020-2035
  • Table 63: South Asia & Pacific Market Value (USD Billion) Forecast by Nature, 2020-2035
  • Table 64: South Asia & Pacific Market Volume (Metric Tons) Forecast by Nature, 2020-2035
  • Table 65: South Asia & Pacific Market Value (USD Billion) Forecast by Product Type, 2020-2035
  • Table 66: South Asia & Pacific Market Volume (Metric Tons) Forecast by Product Type, 2020-2035
  • Table 67: South Asia & Pacific Market Value (USD Billion) Forecast by Application, 2020-2035
  • Table 68: South Asia & Pacific Market Volume (Metric Tons) Forecast by Application, 2020-2035
  • Table 69: South Asia & Pacific Market Value (USD Billion) Forecast by Sales Channel, 2020-2035
  • Table 70: South Asia & Pacific Market Volume (Metric Tons) Forecast by Sales Channel, 2020-2035
  • Table 71: Middle East and Africa Market Value (USD Billion) Forecast by Country, 2020-2035
  • Table 72: Middle East and Africa Market Volume (Metric Tons) Forecast by Country, 2020-2035
  • Table 73: Middle East and Africa Market Value (USD Billion) Forecast by Nature, 2020-2035
  • Table 74: Middle East and Africa Market Volume (Metric Tons) Forecast by Nature, 2020-2035
  • Table 75: Middle East and Africa Market Value (USD Billion) Forecast by Product Type, 2020-2035
  • Table 76: Middle East and Africa Market Volume (Metric Tons) Forecast by Product Type, 2020-2035
  • Table 77: Middle East and Africa Market Value (USD Billion) Forecast by Application, 2020-2035
  • Table 78: Middle East and Africa Market Volume (Metric Tons) Forecast by Application, 2020-2035
  • Table 79: Middle East and Africa Market Value (USD Billion) Forecast by Sales Channel, 2020-2035
  • Table 80: Middle East and Africa Market Volume (Metric Tons) Forecast by Sales Channel, 2020-2035

List of Figures

  • Figure 1: Global Market Volume (Metric Tons) Forecast 2020-2035
  • Figure 2: Global Market Pricing Analysis
  • Figure 3: Global Market Value (USD Billion) Forecast 2020-2035
  • Figure 4: Global Market Value Share and BPS Analysis by Nature, 2025 and 2035
  • Figure 5: Global Market Y-o-Y Growth Comparison by Nature, 2025-2035
  • Figure 6: Global Market Attractiveness Analysis by Nature
  • Figure 7: Global Market Value Share and BPS Analysis by Product Type, 2025 and 2035
  • Figure 8: Global Market Y-o-Y Growth Comparison by Product Type, 2025-2035
  • Figure 9: Global Market Attractiveness Analysis by Product Type
  • Figure 10: Global Market Value Share and BPS Analysis by Application, 2025 and 2035
  • Figure 11: Global Market Y-o-Y Growth Comparison by Application, 2025-2035
  • Figure 12: Global Market Attractiveness Analysis by Application
  • Figure 13: Global Market Value Share and BPS Analysis by Sales Channel, 2025 and 2035
  • Figure 14: Global Market Y-o-Y Growth Comparison by Sales Channel, 2025-2035
  • Figure 15: Global Market Attractiveness Analysis by Sales Channel
  • Figure 16: Global Market Value (USD Billion) Share and BPS Analysis by Region, 2025 and 2035
  • Figure 17: Global Market Y-o-Y Growth Comparison by Region, 2025-2035
  • Figure 18: Global Market Attractiveness Analysis by Region
  • Figure 19: North America Market Incremental $ Opportunity, 2025-2035
  • Figure 20: Latin America Market Incremental $ Opportunity, 2025-2035
  • Figure 21: Western Europe Market Incremental $ Opportunity, 2025-2035
  • Figure 22: Eastern Europe Market Incremental $ Opportunity, 2025-2035
  • Figure 23: East Asia Market Incremental $ Opportunity, 2025-2035
  • Figure 24: South Asia & Pacific Market Incremental $ Opportunity, 2025-2035
  • Figure 25: Middle East and Africa Market Incremental $ Opportunity, 2025-2035
  • Figure 26: North America Market Value Share and BPS Analysis by Country, 2025 and 2035
  • Figure 27: North America Market Value Share and BPS Analysis by Nature, 2025 and 2035
  • Figure 28: North America Market Y-o-Y Growth Comparison by Nature, 2025-2035
  • Figure 29: North America Market Attractiveness Analysis by Nature
  • Figure 30: North America Market Value Share and BPS Analysis by Product Type, 2025 and 2035
  • Figure 31: North America Market Y-o-Y Growth Comparison by Product Type, 2025-2035
  • Figure 32: North America Market Attractiveness Analysis by Product Type
  • Figure 33: North America Market Value Share and BPS Analysis by Application, 2025 and 2035
  • Figure 34: North America Market Y-o-Y Growth Comparison by Application, 2025-2035
  • Figure 35: North America Market Attractiveness Analysis by Application
  • Figure 36: North America Market Value Share and BPS Analysis by Sales Channel, 2025 and 2035
  • Figure 37: North America Market Y-o-Y Growth Comparison by Sales Channel, 2025-2035
  • Figure 38: North America Market Attractiveness Analysis by Sales Channel
  • Figure 39: Latin America Market Value Share and BPS Analysis by Country, 2025 and 2035
  • Figure 40: Latin America Market Value Share and BPS Analysis by Nature, 2025 and 2035
  • Figure 41: Latin America Market Y-o-Y Growth Comparison by Nature, 2025-2035
  • Figure 42: Latin America Market Attractiveness Analysis by Nature
  • Figure 43: Latin America Market Value Share and BPS Analysis by Product Type, 2025 and 2035
  • Figure 44: Latin America Market Y-o-Y Growth Comparison by Product Type, 2025-2035
  • Figure 45: Latin America Market Attractiveness Analysis by Product Type
  • Figure 46: Latin America Market Value Share and BPS Analysis by Application, 2025 and 2035
  • Figure 47: Latin America Market Y-o-Y Growth Comparison by Application, 2025-2035
  • Figure 48: Latin America Market Attractiveness Analysis by Application
  • Figure 49: Latin America Market Value Share and BPS Analysis by Sales Channel, 2025 and 2035
  • Figure 50: Latin America Market Y-o-Y Growth Comparison by Sales Channel, 2025-2035
  • Figure 51: Latin America Market Attractiveness Analysis by Sales Channel
  • Figure 52: Western Europe Market Value Share and BPS Analysis by Country, 2025 and 2035
  • Figure 53: Western Europe Market Value Share and BPS Analysis by Nature, 2025 and 2035
  • Figure 54: Western Europe Market Y-o-Y Growth Comparison by Nature, 2025-2035
  • Figure 55: Western Europe Market Attractiveness Analysis by Nature
  • Figure 56: Western Europe Market Value Share and BPS Analysis by Product Type, 2025 and 2035
  • Figure 57: Western Europe Market Y-o-Y Growth Comparison by Product Type, 2025-2035
  • Figure 58: Western Europe Market Attractiveness Analysis by Product Type
  • Figure 59: Western Europe Market Value Share and BPS Analysis by Application, 2025 and 2035
  • Figure 60: Western Europe Market Y-o-Y Growth Comparison by Application, 2025-2035
  • Figure 61: Western Europe Market Attractiveness Analysis by Application
  • Figure 62: Western Europe Market Value Share and BPS Analysis by Sales Channel, 2025 and 2035
  • Figure 63: Western Europe Market Y-o-Y Growth Comparison by Sales Channel, 2025-2035
  • Figure 64: Western Europe Market Attractiveness Analysis by Sales Channel
  • Figure 65: Eastern Europe Market Value Share and BPS Analysis by Country, 2025 and 2035
  • Figure 66: Eastern Europe Market Value Share and BPS Analysis by Nature, 2025 and 2035
  • Figure 67: Eastern Europe Market Y-o-Y Growth Comparison by Nature, 2025-2035
  • Figure 68: Eastern Europe Market Attractiveness Analysis by Nature
  • Figure 69: Eastern Europe Market Value Share and BPS Analysis by Product Type, 2025 and 2035
  • Figure 70: Eastern Europe Market Y-o-Y Growth Comparison by Product Type, 2025-2035
  • Figure 71: Eastern Europe Market Attractiveness Analysis by Product Type
  • Figure 72: Eastern Europe Market Value Share and BPS Analysis by Application, 2025 and 2035
  • Figure 73: Eastern Europe Market Y-o-Y Growth Comparison by Application, 2025-2035
  • Figure 74: Eastern Europe Market Attractiveness Analysis by Application
  • Figure 75: Eastern Europe Market Value Share and BPS Analysis by Sales Channel, 2025 and 2035
  • Figure 76: Eastern Europe Market Y-o-Y Growth Comparison by Sales Channel, 2025-2035
  • Figure 77: Eastern Europe Market Attractiveness Analysis by Sales Channel
  • Figure 78: East Asia Market Value Share and BPS Analysis by Country, 2025 and 2035
  • Figure 79: East Asia Market Value Share and BPS Analysis by Nature, 2025 and 2035
  • Figure 80: East Asia Market Y-o-Y Growth Comparison by Nature, 2025-2035
  • Figure 81: East Asia Market Attractiveness Analysis by Nature
  • Figure 82: East Asia Market Value Share and BPS Analysis by Product Type, 2025 and 2035
  • Figure 83: East Asia Market Y-o-Y Growth Comparison by Product Type, 2025-2035
  • Figure 84: East Asia Market Attractiveness Analysis by Product Type
  • Figure 85: East Asia Market Value Share and BPS Analysis by Application, 2025 and 2035
  • Figure 86: East Asia Market Y-o-Y Growth Comparison by Application, 2025-2035
  • Figure 87: East Asia Market Attractiveness Analysis by Application
  • Figure 88: East Asia Market Value Share and BPS Analysis by Sales Channel, 2025 and 2035
  • Figure 89: East Asia Market Y-o-Y Growth Comparison by Sales Channel, 2025-2035
  • Figure 90: East Asia Market Attractiveness Analysis by Sales Channel
  • Figure 91: South Asia & Pacific Market Value Share and BPS Analysis by Country, 2025 and 2035
  • Figure 92: South Asia & Pacific Market Value Share and BPS Analysis by Nature, 2025 and 2035
  • Figure 93: South Asia & Pacific Market Y-o-Y Growth Comparison by Nature, 2025-2035
  • Figure 94: South Asia & Pacific Market Attractiveness Analysis by Nature
  • Figure 95: South Asia & Pacific Market Value Share and BPS Analysis by Product Type, 2025 and 2035
  • Figure 96: South Asia & Pacific Market Y-o-Y Growth Comparison by Product Type, 2025-2035
  • Figure 97: South Asia & Pacific Market Attractiveness Analysis by Product Type
  • Figure 98: South Asia & Pacific Market Value Share and BPS Analysis by Application, 2025 and 2035
  • Figure 99: South Asia & Pacific Market Y-o-Y Growth Comparison by Application, 2025-2035
  • Figure 100: South Asia & Pacific Market Attractiveness Analysis by Application
  • Figure 101: South Asia & Pacific Market Value Share and BPS Analysis by Sales Channel, 2025 and 2035
  • Figure 102: South Asia & Pacific Market Y-o-Y Growth Comparison by Sales Channel, 2025-2035
  • Figure 103: South Asia & Pacific Market Attractiveness Analysis by Sales Channel
  • Figure 104: Middle East and Africa Market Value Share and BPS Analysis by Country, 2025 and 2035
  • Figure 105: Middle East and Africa Market Value Share and BPS Analysis by Nature, 2025 and 2035
  • Figure 106: Middle East and Africa Market Y-o-Y Growth Comparison by Nature, 2025-2035
  • Figure 107: Middle East and Africa Market Attractiveness Analysis by Nature
  • Figure 108: Middle East and Africa Market Value Share and BPS Analysis by Product Type, 2025 and 2035
  • Figure 109: Middle East and Africa Market Y-o-Y Growth Comparison by Product Type, 2025-2035
  • Figure 110: Middle East and Africa Market Attractiveness Analysis by Product Type
  • Figure 111: Middle East and Africa Market Value Share and BPS Analysis by Application, 2025 and 2035
  • Figure 112: Middle East and Africa Market Y-o-Y Growth Comparison by Application, 2025-2035
  • Figure 113: Middle East and Africa Market Attractiveness Analysis by Application
  • Figure 114: Middle East and Africa Market Value Share and BPS Analysis by Sales Channel, 2025 and 2035
  • Figure 115: Middle East and Africa Market Y-o-Y Growth Comparison by Sales Channel, 2025-2035
  • Figure 116: Middle East and Africa Market Attractiveness Analysis by Sales Channel
  • Figure 117: Global Market - Tier Structure Analysis
  • Figure 118: Global Market - Company Share Analysis

Frequently Asked Questions

What is the projected size of the prebiotic fiber market in 2025?

The market is valued at USD 7.1 billion in 2025.

What is the outlook on prebiotic fiber demand by 2035?

The market is forecasted to reach USD 13.1 billion by 2035, reflecting a CAGR of 6.3%.

Which segment leads the prebiotic fiber market by nature in 2025?

The conventional segment will lead the nature segment, accounting for 68% of the global market share in 2025.

What is the top application sector for the prebiotic fiber market in 2025?

Food and beverages will dominate the application segment with a 45% share in 2025.

Which country is projected to have the fastest-growing prebiotic fiber market?

Japan is projected to grow at the fastest rate, with a CAGR of 6.4% from 2025 to 2035.

Explore Similar Insights

Future Market Insights

Prebiotic Fiber Market