Prebiotic Deodorants Market Size and Share Forecast Outlook 2025 to 2035

The Prebiotic Deodorants Market is expected to record a valuation of USD 663.8 million in 2025 and USD 1,010.3 million in 2035, with an increase of USD 346.2 million, which equals a growth of 52.2% over the decade. The overall expansion represents a CAGR of 4.3% and a 1.5X increase in market size.
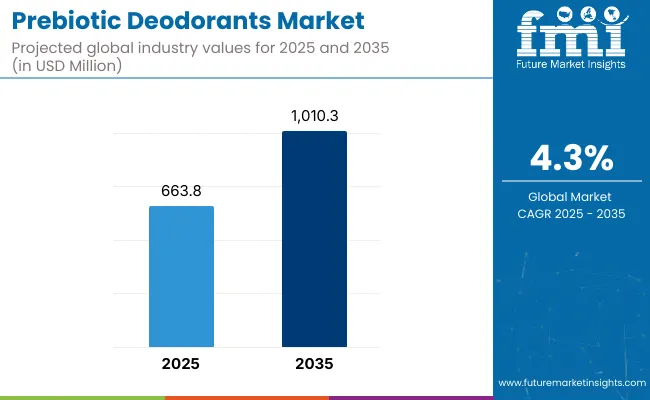
Quick Stats for Prebiotic Deodorants Market

  • Prebiotic Deodorants Market Value (2025): USD 663.8 million
  • Prebiotic Deodorants Market Forecast Value (2035): USD 1,010.3 million
  • Prebiotic Deodorants Market Forecast CAGR: 4.3%
  • Leading Segment in Prebiotic Deodorants Market in 2025: Stick Deodorants (34.3% )
  • Key Growth Regions in the Prebiotic Deodorants Market: North America, Asia-Pacific, Europe
  • Top Key Players in Prebiotic Deodorants Market: Native, Corpus Naturals, Wild, Salt & Stone, Kosas, Drunk Elephant, AKT London, Hume, Malin + Goetz, Schmidt’s Naturals

Prebiotic Deodorants Market

Metric Value
Prebiotic Deodorants Market Estimated Value in (2025E) USD 663.8 million
Prebiotic Deodorants Market Forecast Value in (2035F) USD 1,010.3 million
Forecast CAGR (2025 to 2035) 4.3%

During the first five-year period from 2025 to 2030, the market increases from USD 663.8 million to USD 818.92million, which accounts for 45.0% of the total decade growth. This phase records steady adoption in wellness retail, dermatology-led skin care channels, and refillable product types, driven by the need for microbiome-safe deodorants. Stick deodorants dominate this period as they cater to over 34.3% of format-specific demand for daily-use personal care.

The second half from 2030 to 2035 contributes USD 191.3 million, equal to 55.0% of total growth, as the market jumps to USD 1,010.3 million. This acceleration is powered by widespread deployment of plant-based ingredient innovations, refillable packaging systems, and DTC ecosystem expansion in Asia-Pacific and India. Fermentation-derived and marine-origin prebiotics together capture a larger share above 40% by the end of the decade. Digital-native brands and subscription commerce add recurring revenue, increasing the online and DTC distribution share beyond 50% in total market value.

From 2020 to 2024, the Prebiotic Deodorants Market grew from USD 432.1 million to USD 660.8 million, driven by early consumer adoption of microbiome-friendly and aluminum-free personal care products. During this period, the competitive landscape was dominated by natural deodorant brands controlling nearly 70% of category revenue, with leaders such as Native, Schmidt’s Naturals, and Corpus Naturals focusing on stick-based formats using plant-derived ingredients.

Competitive differentiation relied on clean-label claims, DTC convenience, and dermatological safety, while prebiotic actives were often included as secondary benefits rather than core functional claims. Refillable systems and sustainable packaging saw limited traction, contributing less than 15% of total market value.

Demand for prebiotic deodorants will expand and the revenue mix will shift as digital-native brands, refill formats, and personalized formulations grow to over 40% share. Traditional category leaders face rising competition from ingredient-focused startups offering transparent sourcing, AI-powered product recommendations, and subscription-based delivery.

Major deodorant brands are pivoting to hybrid models, integrating skin health analytics, zero-waste packaging, and consumer engagement ecosystems to retain relevance. Emerging entrants specializing in refill logistics, skin microbiome testing, and sustainable personalization are gaining share. The competitive advantage is moving away from fragrance-based differentiation alone to holistic ecosystem valuebalancing function, formulation transparency, and recurring revenue generation.

Why the Prebiotic Deodorants Market is growing?

A growing number of consumers are shifting away from traditional antiperspirants due to concerns over aluminum salts disrupting the skin’s natural microbiome and sweat regulation. Prebiotic deodorants offer a functional alternative by nurturing beneficial skin bacteria, which in turn reduces odor without suppressing sweat glands.

This scientific positioning is gaining traction, especially among dermatology-conscious and health-aware users. As clinical studies validating microbiome health grow in skincare, deodorant brands are increasingly highlighting prebiotic ingredients as a safer and more effective odor management strategy. This shift is redefining what constitutes "clean" underarm care beyond just fragrance or aluminum-free labels.

Prebiotic deodorant brands are among the first in personal care to successfully integrate subscription-based delivery with refillable packaging systems, improving both environmental appeal and usage continuity. This model enhances customer retention by eliminating shelf-space competition and promoting habitual reordering directly from DTC platforms.

With formulations tailored for sensitive skin and specific skin conditions, many consumers find fewer reasons to switch products once they’ve adapted to a microbiome-friendly routine. These delivery models also allow brands to gather user data and iterate products rapidly, creating a strong feedback loop that keeps customers engaged and invested long-termboosting both adoption and market growth.

Segmental Analysis

The prebiotic deodorants market is witnessing a diverse product segmentation, with stick deodorants emerging as the most preferred format due to ease of use and long-lasting formulations, while spray and roll-on variants also maintain high consumer traction. Cream & balm and wipe & sheet deodorants are gaining niche adoption in skincare-integrated routines.

On the ingredient front, plant-based prebiotics such as inulin and yacon root dominate due to their skin-friendly appeal, although fermentation-derived and marine-origin prebiotics are drawing attention for enhanced microbiome benefits. In packaging, plastic containers remain widely used, but metal tins and compostable paper formats are increasingly being adopted to meet sustainability goals.

Refillable and travel-size options are expanding among eco-conscious and mobile consumers. In terms of distribution, online marketplaces and mass retail channels lead market share, while subscription boxes and dermatology clinics are playing a growing role in premium and trial-oriented sales, signaling a shift toward experiential and personalized hygiene solutions.Regionally, the scope spans North America, Latin America, Western and Eastern Europe, Balkan and Baltic countries, Russia and Belarus, Central Asia, East Asia, South Asia and Pacific, and the Middle East and Africa.
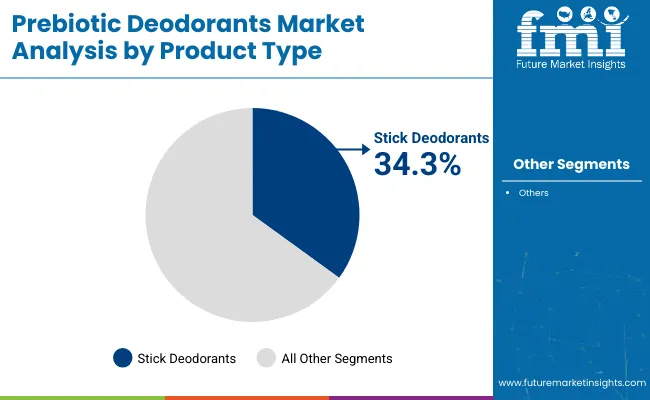
Insights into the Product Type Segment with Stick DeodorantsLeading in Market Share

Prebiotic Deodorants Market By Product Type

By Product Type Value Share% 2025
Stick Deodorants 34.3%
Others 65.7%

Stick deodorants are anticipated to dominate the product type segment in 2025, accounting for 34.3% of the global market share. This format has been favored for its portability, mess-free application, and longer wear-time, making it the preferred choice among daily users. The segment benefits from strong consumer familiarity and consistent innovation in natural, prebiotic-infused stick formats. While other deodorant formats collectively hold a larger combined share of 65.7%, their individual adoption remains fragmented across niche use cases such as wipes, balms, sprays, and gels.

Growing demand for hybrid skincare-deodorant formulations is likely to broaden the appeal of cream and balm deodorants, but stick variants are expected to retain their lead due to their functionality and product stability.
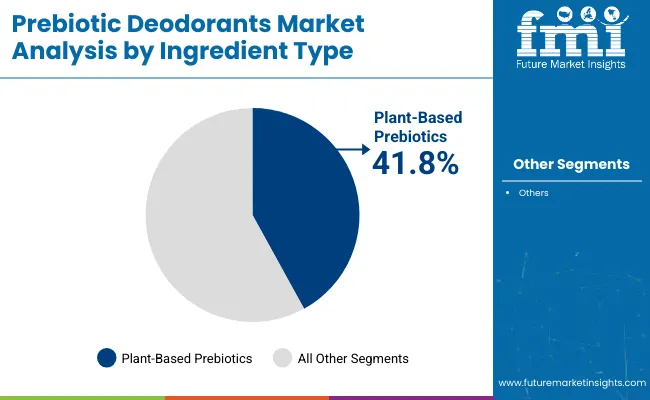
Insights into the Ingredient TypeSegment with Plant-Based PrebioticsDominating the Demand

Prebiotic Deodorants Market By Ingredient Type

By Ingredient Type Value Share% 2025
Plant-Based Prebiotics (e.g., inulin, yacon root extract) 41.8%
Others 58.2%

Plant-based prebiotics are projected to dominate the ingredient type segment in 2025, capturing a 41.8% share of the global market. Ingredients like inulin and yacon root extract have gained strong consumer acceptance owing to their natural origin, perceived skin microbiome benefits, and alignment with clean beauty trends. Their compatibility with various deodorant formats has supported widespread incorporation across both premium and mass-market formulations.

Although other ingredient types collectively hold a larger combined share of 58.2%, this includes several fragmented sources such as fermentation-derived, marine-origin, synthetic, and fungal-based prebiotics, each catering to narrower claims or specialized formulations. Demand for plant-based options is expected to remain strong due to ongoing consumer preference for recognizable, plant-derived ingredients in personal care.
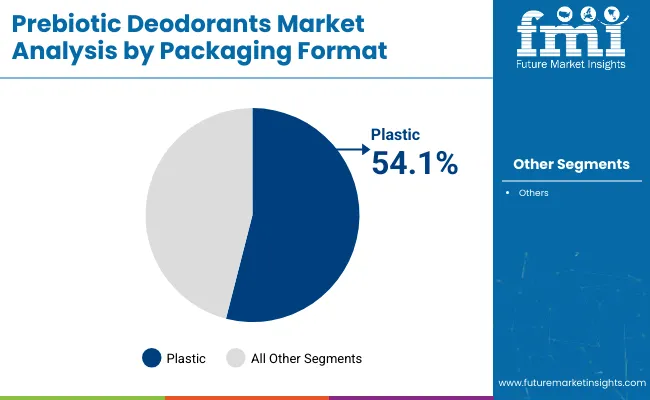
Insights into the Packaging Format Segment with Focus on Plastic

Prebiotic Deodorants Market By Packaging Format

By Packaging Format Value Share% 2025
Plastic (e.g., tubes, sticks, jars) 54.1%
Others 45.9%

Plastic-based packaging formats are expected to account for 54.1% of the global prebiotic deodorants market in 2025, emerging as the dominant format due to their widespread utility, low cost, and compatibility with stick, tube, and jar variants. Despite rising sustainability concerns, plastic remains preferred for its lightweight properties, product protection, and design flexibility across both travel-size and standard formats.

Brands continue to rely on recyclable or post-consumer recycled plastics to balance sustainability goals with functionality. While alternative formats such as paper, glass, and compostable packaging are gaining traction, especially among niche and eco-conscious consumers, they collectively account for a smaller share of 45.9% in 2025.

What are the Drivers, Restraints, and Key Trends of the Prebiotic Deodorants Market?

Shift Toward Skin Microbiome-Friendly Formulations in Deodorant Innovation

Growing awareness of the skin microbiome's role in body odor and skin health has shifted deodorant innovation toward microbiome-conscious solutions. Traditional antiperspirants often rely on aluminum salts or alcohols that disrupt the skin's natural flora, leading to irritation or odor rebound. In contrast, prebiotic deodorants support beneficial bacteria while suppressing malodor-causing microbes. This science-backed approach is gaining traction among dermatologists and cosmetic chemists, driving consumer trust and clinical marketing claims.

As research continues to clarify the balance between Cutibacterium, Corynebacterium, and Staphylococcus species on the underarm microbiome, formulations with inulin, alpha-glucan oligosaccharide, and yacon root extract are being favored. The shift is also spurred by rising consumer scrutiny over ingredient lists, encouraging brands to disclose functional roles of prebiotic compounds. This alignment between scientific validation and clean-label positioning is accelerating product launches, particularly in premium personal care and natural deodorant categories.

Rising Cross-Category Convergence Between Wellness, Beauty, and Deodorants

The convergence of wellness and skincare in underarm care routines is creating new avenues for prebiotic deodorants. Products are no longer positioned purely for odor control but are now framed as part of a holistic self-care regimen that includes microbiome balance, detox support, and skin barrier maintenance. Functional positioning overlaps with trends in probiotic skincare, gut-brain-skin axis awareness, and hormonal wellness, particularly among female consumers. This shift is especially prominent in wellness-centric e-commerce platforms and boutique retailers that market deodorants alongside adaptogens, botanical extracts, and mood-enhancing beauty tools.

Brands are also leveraging storytelling and education to position prebiotic deodorants as lifestyle products rather than hygiene staples. As a result, consumers are now evaluating deodorants based on wellness functionality, packaging sustainability, and skin compatibility, rather than fragrance alone. This has opened the door for price premiums, multi-use formats, and hybrid deodorant-serum innovations within the prebiotic space.

Limited Consumer Awareness of Prebiotic Functionality in Personal Care

While prebiotic deodorants offer targeted skin microbiome benefits, mainstream consumer understanding of how prebiotics function on the skin remains low. Unlike probiotics, which are more widely marketed in the beauty and supplements industry, prebiotics are often confused with natural ingredients or misunderstood as preservatives. This knowledge gap hinders brand communication efforts, as many consumers still prioritize scent, sweat protection, or organic claims over scientifically validated mechanisms. Even among informed consumers, the subtle nature of prebiotic efficacy may not provide immediate perceptible results, reducing repeat purchases.

Additionally, regulatory limitations on claims related to microbiome modulation further restrict product labeling and advertising. In retail environments, this often results in prebiotic deodorants being overshadowed by more familiar clean beauty or aluminum-free labels. Bridging this awareness barrier will require coordinated efforts in consumer education, ingredient transparency, and visual communication of skin health benefits to strengthen value perception across mass and premium segments.

Emergence of Probiotic and Synbiotic Deodorants with Skin-Balancing Claims

A growing trend in the prebiotic deodorants market is the rise of probiotic and synbiotic formulations that combine live microbial strains or postbiotics with prebiotics to enhance underarm microbiome health. These formulations are targeting consumers who are already familiar with probiotic skincare and gut health benefits, creating a new category of “active microbiome” deodorants. Brands are now experimenting with encapsulated lactobacillus or bifidobacterium strains that are freeze-dried or stabilized to survive in topical formats, paired with inulin or fructooligosaccharides to optimize microbial viability.

This trend reflects a scientific pivot from merely avoiding harmful ingredients to actively modulating the skin's bacterial ecosystem. The claims often focus on odor prevention through microbial balance rather than masking smells, appealing to consumers seeking non-toxic, biologically intelligent hygiene solutions. Although product stability and regulatory approval remain hurdles, the synbiotic deodorant category is gaining traction in DTC and specialty wellness channels, particularly among skincare-savvy consumers.
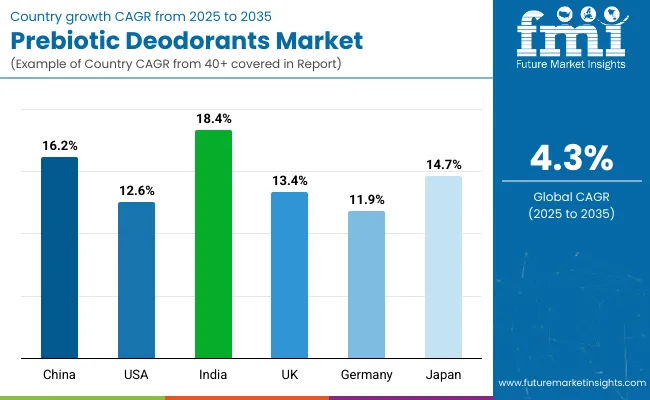
Analysis of Prebiotic Deodorants Market By Key Countries

Prebiotic Deodorants Market Country

Countries CAGR (2025 to 2035)
China 16.2%
USA 12.6%
India 18.4%
UK 13.4%
Germany 11.9%
Japan 14.7%

The prebiotic deodorants market is poised for robust international growth, with India leading all key countries at a projected CAGR of 18.4%. India's rapid adoption is driven by rising awareness of natural underarm care, increasing availability of clean-label personal care online, and growing consumer interest in plant-based formulations.

China follows closely with 16.2% CAGR, supported by the expansion of skin microbiome education, popularity of TCM-aligned prebiotic ingredients, and strong e-commerce integration. Japan is also gaining momentum at 14.7% CAGR, leveraging its established market for skin health and functional cosmetics to promote advanced microbiome-friendly deodorants.

In the West, the USA market continues to expand steadily at 12.6%, driven by sustained DTC activity, early-mover advantage of clean brands, and refillable product innovations. The UK and Germany, with CAGRs of 13.4% and 11.9% respectively, reflect mature yet evolving markets where sustainability, skin safety, and microbiome science are redefining deodorant preferences across both mass and premium retail channels.

Sales Outlook for Prebiotic Deodorants in the United States

Year USA Prebiotic Deodorants Market (USD Million)
2025 194.86
2026 227.23
2027 264.97
2028 308.99
2029 360.31
2030 420.16
2031 489.95
2032 571.33
2033 666.23
2034 776.89
2035 905.94

The Prebiotic Deodorants Market in the United States is projected to grow at a CAGR of 12.6% between 2025 and 2035, driven by surging consumer demand for microbiome-friendly, skin-safe personal care products. Growing awareness of underarm skin health, coupled with the rise of sensitive skin deodorant options, is accelerating mainstream acceptance. Clean beauty retailers and DTC brands are expanding their SKUs to include prebiotic formats, supported by storytelling around inulin and alpha-glucan oligosaccharide efficacy.

As consumers increasingly seek aluminum-free, synthetic-fragrance-free alternatives, prebiotic deodorants are emerging as a preferred option in natural personal care routines. Subscription-based models and influencer-backed launches have further popularized these formulations across Gen Z and millennial demographics. Retailers are expected to invest in tiered formats, including sticks, balms, and sprays, to cater to evolving consumer preferences for format diversity and refills.

  • Skin microbiome awareness is driving deodorant innovation in the natural care space
  • Retail and DTC brands are expanding clean label deodorant portfolios with prebiotic claims
  • Refillable and eco-packaged prebiotic sticks are gaining traction among conscious buyers

Growth and Expansion Outlook for Prebiotic Deodorants Market in the United Kingdom

The Prebiotic Deodorants Market in the United Kingdom is expected to grow at a CAGR of 13.4% between 2025 and 2035, supported by the country’s strong emphasis on sustainable beauty and skin-sensitive innovation. Consumer preference has notably shifted toward microbiome-friendly personal care, with prebiotic formulations being perceived as gentler alternatives to baking soda-based or alcohol-based deodorants. UK-based clean beauty retailers are expanding shelf space for aluminum-free, fragrance-free, and refillable stick deodorants, with plant-derived prebiotic actives such as inulin gaining popularity.

Regulatory pressure on synthetic preservatives and allergen-prone ingredients is indirectly supporting the transition to prebiotic-based options. Brand partnerships with dermatologists and eco-conscious influencers have further contributed to rapid awareness and trials. E-commerce platforms and subscription models are strengthening brand visibility and engagement, particularly among young urban consumers.

  • Demand for microbiome-supportive skincare is accelerating the UK’s shift toward prebiotic deodorants
  • Eco-conscious buyers are embracing refillable, plastic-free prebiotic deodorant packaging
  • Retailers are curating aluminum-free formats to meet rising demand from sensitive-skin users.

Growth and Expansion Outlook for Prebiotic Deodorants Market in India

India is witnessing rapid growth in the Prebiotic Deodorants Market, which is forecast to expand at a CAGR of 18.4% through 2035. The market is being shaped by a surge in health-conscious consumer behavior and growing interest in microbiome-friendly personal care solutions. Urban millennials and Gen Z consumers are actively seeking natural, chemical-free alternatives that address body odor without disrupting skin pH or microbiota.

Domestic beauty startups and D2C brands are launching deodorants with plant-based prebiotic ingredients like inulin and yacon root, promoting their benefits for sensitive skin and long-term skin health. Increased adoption of Western grooming routines and rising disposable incomes are also contributing to deodorant usage beyond metropolitan hubs. Retail partnerships with online platforms, dermatologists, and Ayurveda-inspired influencers are making microbiome-supportive deodorants more accessible and aspirational.

  • Urban millennials are driving growth in India’s plant-based deodorant segment
  • D2C brands are promoting inulin-rich prebiotic sticks as sensitive-skin solutions
  • Ayurveda-aligned marketing is resonating with health-conscious rural and semi-urban consumers

Sales Outlook for Prebiotic Deodorants in China

The Prebiotic Deodorants Market in China is expected to grow at a CAGR of 16.2%, the highest among leading economies. This growth is being accelerated by strong consumer awareness around microbiome skincare, especially among digitally native Gen Z and millennial segments. China's clean beauty movement is expanding swiftly, with domestic brands integrating prebiotic ingredients into personal hygiene products to appeal to urban, health-oriented shoppers.

Popular platforms like Tmall and Xiaohongshu are witnessing a surge in demand for deodorants made with natural and functional ingredients such as yacon extract and chicory root. Government push for sustainable cosmetics, coupled with eco-labeling norms and e-commerce-driven beauty innovation, is further amplifying category visibility. Local brands are leveraging AI-powered skin diagnostic tools to match consumers with prebiotic products suitable for sensitive skin, hyperpigmentation, and sweat control.

  • Clean beauty and functional hygiene trends are accelerating prebiotic deodorant adoption.
  • Digital platforms are driving demand for naturally derived, microbiome-friendly ingredients.
  • Local tech-driven brands are customizing deodorants for sweat control and skin balance.

In-depth Analysis of Prebiotic Deodorants in Germany

Countries 2025 Share (%)
USA 32.5%
China 9.3%
Japan 7.4%
Germany 6.2%
UK 5.9%
India 4.7%
Countries 2035 Share (%)
USA 27.8%
China 14.6%
Japan 8.1%
Germany 5.4%
UK 5.0%
India 9.3%

The Prebiotic Deodorants Market in Germany is expected to expand at a CAGR of 3.8% from 2025 to 2035, though its global share is projected to decline from 6.2% to 5.4% over the same period. This shift reflects stronger growth in emerging markets rather than a domestic slowdown. In Germany, rising demand for skin microbiome-friendly and aluminum-free deodorants is supporting niche product growth, particularly in health-driven urban markets.

Brands are responding with clean-label, dermatologically tested formulas featuring prebiotic actives like inulin and alpha-glucan oligosaccharide. Sustainability remains a defining theme, with solid-stick formats, recyclable packaging, and refill systems gaining popularity. Pharmacies and organic retailers continue to expand their assortment of vegan and clinically tested options.

  • Microbiome-safe, aluminum-free deodorants are entering mainstream shelves.
  • Solid formats and refillable packs align with eco-conscious consumer behavior.
  • Premium segment sees innovation from probiotic ingredient collaborations.

Growth Outlook for Prebiotic Deodorants Market in USA

USA By Product Type Value Share% 2025
Stick Deodorants 38.10%
Others 61.9%

The USA Prebiotic Deodorants Market is forecast to grow at a CAGR of 12.6% between 2025 and 2035, with its global share expected to decline slightly from 32.5% in 2025 to 27.8% by 2035 as emerging markets accelerate faster. Demand is being driven by the mainstreaming of natural personal care, heightened awareness of microbiome health, and consumer aversion to synthetic ingredients like aluminum and triclosan.

Stick deodorants hold the largest share at 38.1% in 2025, benefiting from familiarity and ease of use. However, newer formats such as sprays, creams, and roll-ons continue to gain traction, contributing to the 61.9% share under "Others". Growth is further supported by DTC startups offering prebiotic-infused formulations, dermatologist-tested labels, and sustainable packaging initiatives.

  • Natural and microbiome-safe claims are influencing deodorant purchasing decisions.
  • Stick deodorants remain dominant but face growing competition from alternative formats.
  • Direct-to-consumer channels are fostering rapid trial of new prebiotic formulations.

Opportunity Analysis of China Prebiotic Deodorants Market

China By Ingredient Type Value Share% 2025
Plant-Based Prebiotics 44.6%
Others 55.4%

In China, the prebiotic deodorants market presents significant expansion opportunities, projected to grow at a CAGR of 16.2% from 2025 to 2035. This growth is propelled by a shift toward functional personal care, rising urban middle-class income, and increasing interest in microbiome-friendly skincare. Among ingredient types, plant-based prebiotics command a 44.6% value share in 2025, supported by their association with natural wellness, traditional Chinese botanicals, and clean-label positioning.

Local consumers are showing greater receptivity to herbal and fermented actives, which aligns with the broader cultural preference for plant-derived solutions. The "Others" category, at 55.4%, includes emerging prebiotics from marine, synthetic, and probiotic-ferment sources, which are gaining attention among cosmeceutical innovators. E-commerce platforms are accelerating product visibility, while domestic players are investing in R&D to develop uniquely localized prebiotic formulations.
  • Demand is shifting toward functional, microbiome-supporting deodorant solutions.
  • Plant-based prebiotics resonate with China’s tradition of herbal personal care.
  • Digital platforms are enabling faster diffusion of new ingredient-based deodorants.

Competitive Landscape of Prebiotic Deodorants Market

Prebiotic Deodorants Market By Company

Company Global Value Share 2025
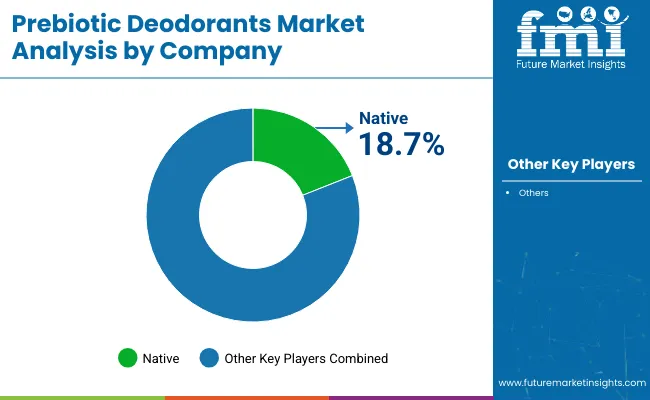
Native 18.7%
Others 81.3%

In 2025, Native holds an estimated 18.7% share of the global prebiotic deodorants market, reflecting its strong brand equity, microbiome-focused positioning, and clean-label appeal. The “Others” category commands 81.3%, indicating a fragmented competitive landscape dominated by emerging indie brands, private labels, and larger personal care companies expanding their natural deodorant portfolios.

rands such as Native, Schmidt’s Naturals, and Malin + Goetz hold a considerable share due to their early entry into natural deodorants, mass retail reach, and evolving microbiome-supportive lines. Their strategies are anchored in aluminum-free, baking soda-free formulations that cater to broad skin sensitivities and maintain a balance between natural efficacy and consumer trust.

Mid-sized disruptors such as Kosas, Drunk Elephant, and Salt & Stone are actively integrating skincare science with deodorant function. Their edge stems from cross-category expertise, use of bioactive prebiotic blends, and dermatologist-backed claims. Positioned as luxury clean beauty brands, they appeal to ingredient-conscious consumers seeking multi-functional, skin-enhancing deodorants within minimalist routines.

Emerging niche players including Wild, Corpus Naturals, AKT London, and Hume are reshaping category innovation through refillable formats, gender-neutral branding, and sustainability-driven design. Their regional strength is driven by targeted DTC models and strong consumer engagement on platforms like Instagram and TikTok. Product personalization, refill pods, and compostable packaging are being leveraged to build loyalty in eco-conscious urban markets.

Key Developments in Prebiotic Deodorants Market

  • Kosas Expands Chemistry Deodorant Line (March 2025): Kosas launched new scent variants of its Chemistry AHA Serum Deodorant, featuring skin-supportive prebiotics and mandelic acid. The launch targeted demand for multifunctional clean beauty products in prestige retail.
  • Native Launches Whole Body Deodorant (Jan 2024): Native introduced a 72-hour odor protection prebiotic deodorant line for full-body use. The product targets sensitive skin and expands Native’s microbiome-supportive personal care range.

Scope of the Report

Item Value
Quantitative Units USD 663.8 Million
Product Type Stick Deodorants, Roll-on Deodorants, Spray Deodorants, Cream & Balm Deodorants, Wipe & Sheet Deodorants, Gel Deodorants, Powder Deodorants, Other Formats (e.g., solid bars, serum-based, oils)
Ingredient Type Plant-Based Prebiotics (e.g., inulin, yacon root extract), Fermentation-Derived Prebiotics (e.g., alpha- glucan oligosaccharide), Marine-Origin Prebiotics, Synthetic Prebiotic Actives, Other Sources (e.g., yeast extract, mushroom-derived)
Packaging Format Plastic (e.g., tubes, sticks, jars), Glass Containers, Metal Tins, Compostable / Paper-Based Packaging, Refillable & Reusable Packaging, Travel-Size Mini Packaging
Distribution Channel Offline Retailers, Online Marketplaces (e.g., Amazon, Nykaa), Subscription & Sampling Boxes, Dermatology Clinics, Mass Retail & Supermarkets, Pharmacies & Drugstores, Airport Duty-Free & Travel Retail
Regions Covered North America, Europe, Asia-Pacific, Latin America, Middle East & Africa
Country Covered United States, Canada, Germany, France, United Kingdom, China, Japan, India, Brazil, South Africa
Key Companies Profiled Native, Corpus Naturals, Wild, Salt & Stone, Kosas, Drunk Elephant, AKT London, Hume, Malin + Goetz, Schmidt’s Naturals
Additional Attributes Dollar sales by product types and retail channel, ingredient type adoption trends in clean-label deodorants, rising demand for microbiome-friendly and pH-balanced formulations, segment-specific growth in women’s personal care and athleisure consumers, e-commerce and DTC revenue segmentation, integration with probiotic skincare and wellness routines, regional trends influenced by natural cosmetics regulation, and innovations in encapsulation, odor-neutralizing botanicals, and time-release delivery systems.

Key Segments

By Product Type:

  • Stick Deodorants
  • Roll-on Deodorants
  • Spray Deodorants
  • Cream & Balm Deodorants
  • Wipe & Sheet Deodorants
  • Gel Deodorants
  • Powder Deodorants
  • Other Formats

By Ingredient Type:

  • Plant-Based Prebiotics 
  • Fermentation-Derived Prebiotics 
  • Marine-Origin Prebiotics
  • Synthetic Prebiotic Actives
  • Other Sources 

By Packaging Format:

  • Plastic (e.g., tubes, sticks, jars)
  • Glass Containers
  • Metal Tins
  • Compostable / Paper-Based Packaging
  • Refillable & Reusable Packaging
  • Travel-Size Mini Packaging

By Distribution Channel:

  • Offline Retailers
  • Online Marketplaces 
  • Subscription & Sampling Boxes
  • Dermatology Clinics
  • Mass Retail & Supermarkets
  • Pharmacies & Drugstores
  • Airport Duty-Free & Travel Retail

By Region:

  • South Asia & Pacific
  • North America
  • Latin America
  • Europe
  • East Asia
  • Middle East and Africa

Table of Content

  1. Executive Summary
    • Global Market Outlook
    • Demand-side Trends
    • Supply-side Trends
    • Technology Roadmap Analysis
    • Analysis and Recommendations
  2. Market Overview
    • Market Coverage / Taxonomy
    • Market Definition / Scope / Limitations
  3. Market Background
    • Market Dynamics
      • Drivers
      • Restraints
      • Opportunity
      • Trends
    • Scenario Forecast
      • Demand in Optimistic Scenario
      • Demand in Likely Scenario
      • Demand in Conservative Scenario
    • Opportunity Map Analysis
    • Product Life Cycle Analysis
    • Supply Chain Analysis
      • Supply Side Participants and their Roles
        • Producers
        • Mid-Level Participants (Traders/ Agents/ Brokers)
        • Wholesalers and Distributors
      • Value Added and Value Created at Node in the Supply Chain
      • List of Raw Material Suppliers
      • List of Existing and Potential Buyer’s
    • Investment Feasibility Matrix
    • Value Chain Analysis
      • Profit Margin Analysis
      • Wholesalers and Distributors
      • Retailers
    • PESTLE and Porter’s Analysis
    • Regulatory Landscape
      • By Key Regions
      • By Key Countries
    • Regional Parent Market Outlook
    • Production and Consumption Statistics
    • Import and Export Statistics
  4. Global Market Analysis 2020-2024 and Forecast, 2025-2035
    • Historical Market Size Value (USD Million) & Volume (Units) Analysis, 2020-2024
    • Current and Future Market Size Value (USD Million) & Volume (Units) Projections, 2025-2035
      • Y-o-Y Growth Trend Analysis
      • Absolute $ Opportunity Analysis
  5. Global Market Analysis 2020-2024 and Forecast 2025-2035, By Product Type
    • Introduction / Key Findings
    • Historical Market Size Value (USD Million) & Volume (Units) Analysis By Product Type, 2020-2024
    • Current and Future Market Size Value (USD Million) & Volume (Units) Analysis and Forecast By Product Type, 2025-2035
      • Stick Deodorants
      • Roll-on Deodorants
      • Spray Deodorants
      • Cream & Balm Deodorants
      • Wipe & Sheet Deodorants
      • Gel Deodorants
      • Powder Deodorants
      • Other Formats
    • Y-o-Y Growth Trend Analysis By Product Type, 2020-2024
    • Absolute $ Opportunity Analysis By Product Type, 2025-2035
  6. Global Market Analysis 2020-2024 and Forecast 2025-2035, By Ingredient Type
    • Introduction / Key Findings
    • Historical Market Size Value (USD Million) & Volume (Units) Analysis By Ingredient Type, 2020-2024
    • Current and Future Market Size Value (USD Million) & Volume (Units) Analysis and Forecast By Ingredient Type, 2025-2035
      • Plant-Based Prebiotics 
      • Fermentation-Derived Prebiotics 
      • Marine-Origin Prebiotics
      • Synthetic Prebiotic Actives
      • Other Sources 
    • Y-o-Y Growth Trend Analysis By Ingredient Type, 2020-2024
    • Absolute $ Opportunity Analysis By Ingredient Type, 2025-2035
  7. Global Market Analysis 2020-2024 and Forecast 2025-2035, By Packaging Format
    • Introduction / Key Findings
    • Historical Market Size Value (USD Million) & Volume (Units) Analysis By Packaging Format, 2020-2024
    • Current and Future Market Size Value (USD Million) & Volume (Units) Analysis and Forecast By Packaging Format, 2025-2035
      • Plastic (e.g., tubes, sticks, jars)
      • Glass Containers
      • Metal Tins
      • Compostable / Paper-Based Packaging
      • Refillable & Reusable Packaging
      • Travel-Size Mini Packaging
    • Y-o-Y Growth Trend Analysis By Packaging Format, 2020-2024
    • Absolute $ Opportunity Analysis By Packaging Format, 2025-2035
  8. Global Market Analysis 2020-2024 and Forecast 2025-2035, By Distribution Channel
    • Introduction / Key Findings
    • Historical Market Size Value (USD Million) & Volume (Units) Analysis By Distribution Channel, 2020-2024
    • Current and Future Market Size Value (USD Million) & Volume (Units) Analysis and Forecast By Distribution Channel, 2025-2035
      • Offline Retailers
      • Online Marketplaces 
      • Subscription & Sampling Boxes
      • Dermatology Clinics
      • Mass Retail & Supermarkets
      • Pharmacies & Drugstores
      • Airport Duty-Free & Travel Retail
    • Y-o-Y Growth Trend Analysis By Distribution Channel, 2020-2024
    • Absolute $ Opportunity Analysis By Distribution Channel, 2025-2035
  9. Global Market Analysis 2020-2024 and Forecast 2025-2035, By Region
    • Introduction
    • Historical Market Size Value (USD Million) & Volume (Units) Analysis By Region, 2020-2024
    • Current Market Size Value (USD Million) & Volume (Units) Analysis and Forecast By Region, 2025-2035
      • South Asia & Pacific
      • North America
      • Latin America
      • Europe
      • East Asia
      • Middle East and Africa
    • Market Attractiveness Analysis By Region
  10. South Asia & Pacific Market Analysis 2020-2024 and Forecast 2025-2035, By Country
    • Historical Market Size Value (USD Million) & Volume (Units) Trend Analysis By Market Taxonomy, 2020-2024
    • Market Size Value (USD Million) & Volume (Units) Forecast By Market Taxonomy, 2025-2035
      • By Country
        • India
        • Thailand
        • Malaysia
        • Indonesia
        • Singapore
        • Vietnam
        • Australia
        • New Zealand
        • Rest of South Asia
      • By Product Type
      • By Ingredient Type
      • By Packaging Format
      • By Distribution Channel
    • Market Attractiveness Analysis
      • By Country
      • By Product Type
      • By Ingredient Type
      • By Packaging Format
      • By Distribution Channel
    • Key Takeaways
  11. North America Market Analysis 2020-2024 and Forecast 2025-2035, By Country
    • Historical Market Size Value (USD Million) & Volume (Units) Trend Analysis By Market Taxonomy, 2020-2024
    • Market Size Value (USD Million) & Volume (Units) Forecast By Market Taxonomy, 2025-2035
      • By Country
        • USA
        • Canada
      • By Product Type
      • By Ingredient Type
      • By Packaging Format
      • By Distribution Channel
    • Market Attractiveness Analysis
      • By Country
      • By Product Type
      • By Ingredient Type
      • By Packaging Format
      • By Distribution Channel
    • Key Takeaways
  12. Latin America Market Analysis 2020-2024 and Forecast 2025-2035, By Country
    • Historical Market Size Value (USD Million) & Volume (Units) Trend Analysis By Market Taxonomy, 2020-2024
    • Market Size Value (USD Million) & Volume (Units) Forecast By Market Taxonomy, 2025-2035
      • By Country
        • Brazil
        • Mexico
        • Colombia
        • Rest of Latin America
      • By Product Type
      • By Ingredient Type
      • By Packaging Format
      • By Distribution Channel
    • Market Attractiveness Analysis
      • By Country
      • By Product Type
      • By Ingredient Type
      • By Packaging Format
      • By Distribution Channel
    • Key Takeaways
  13. Europe Market Analysis 2020-2024 and Forecast 2025-2035, By Country
    • Historical Market Size Value (USD Million) & Volume (Units) Trend Analysis By Market Taxonomy, 2020-2024
    • Market Size Value (USD Million) & Volume (Units) Forecast By Market Taxonomy, 2025-2035
      • By Country
        • Germany
        • U.K.
        • France
        • Italy
        • Spain
        • Belgium
        • Netherlands
        • Nordic
        • Switzerland
        • Russia
        • Poland
        • Rest of Europe
      • By Product Type
      • By Ingredient Type
      • By Packaging Format
      • By Distribution Channel
    • Market Attractiveness Analysis
      • By Country
      • By Product Type
      • By Ingredient Type
      • By Packaging Format
      • By Distribution Channel
    • Key Takeaways
  14. East Asia Market Analysis 2020-2024 and Forecast 2025-2035, By Country
    • Historical Market Size Value (USD Million) & Volume (Units) Trend Analysis By Market Taxonomy, 2020-2024
    • Market Size Value (USD Million) & Volume (Units) Forecast By Market Taxonomy, 2025-2035
      • By Country
        • China
        • Japan
        • South Korea
      • By Product Type
      • By Ingredient Type
      • By Packaging Format
      • By Distribution Channel
    • Market Attractiveness Analysis
      • By Country
      • By Product Type
      • By Ingredient Type
      • By Packaging Format
      • By Distribution Channel
    • Key Takeaways
  15. Middle East and Africa Market Analysis 2020-2024 and Forecast 2025-2035, By Country
    • Historical Market Size Value (USD Million) & Volume (Units) Trend Analysis By Market Taxonomy, 2020-2024
    • Market Size Value (USD Million) & Volume (Units) Forecast By Market Taxonomy, 2025-2035
      • By Country
        • Turkey
        • UAE
        • Saudi Arabia
        • Israel
        • Other GCC Countries
        • North Africa
        • South Africa
      • By Product Type
      • By Ingredient Type
      • By Packaging Format
      • By Distribution Channel
    • Market Attractiveness Analysis
      • By Country
      • By Product Type
      • By Ingredient Type
      • By Packaging Format
      • By Distribution Channel
    • Key Takeaways
  16. Key Countries Market Analysis
    • USA
      • Pricing Analysis
      • Market Share Analysis, 2024
        • By Product Type
        • By Ingredient Type
        • By Packaging Format
        • By Distribution Channel
    • Canada
      • Pricing Analysis
      • Market Share Analysis, 2024
        • By Product Type
        • By Ingredient Type
        • By Packaging Format
        • By Distribution Channel
    • Brazil
      • Pricing Analysis
      • Market Share Analysis, 2024
        • By Product Type
        • By Ingredient Type
        • By Packaging Format
        • By Distribution Channel
    • Mexico
      • Pricing Analysis
      • Market Share Analysis, 2024
        • By Product Type
        • By Ingredient Type
        • By Packaging Format
        • By Distribution Channel
    • Colombia
      • Pricing Analysis
      • Market Share Analysis, 2024
        • By Product Type
        • By Ingredient Type
        • By Packaging Format
        • By Distribution Channel
    • Rest of Latin America
      • Pricing Analysis
      • Market Share Analysis, 2024
        • By Product Type
        • By Ingredient Type
        • By Packaging Format
        • By Distribution Channel
    • Germany
      • Pricing Analysis
      • Market Share Analysis, 2024
        • By Product Type
        • By Ingredient Type
        • By Packaging Format
        • By Distribution Channel
    • U.K.
      • Pricing Analysis
      • Market Share Analysis, 2024
        • By Product Type
        • By Ingredient Type
        • By Packaging Format
        • By Distribution Channel
    • France
      • Pricing Analysis
      • Market Share Analysis, 2024
        • By Product Type
        • By Ingredient Type
        • By Packaging Format
        • By Distribution Channel
    • Italy
      • Pricing Analysis
      • Market Share Analysis, 2024
        • By Product Type
        • By Ingredient Type
        • By Packaging Format
        • By Distribution Channel
    • Spain
      • Pricing Analysis
      • Market Share Analysis, 2024
        • By Product Type
        • By Ingredient Type
        • By Packaging Format
        • By Distribution Channel
    • Belgium
      • Pricing Analysis
      • Market Share Analysis, 2024
        • By Product Type
        • By Ingredient Type
        • By Packaging Format
        • By Distribution Channel
    • Netherlands
      • Pricing Analysis
      • Market Share Analysis, 2024
        • By Product Type
        • By Ingredient Type
        • By Packaging Format
        • By Distribution Channel
    • Nordic
      • Pricing Analysis
      • Market Share Analysis, 2024
        • By Product Type
        • By Ingredient Type
        • By Packaging Format
        • By Distribution Channel
    • Switzerland
      • Pricing Analysis
      • Market Share Analysis, 2024
        • By Product Type
        • By Ingredient Type
        • By Packaging Format
        • By Distribution Channel
    • Russia
      • Pricing Analysis
      • Market Share Analysis, 2024
        • By Product Type
        • By Ingredient Type
        • By Packaging Format
        • By Distribution Channel
    • Poland
      • Pricing Analysis
      • Market Share Analysis, 2024
        • By Product Type
        • By Ingredient Type
        • By Packaging Format
        • By Distribution Channel
    • Rest of Europe
      • Pricing Analysis
      • Market Share Analysis, 2024
        • By Product Type
        • By Ingredient Type
        • By Packaging Format
        • By Distribution Channel
    • China
      • Pricing Analysis
      • Market Share Analysis, 2024
        • By Product Type
        • By Ingredient Type
        • By Packaging Format
        • By Distribution Channel
    • Japan
      • Pricing Analysis
      • Market Share Analysis, 2024
        • By Product Type
        • By Ingredient Type
        • By Packaging Format
        • By Distribution Channel
    • South Korea
      • Pricing Analysis
      • Market Share Analysis, 2024
        • By Product Type
        • By Ingredient Type
        • By Packaging Format
        • By Distribution Channel
    • India
      • Pricing Analysis
      • Market Share Analysis, 2024
        • By Product Type
        • By Ingredient Type
        • By Packaging Format
        • By Distribution Channel
    • Thailand
      • Pricing Analysis
      • Market Share Analysis, 2024
        • By Product Type
        • By Ingredient Type
        • By Packaging Format
        • By Distribution Channel
    • Malaysia
      • Pricing Analysis
      • Market Share Analysis, 2024
        • By Product Type
        • By Ingredient Type
        • By Packaging Format
        • By Distribution Channel
    • Indonesia
      • Pricing Analysis
      • Market Share Analysis, 2024
        • By Product Type
        • By Ingredient Type
        • By Packaging Format
        • By Distribution Channel
    • Singapore
      • Pricing Analysis
      • Market Share Analysis, 2024
        • By Product Type
        • By Ingredient Type
        • By Packaging Format
        • By Distribution Channel
    • Vietnam
      • Pricing Analysis
      • Market Share Analysis, 2024
        • By Product Type
        • By Ingredient Type
        • By Packaging Format
        • By Distribution Channel
    • Australia
      • Pricing Analysis
      • Market Share Analysis, 2024
        • By Product Type
        • By Ingredient Type
        • By Packaging Format
        • By Distribution Channel
    • New Zealand
      • Pricing Analysis
      • Market Share Analysis, 2024
        • By Product Type
        • By Ingredient Type
        • By Packaging Format
        • By Distribution Channel
    • Rest of South Asia
      • Pricing Analysis
      • Market Share Analysis, 2024
        • By Product Type
        • By Ingredient Type
        • By Packaging Format
        • By Distribution Channel
  17. Market Structure Analysis
    • Competition Dashboard
    • Competition Benchmarking
    • Market Share Analysis of Top Players
      • By Regional
      • By Product Type
      • By Ingredient Type
      • By Packaging Format
      • By Distribution Channel
  18. Competition Analysis
    • Competition Deep Dive
      • Native
        • Overview
        • Product Portfolio
        • Profitability by Market Segments (Product/Age /Sales Channel/Region)
        • Sales Footprint
        • Strategy Overview
          • Marketing Strategy
          • Product Strategy
          • Channel Strategy
      • Corpus Naturals
        • Overview
        • Product Portfolio
        • Profitability by Market Segments (Product/Age /Sales Channel/Region)
        • Sales Footprint
        • Strategy Overview
          • Marketing Strategy
          • Product Strategy
          • Channel Strategy
      • Wild
        • Overview
        • Product Portfolio
        • Profitability by Market Segments (Product/Age /Sales Channel/Region)
        • Sales Footprint
        • Strategy Overview
          • Marketing Strategy
          • Product Strategy
          • Channel Strategy
      • Salt & Stone
        • Overview
        • Product Portfolio
        • Profitability by Market Segments (Product/Age /Sales Channel/Region)
        • Sales Footprint
        • Strategy Overview
          • Marketing Strategy
          • Product Strategy
          • Channel Strategy
      • Kosas
        • Overview
        • Product Portfolio
        • Profitability by Market Segments (Product/Age /Sales Channel/Region)
        • Sales Footprint
        • Strategy Overview
          • Marketing Strategy
          • Product Strategy
          • Channel Strategy
      • Drunk Elephant
        • Overview
        • Product Portfolio
        • Profitability by Market Segments (Product/Age /Sales Channel/Region)
        • Sales Footprint
        • Strategy Overview
          • Marketing Strategy
          • Product Strategy
          • Channel Strategy
      • AKT London
        • Overview
        • Product Portfolio
        • Profitability by Market Segments (Product/Age /Sales Channel/Region)
        • Sales Footprint
        • Strategy Overview
          • Marketing Strategy
          • Product Strategy
          • Channel Strategy
      • Hume
        • Overview
        • Product Portfolio
        • Profitability by Market Segments (Product/Age /Sales Channel/Region)
        • Sales Footprint
        • Strategy Overview
          • Marketing Strategy
          • Product Strategy
          • Channel Strategy
      • Malin + Goetz
        • Overview
        • Product Portfolio
        • Profitability by Market Segments (Product/Age /Sales Channel/Region)
        • Sales Footprint
        • Strategy Overview
          • Marketing Strategy
          • Product Strategy
          • Channel Strategy
      • Schmidt’s Naturals
        • Overview
        • Product Portfolio
        • Profitability by Market Segments (Product/Age /Sales Channel/Region)
        • Sales Footprint
        • Strategy Overview
          • Marketing Strategy
          • Product Strategy
          • Channel Strategy
  19. Assumptions & Acronyms Used
  20. Research Methodology

List of Tables

  • Table 1: Global Market Value (USD Million) Forecast by Region, 2020-2035
  • Table 2: Global Market Volume (Units) Forecast by Region, 2020-2035
  • Table 3: Global Market Value (USD Million) Forecast by Product Type, 2020-2035
  • Table 4: Global Market Volume (Units) Forecast by Product Type, 2020-2035
  • Table 5: Global Market Value (USD Million) Forecast by Ingredient Type, 2020-2035
  • Table 6: Global Market Volume (Units) Forecast by Ingredient Type, 2020-2035
  • Table 7: Global Market Value (USD Million) Forecast by Packaging Format, 2020-2035
  • Table 8: Global Market Volume (Units) Forecast by Packaging Format, 2020-2035
  • Table 9: Global Market Value (USD Million) Forecast by Distribution Channel, 2020-2035
  • Table 10: Global Market Volume (Units) Forecast by Distribution Channel, 2020-2035
  • Table 11: South Asia & Pacific Market Value (USD Million) Forecast by Country, 2020-2035
  • Table 12: South Asia & Pacific Market Volume (Units) Forecast by Country, 2020-2035
  • Table 13: South Asia & Pacific Market Value (USD Million) Forecast by Product Type, 2020-2035
  • Table 14: South Asia & Pacific Market Volume (Units) Forecast by Product Type, 2020-2035
  • Table 15: South Asia & Pacific Market Value (USD Million) Forecast by Ingredient Type, 2020-2035
  • Table 16: South Asia & Pacific Market Volume (Units) Forecast by Ingredient Type, 2020-2035
  • Table 17: South Asia & Pacific Market Value (USD Million) Forecast by Packaging Format, 2020-2035
  • Table 18: South Asia & Pacific Market Volume (Units) Forecast by Packaging Format, 2020-2035
  • Table 19: South Asia & Pacific Market Value (USD Million) Forecast by Distribution Channel, 2020-2035
  • Table 20: South Asia & Pacific Market Volume (Units) Forecast by Distribution Channel, 2020-2035
  • Table 21: North America Market Value (USD Million) Forecast by Country, 2020-2035
  • Table 22: North America Market Volume (Units) Forecast by Country, 2020-2035
  • Table 23: North America Market Value (USD Million) Forecast by Product Type, 2020-2035
  • Table 24: North America Market Volume (Units) Forecast by Product Type, 2020-2035
  • Table 25: North America Market Value (USD Million) Forecast by Ingredient Type, 2020-2035
  • Table 26: North America Market Volume (Units) Forecast by Ingredient Type, 2020-2035
  • Table 27: North America Market Value (USD Million) Forecast by Packaging Format, 2020-2035
  • Table 28: North America Market Volume (Units) Forecast by Packaging Format, 2020-2035
  • Table 29: North America Market Value (USD Million) Forecast by Distribution Channel, 2020-2035
  • Table 30: North America Market Volume (Units) Forecast by Distribution Channel, 2020-2035
  • Table 31: Latin America Market Value (USD Million) Forecast by Country, 2020-2035
  • Table 32: Latin America Market Volume (Units) Forecast by Country, 2020-2035
  • Table 33: Latin America Market Value (USD Million) Forecast by Product Type, 2020-2035
  • Table 34: Latin America Market Volume (Units) Forecast by Product Type, 2020-2035
  • Table 35: Latin America Market Value (USD Million) Forecast by Ingredient Type, 2020-2035
  • Table 36: Latin America Market Volume (Units) Forecast by Ingredient Type, 2020-2035
  • Table 37: Latin America Market Value (USD Million) Forecast by Packaging Format, 2020-2035
  • Table 38: Latin America Market Volume (Units) Forecast by Packaging Format, 2020-2035
  • Table 39: Latin America Market Value (USD Million) Forecast by Distribution Channel, 2020-2035
  • Table 40: Latin America Market Volume (Units) Forecast by Distribution Channel, 2020-2035
  • Table 41: Europe Market Value (USD Million) Forecast by Country, 2020-2035
  • Table 42: Europe Market Volume (Units) Forecast by Country, 2020-2035
  • Table 43: Europe Market Value (USD Million) Forecast by Product Type, 2020-2035
  • Table 44: Europe Market Volume (Units) Forecast by Product Type, 2020-2035
  • Table 45: Europe Market Value (USD Million) Forecast by Ingredient Type, 2020-2035
  • Table 46: Europe Market Volume (Units) Forecast by Ingredient Type, 2020-2035
  • Table 47: Europe Market Value (USD Million) Forecast by Packaging Format, 2020-2035
  • Table 48: Europe Market Volume (Units) Forecast by Packaging Format, 2020-2035
  • Table 49: Europe Market Value (USD Million) Forecast by Distribution Channel, 2020-2035
  • Table 50: Europe Market Volume (Units) Forecast by Distribution Channel, 2020-2035
  • Table 51: East Asia Market Value (USD Million) Forecast by Country, 2020-2035
  • Table 52: East Asia Market Volume (Units) Forecast by Country, 2020-2035
  • Table 53: East Asia Market Value (USD Million) Forecast by Product Type, 2020-2035
  • Table 54: East Asia Market Volume (Units) Forecast by Product Type, 2020-2035
  • Table 55: East Asia Market Value (USD Million) Forecast by Ingredient Type, 2020-2035
  • Table 56: East Asia Market Volume (Units) Forecast by Ingredient Type, 2020-2035
  • Table 57: East Asia Market Value (USD Million) Forecast by Packaging Format, 2020-2035
  • Table 58: East Asia Market Volume (Units) Forecast by Packaging Format, 2020-2035
  • Table 59: East Asia Market Value (USD Million) Forecast by Distribution Channel, 2020-2035
  • Table 60: East Asia Market Volume (Units) Forecast by Distribution Channel, 2020-2035
  • Table 61: Middle East and Africa Market Value (USD Million) Forecast by Country, 2020-2035
  • Table 62: Middle East and Africa Market Volume (Units) Forecast by Country, 2020-2035
  • Table 63: Middle East and Africa Market Value (USD Million) Forecast by Product Type, 2020-2035
  • Table 64: Middle East and Africa Market Volume (Units) Forecast by Product Type, 2020-2035
  • Table 65: Middle East and Africa Market Value (USD Million) Forecast by Ingredient Type, 2020-2035
  • Table 66: Middle East and Africa Market Volume (Units) Forecast by Ingredient Type, 2020-2035
  • Table 67: Middle East and Africa Market Value (USD Million) Forecast by Packaging Format, 2020-2035
  • Table 68: Middle East and Africa Market Volume (Units) Forecast by Packaging Format, 2020-2035
  • Table 69: Middle East and Africa Market Value (USD Million) Forecast by Distribution Channel, 2020-2035
  • Table 70: Middle East and Africa Market Volume (Units) Forecast by Distribution Channel, 2020-2035

List of Figures

  • Figure 1: Global Market Value (USD Million) by Product Type, 2025-2035
  • Figure 2: Global Market Value (USD Million) by Ingredient Type, 2025-2035
  • Figure 3: Global Market Value (USD Million) by Packaging Format, 2025-2035
  • Figure 4: Global Market Value (USD Million) by Distribution Channel, 2025-2035
  • Figure 5: Global Market Value (USD Million) by Region, 2025-2035
  • Figure 6: Global Market Value (USD Million) Analysis by Region, 2020-2035
  • Figure 7: Global Market Volume (Units) Analysis by Region, 2020-2035
  • Figure 8: Global Market Value Share (%) and BPS Analysis by Region, 2025-2035
  • Figure 9: Global Market Y-o-Y Growth (%) Projections by Region, 2025-2035
  • Figure 10: Global Market Value (USD Million) Analysis by Product Type, 2020-2035
  • Figure 11: Global Market Volume (Units) Analysis by Product Type, 2020-2035
  • Figure 12: Global Market Value Share (%) and BPS Analysis by Product Type, 2025-2035
  • Figure 13: Global Market Y-o-Y Growth (%) Projections by Product Type, 2025-2035
  • Figure 14: Global Market Value (USD Million) Analysis by Ingredient Type, 2020-2035
  • Figure 15: Global Market Volume (Units) Analysis by Ingredient Type, 2020-2035
  • Figure 16: Global Market Value Share (%) and BPS Analysis by Ingredient Type, 2025-2035
  • Figure 17: Global Market Y-o-Y Growth (%) Projections by Ingredient Type, 2025-2035
  • Figure 18: Global Market Value (USD Million) Analysis by Packaging Format, 2020-2035
  • Figure 19: Global Market Volume (Units) Analysis by Packaging Format, 2020-2035
  • Figure 20: Global Market Value Share (%) and BPS Analysis by Packaging Format, 2025-2035
  • Figure 21: Global Market Y-o-Y Growth (%) Projections by Packaging Format, 2025-2035
  • Figure 22: Global Market Value (USD Million) Analysis by Distribution Channel, 2020-2035
  • Figure 23: Global Market Volume (Units) Analysis by Distribution Channel, 2020-2035
  • Figure 24: Global Market Value Share (%) and BPS Analysis by Distribution Channel, 2025-2035
  • Figure 25: Global Market Y-o-Y Growth (%) Projections by Distribution Channel, 2025-2035
  • Figure 26: Global Market Attractiveness by Product Type, 2025-2035
  • Figure 27: Global Market Attractiveness by Ingredient Type, 2025-2035
  • Figure 28: Global Market Attractiveness by Packaging Format, 2025-2035
  • Figure 29: Global Market Attractiveness by Distribution Channel, 2025-2035
  • Figure 30: Global Market Attractiveness by Region, 2025-2035
  • Figure 31: South Asia & Pacific Market Value (USD Million) by Product Type, 2025-2035
  • Figure 32: South Asia & Pacific Market Value (USD Million) by Ingredient Type, 2025-2035
  • Figure 33: South Asia & Pacific Market Value (USD Million) by Packaging Format, 2025-2035
  • Figure 34: South Asia & Pacific Market Value (USD Million) by Distribution Channel, 2025-2035
  • Figure 35: South Asia & Pacific Market Value (USD Million) by Country, 2025-2035
  • Figure 36: South Asia & Pacific Market Value (USD Million) Analysis by Country, 2020-2035
  • Figure 37: South Asia & Pacific Market Volume (Units) Analysis by Country, 2020-2035
  • Figure 38: South Asia & Pacific Market Value Share (%) and BPS Analysis by Country, 2025-2035
  • Figure 39: South Asia & Pacific Market Y-o-Y Growth (%) Projections by Country, 2025-2035
  • Figure 40: South Asia & Pacific Market Value (USD Million) Analysis by Product Type, 2020-2035
  • Figure 41: South Asia & Pacific Market Volume (Units) Analysis by Product Type, 2020-2035
  • Figure 42: South Asia & Pacific Market Value Share (%) and BPS Analysis by Product Type, 2025-2035
  • Figure 43: South Asia & Pacific Market Y-o-Y Growth (%) Projections by Product Type, 2025-2035
  • Figure 44: South Asia & Pacific Market Value (USD Million) Analysis by Ingredient Type, 2020-2035
  • Figure 45: South Asia & Pacific Market Volume (Units) Analysis by Ingredient Type, 2020-2035
  • Figure 46: South Asia & Pacific Market Value Share (%) and BPS Analysis by Ingredient Type, 2025-2035
  • Figure 47: South Asia & Pacific Market Y-o-Y Growth (%) Projections by Ingredient Type, 2025-2035
  • Figure 48: South Asia & Pacific Market Value (USD Million) Analysis by Packaging Format, 2020-2035
  • Figure 49: South Asia & Pacific Market Volume (Units) Analysis by Packaging Format, 2020-2035
  • Figure 50: South Asia & Pacific Market Value Share (%) and BPS Analysis by Packaging Format, 2025-2035
  • Figure 51: South Asia & Pacific Market Y-o-Y Growth (%) Projections by Packaging Format, 2025-2035
  • Figure 52: South Asia & Pacific Market Value (USD Million) Analysis by Distribution Channel, 2020-2035
  • Figure 53: South Asia & Pacific Market Volume (Units) Analysis by Distribution Channel, 2020-2035
  • Figure 54: South Asia & Pacific Market Value Share (%) and BPS Analysis by Distribution Channel, 2025-2035
  • Figure 55: South Asia & Pacific Market Y-o-Y Growth (%) Projections by Distribution Channel, 2025-2035
  • Figure 56: South Asia & Pacific Market Attractiveness by Product Type, 2025-2035
  • Figure 57: South Asia & Pacific Market Attractiveness by Ingredient Type, 2025-2035
  • Figure 58: South Asia & Pacific Market Attractiveness by Packaging Format, 2025-2035
  • Figure 59: South Asia & Pacific Market Attractiveness by Distribution Channel, 2025-2035
  • Figure 60: South Asia & Pacific Market Attractiveness by Country, 2025-2035
  • Figure 61: North America Market Value (USD Million) by Product Type, 2025-2035
  • Figure 62: North America Market Value (USD Million) by Ingredient Type, 2025-2035
  • Figure 63: North America Market Value (USD Million) by Packaging Format, 2025-2035
  • Figure 64: North America Market Value (USD Million) by Distribution Channel, 2025-2035
  • Figure 65: North America Market Value (USD Million) by Country, 2025-2035
  • Figure 66: North America Market Value (USD Million) Analysis by Country, 2020-2035
  • Figure 67: North America Market Volume (Units) Analysis by Country, 2020-2035
  • Figure 68: North America Market Value Share (%) and BPS Analysis by Country, 2025-2035
  • Figure 69: North America Market Y-o-Y Growth (%) Projections by Country, 2025-2035
  • Figure 70: North America Market Value (USD Million) Analysis by Product Type, 2020-2035
  • Figure 71: North America Market Volume (Units) Analysis by Product Type, 2020-2035
  • Figure 72: North America Market Value Share (%) and BPS Analysis by Product Type, 2025-2035
  • Figure 73: North America Market Y-o-Y Growth (%) Projections by Product Type, 2025-2035
  • Figure 74: North America Market Value (USD Million) Analysis by Ingredient Type, 2020-2035
  • Figure 75: North America Market Volume (Units) Analysis by Ingredient Type, 2020-2035
  • Figure 76: North America Market Value Share (%) and BPS Analysis by Ingredient Type, 2025-2035
  • Figure 77: North America Market Y-o-Y Growth (%) Projections by Ingredient Type, 2025-2035
  • Figure 78: North America Market Value (USD Million) Analysis by Packaging Format, 2020-2035
  • Figure 79: North America Market Volume (Units) Analysis by Packaging Format, 2020-2035
  • Figure 80: North America Market Value Share (%) and BPS Analysis by Packaging Format, 2025-2035
  • Figure 81: North America Market Y-o-Y Growth (%) Projections by Packaging Format, 2025-2035
  • Figure 82: North America Market Value (USD Million) Analysis by Distribution Channel, 2020-2035
  • Figure 83: North America Market Volume (Units) Analysis by Distribution Channel, 2020-2035
  • Figure 84: North America Market Value Share (%) and BPS Analysis by Distribution Channel, 2025-2035
  • Figure 85: North America Market Y-o-Y Growth (%) Projections by Distribution Channel, 2025-2035
  • Figure 86: North America Market Attractiveness by Product Type, 2025-2035
  • Figure 87: North America Market Attractiveness by Ingredient Type, 2025-2035
  • Figure 88: North America Market Attractiveness by Packaging Format, 2025-2035
  • Figure 89: North America Market Attractiveness by Distribution Channel, 2025-2035
  • Figure 90: North America Market Attractiveness by Country, 2025-2035
  • Figure 91: Latin America Market Value (USD Million) by Product Type, 2025-2035
  • Figure 92: Latin America Market Value (USD Million) by Ingredient Type, 2025-2035
  • Figure 93: Latin America Market Value (USD Million) by Packaging Format, 2025-2035
  • Figure 94: Latin America Market Value (USD Million) by Distribution Channel, 2025-2035
  • Figure 95: Latin America Market Value (USD Million) by Country, 2025-2035
  • Figure 96: Latin America Market Value (USD Million) Analysis by Country, 2020-2035
  • Figure 97: Latin America Market Volume (Units) Analysis by Country, 2020-2035
  • Figure 98: Latin America Market Value Share (%) and BPS Analysis by Country, 2025-2035
  • Figure 99: Latin America Market Y-o-Y Growth (%) Projections by Country, 2025-2035
  • Figure 100: Latin America Market Value (USD Million) Analysis by Product Type, 2020-2035
  • Figure 101: Latin America Market Volume (Units) Analysis by Product Type, 2020-2035
  • Figure 102: Latin America Market Value Share (%) and BPS Analysis by Product Type, 2025-2035
  • Figure 103: Latin America Market Y-o-Y Growth (%) Projections by Product Type, 2025-2035
  • Figure 104: Latin America Market Value (USD Million) Analysis by Ingredient Type, 2020-2035
  • Figure 105: Latin America Market Volume (Units) Analysis by Ingredient Type, 2020-2035
  • Figure 106: Latin America Market Value Share (%) and BPS Analysis by Ingredient Type, 2025-2035
  • Figure 107: Latin America Market Y-o-Y Growth (%) Projections by Ingredient Type, 2025-2035
  • Figure 108: Latin America Market Value (USD Million) Analysis by Packaging Format, 2020-2035
  • Figure 109: Latin America Market Volume (Units) Analysis by Packaging Format, 2020-2035
  • Figure 110: Latin America Market Value Share (%) and BPS Analysis by Packaging Format, 2025-2035
  • Figure 111: Latin America Market Y-o-Y Growth (%) Projections by Packaging Format, 2025-2035
  • Figure 112: Latin America Market Value (USD Million) Analysis by Distribution Channel, 2020-2035
  • Figure 113: Latin America Market Volume (Units) Analysis by Distribution Channel, 2020-2035
  • Figure 114: Latin America Market Value Share (%) and BPS Analysis by Distribution Channel, 2025-2035
  • Figure 115: Latin America Market Y-o-Y Growth (%) Projections by Distribution Channel, 2025-2035
  • Figure 116: Latin America Market Attractiveness by Product Type, 2025-2035
  • Figure 117: Latin America Market Attractiveness by Ingredient Type, 2025-2035
  • Figure 118: Latin America Market Attractiveness by Packaging Format, 2025-2035
  • Figure 119: Latin America Market Attractiveness by Distribution Channel, 2025-2035
  • Figure 120: Latin America Market Attractiveness by Country, 2025-2035
  • Figure 121: Europe Market Value (USD Million) by Product Type, 2025-2035
  • Figure 122: Europe Market Value (USD Million) by Ingredient Type, 2025-2035
  • Figure 123: Europe Market Value (USD Million) by Packaging Format, 2025-2035
  • Figure 124: Europe Market Value (USD Million) by Distribution Channel, 2025-2035
  • Figure 125: Europe Market Value (USD Million) by Country, 2025-2035
  • Figure 126: Europe Market Value (USD Million) Analysis by Country, 2020-2035
  • Figure 127: Europe Market Volume (Units) Analysis by Country, 2020-2035
  • Figure 128: Europe Market Value Share (%) and BPS Analysis by Country, 2025-2035
  • Figure 129: Europe Market Y-o-Y Growth (%) Projections by Country, 2025-2035
  • Figure 130: Europe Market Value (USD Million) Analysis by Product Type, 2020-2035
  • Figure 131: Europe Market Volume (Units) Analysis by Product Type, 2020-2035
  • Figure 132: Europe Market Value Share (%) and BPS Analysis by Product Type, 2025-2035
  • Figure 133: Europe Market Y-o-Y Growth (%) Projections by Product Type, 2025-2035
  • Figure 134: Europe Market Value (USD Million) Analysis by Ingredient Type, 2020-2035
  • Figure 135: Europe Market Volume (Units) Analysis by Ingredient Type, 2020-2035
  • Figure 136: Europe Market Value Share (%) and BPS Analysis by Ingredient Type, 2025-2035
  • Figure 137: Europe Market Y-o-Y Growth (%) Projections by Ingredient Type, 2025-2035
  • Figure 138: Europe Market Value (USD Million) Analysis by Packaging Format, 2020-2035
  • Figure 139: Europe Market Volume (Units) Analysis by Packaging Format, 2020-2035
  • Figure 140: Europe Market Value Share (%) and BPS Analysis by Packaging Format, 2025-2035
  • Figure 141: Europe Market Y-o-Y Growth (%) Projections by Packaging Format, 2025-2035
  • Figure 142: Europe Market Value (USD Million) Analysis by Distribution Channel, 2020-2035
  • Figure 143: Europe Market Volume (Units) Analysis by Distribution Channel, 2020-2035
  • Figure 144: Europe Market Value Share (%) and BPS Analysis by Distribution Channel, 2025-2035
  • Figure 145: Europe Market Y-o-Y Growth (%) Projections by Distribution Channel, 2025-2035
  • Figure 146: Europe Market Attractiveness by Product Type, 2025-2035
  • Figure 147: Europe Market Attractiveness by Ingredient Type, 2025-2035
  • Figure 148: Europe Market Attractiveness by Packaging Format, 2025-2035
  • Figure 149: Europe Market Attractiveness by Distribution Channel, 2025-2035
  • Figure 150: Europe Market Attractiveness by Country, 2025-2035
  • Figure 151: East Asia Market Value (USD Million) by Product Type, 2025-2035
  • Figure 152: East Asia Market Value (USD Million) by Ingredient Type, 2025-2035
  • Figure 153: East Asia Market Value (USD Million) by Packaging Format, 2025-2035
  • Figure 154: East Asia Market Value (USD Million) by Distribution Channel, 2025-2035
  • Figure 155: East Asia Market Value (USD Million) by Country, 2025-2035
  • Figure 156: East Asia Market Value (USD Million) Analysis by Country, 2020-2035
  • Figure 157: East Asia Market Volume (Units) Analysis by Country, 2020-2035
  • Figure 158: East Asia Market Value Share (%) and BPS Analysis by Country, 2025-2035
  • Figure 159: East Asia Market Y-o-Y Growth (%) Projections by Country, 2025-2035
  • Figure 160: East Asia Market Value (USD Million) Analysis by Product Type, 2020-2035
  • Figure 161: East Asia Market Volume (Units) Analysis by Product Type, 2020-2035
  • Figure 162: East Asia Market Value Share (%) and BPS Analysis by Product Type, 2025-2035
  • Figure 163: East Asia Market Y-o-Y Growth (%) Projections by Product Type, 2025-2035
  • Figure 164: East Asia Market Value (USD Million) Analysis by Ingredient Type, 2020-2035
  • Figure 165: East Asia Market Volume (Units) Analysis by Ingredient Type, 2020-2035
  • Figure 166: East Asia Market Value Share (%) and BPS Analysis by Ingredient Type, 2025-2035
  • Figure 167: East Asia Market Y-o-Y Growth (%) Projections by Ingredient Type, 2025-2035
  • Figure 168: East Asia Market Value (USD Million) Analysis by Packaging Format, 2020-2035
  • Figure 169: East Asia Market Volume (Units) Analysis by Packaging Format, 2020-2035
  • Figure 170: East Asia Market Value Share (%) and BPS Analysis by Packaging Format, 2025-2035
  • Figure 171: East Asia Market Y-o-Y Growth (%) Projections by Packaging Format, 2025-2035
  • Figure 172: East Asia Market Value (USD Million) Analysis by Distribution Channel, 2020-2035
  • Figure 173: East Asia Market Volume (Units) Analysis by Distribution Channel, 2020-2035
  • Figure 174: East Asia Market Value Share (%) and BPS Analysis by Distribution Channel, 2025-2035
  • Figure 175: East Asia Market Y-o-Y Growth (%) Projections by Distribution Channel, 2025-2035
  • Figure 176: East Asia Market Attractiveness by Product Type, 2025-2035
  • Figure 177: East Asia Market Attractiveness by Ingredient Type, 2025-2035
  • Figure 178: East Asia Market Attractiveness by Packaging Format, 2025-2035
  • Figure 179: East Asia Market Attractiveness by Distribution Channel, 2025-2035
  • Figure 180: East Asia Market Attractiveness by Country, 2025-2035
  • Figure 181: Middle East and Africa Market Value (USD Million) by Product Type, 2025-2035
  • Figure 182: Middle East and Africa Market Value (USD Million) by Ingredient Type, 2025-2035
  • Figure 183: Middle East and Africa Market Value (USD Million) by Packaging Format, 2025-2035
  • Figure 184: Middle East and Africa Market Value (USD Million) by Distribution Channel, 2025-2035
  • Figure 185: Middle East and Africa Market Value (USD Million) by Country, 2025-2035
  • Figure 186: Middle East and Africa Market Value (USD Million) Analysis by Country, 2020-2035
  • Figure 187: Middle East and Africa Market Volume (Units) Analysis by Country, 2020-2035
  • Figure 188: Middle East and Africa Market Value Share (%) and BPS Analysis by Country, 2025-2035
  • Figure 189: Middle East and Africa Market Y-o-Y Growth (%) Projections by Country, 2025-2035
  • Figure 190: Middle East and Africa Market Value (USD Million) Analysis by Product Type, 2020-2035
  • Figure 191: Middle East and Africa Market Volume (Units) Analysis by Product Type, 2020-2035
  • Figure 192: Middle East and Africa Market Value Share (%) and BPS Analysis by Product Type, 2025-2035
  • Figure 193: Middle East and Africa Market Y-o-Y Growth (%) Projections by Product Type, 2025-2035
  • Figure 194: Middle East and Africa Market Value (USD Million) Analysis by Ingredient Type, 2020-2035
  • Figure 195: Middle East and Africa Market Volume (Units) Analysis by Ingredient Type, 2020-2035
  • Figure 196: Middle East and Africa Market Value Share (%) and BPS Analysis by Ingredient Type, 2025-2035
  • Figure 197: Middle East and Africa Market Y-o-Y Growth (%) Projections by Ingredient Type, 2025-2035
  • Figure 198: Middle East and Africa Market Value (USD Million) Analysis by Packaging Format, 2020-2035
  • Figure 199: Middle East and Africa Market Volume (Units) Analysis by Packaging Format, 2020-2035
  • Figure 200: Middle East and Africa Market Value Share (%) and BPS Analysis by Packaging Format, 2025-2035
  • Figure 201: Middle East and Africa Market Y-o-Y Growth (%) Projections by Packaging Format, 2025-2035
  • Figure 202: Middle East and Africa Market Value (USD Million) Analysis by Distribution Channel, 2020-2035
  • Figure 203: Middle East and Africa Market Volume (Units) Analysis by Distribution Channel, 2020-2035
  • Figure 204: Middle East and Africa Market Value Share (%) and BPS Analysis by Distribution Channel, 2025-2035
  • Figure 205: Middle East and Africa Market Y-o-Y Growth (%) Projections by Distribution Channel, 2025-2035
  • Figure 206: Middle East and Africa Market Attractiveness by Product Type, 2025-2035
  • Figure 207: Middle East and Africa Market Attractiveness by Ingredient Type, 2025-2035
  • Figure 208: Middle East and Africa Market Attractiveness by Packaging Format, 2025-2035
  • Figure 209: Middle East and Africa Market Attractiveness by Distribution Channel, 2025-2035
  • Figure 210: Middle East and Africa Market Attractiveness by Country, 2025-2035

Frequently Asked Questions

How big is the Prebiotic Deodorants Market in 2025?

The global Prebiotic Deodorants Market is estimated to be valued at USD 663.8 million in 2025.

What will be the size of Prebiotic Deodorants Market in 2035?

The market size for the Prebiotic Deodorants Market is projected to reach USD 1010.3 million by 2035.

How much will be the Prebiotic Deodorants Market growth between 2025 and 2035?

The Prebiotic Deodorants Market is expected to grow at a 4.3% CAGR between 2025 and 2035.

What are the key product types in the Prebiotic Deodorants Market?

The key product types in the Prebiotic Deodorants Market are sticks, roll-ons, sprays, creams, and wipes.

Which Product Type will contribute significant share in the Prebiotic Deodorants Market in 2025?

In terms of product type, the stick deodorants segment is expected to command a 34.3% share in the Prebiotic Deodorants Market in 2025.

Explore Similar Insights

Future Market Insights

Prebiotic Deodorants Market