Marine Prebiotics Market Size and Share Forecast Outlook 2025 to 2035

The global Marine Prebiotics Market has been projected to be valued at USD 240.6 million in 2025 and is anticipated to reach approximately USD 544.0 million by 2035. A cumulative gain of USD 264.9 million is expected over the forecast decade, signaling a 8.5% CAGR positioning marine-derived prebiotics as one of the most dynamic categories within functional health and nutrition.
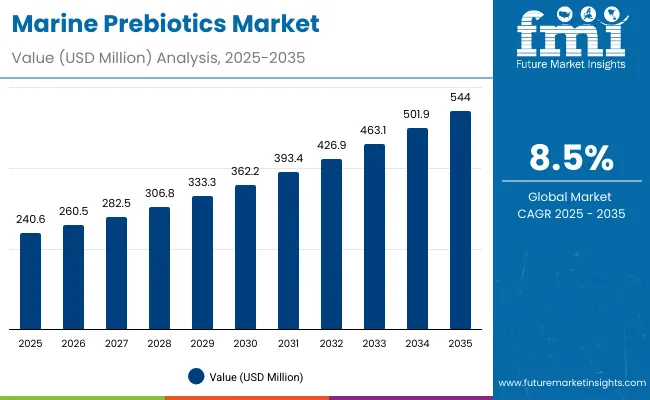
Marine Prebiotics Market 1

Quick Stats for Marine Prebiotics Market

  • Marine Prebiotics Market Value (2025): USD 240.6 million
  • Marine Prebiotics Market Forecast Value (2035): USD 544.0 million
  • Marine Prebiotics Forecast CAGR: 9.5%
  • Leading Segment in Marine Prebiotics in 2025, by Product Type: Marine Polysaccharides (38.7%)
  • Key Growth Regions in the Marine Prebiotics: North America, Asia-Pacific, Europe
  • Top Key Players in Marine Prebiotics: AIDP, Inc.; Marine Bio Co., Ltd.; Beneo GmbH; Dupont Nutrition & Biosciences (IFF); FMC Corporation; CP Kelco USA, Inc.; Acadian Seaplants Limited; Algaia S.A.S.; Ocean Harvest Technology Group; Cargill, Incorporated.

Marine Prebiotics Market Key Takeaways
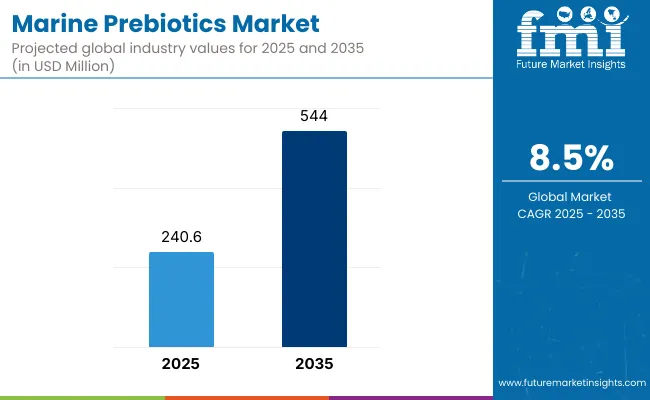
Marine Prebiotics Market

Metric Value
Marine Prebiotics Estimated Value in (2025E) USD 240.6 million
Marine Prebiotics Forecast Value in (2035F) USD 544.0 million
Forecast CAGR (2025 to 2035) 8.5%

Future adoption is likely to be reinforced by innovation in extraction technologies, clinical research, and targeted formulation strategies, allowing suppliers to enhance bioavailability and substantiate health claims. With the convergence of nutraceuticals, functional foods, and medical nutrition, marine prebiotics are expected to be absorbed into diversified end-use sectors, including infant and clinical nutrition, animal feed, pharmaceuticals, and cosmetics.

During the initial phase from 2025 to 2030, the market is anticipated to rise from USD 240.6 million to approximately USD 362.2 million, accounting for nearly 40% of the total decade expansion. This stage of growth is expected to be shaped by rising adoption across dietary supplements and functional foods, with early traction emerging in infant nutrition and medical formulations. The narrative during this phase will be centered on proof-of-concept validation, clinical research support, and heightened consumer awareness regarding the unique benefits of marine bioactives.

The subsequent phase from 2030 to 2035 is forecasted to accelerate further, with the market advancing from USD 362.2 million to USD 544.0 million. This period is expected to contribute about 60% of the decade’s growth, supported by regulatory clarity, expanding application in pharmaceuticals and cosmetics, and a broader push for sustainability in sourcing. By the end of the forecast horizon, marine prebiotics are anticipated to transition from niche adoption to mainstream incorporation, underscoring their role in the evolving microbiome economy.

From 2020 to 2024, the Marine Prebiotics Market was propelled by early adoption of seaweed- and algae-based bioactives in nutraceuticals and functional foods, with marine polysaccharides gaining significant traction. During this period, global ingredient leaders and marine biotechnology firms consolidated their presence by scaling extraction and fermentation technologies, enabling cost efficiency and broader application integration. Competitive differentiation relied on sustainability, traceability, and clinical validation, with supplements serving as the entry point for consumer adoption.

By 2025, the market is projected to reach USD 240.6 million, and by 2035, revenues are expected to cross USD 544.0 million. The revenue mix will shift as pharmaceuticals, cosmetics, and aquaculture applications expand their share. Established leaders are expected to pivot toward hybrid business models, combining B2B ingredient supply with partnerships in functional food and cosmeceutical innovation. Competitive advantage is anticipated to move from raw material supply alone to ecosystem strength, regulatory alignment, and consumer trust.

Why the Marine Prebiotics Market is growing?

Growth of the Marine Prebiotics Market is being shaped by clear differentiation across product type, application, and end-user segments. Among product types, marine polysaccharides are expected to retain the leading share at 38.7% in 2025, supported by their established clinical validation and versatile functionality. However, higher growth momentum is projected within marine fibers and other marine-derived prebiotics, expanding at 7.2% and 7.5% CAGR, respectively, as innovation in extraction and functional integration accelerates. Marine oligosaccharides are also expected to record sustained demand, particularly in functional nutrition applications.

On the application front, dietary supplements are projected to remain dominant with 29.4% share in 2025, driven by consumer reliance on microbiome-supporting products. Yet, faster expansion is anticipated in pharmaceuticals and therapeutics (8.2% CAGR) and cosmetics and personal care (8.6% CAGR), reflecting rising adoption in specialized health and cosmeceutical markets. Functional foods and beverages will also grow steadily, enabling marine prebiotics to transition from niche adoption toward everyday consumption formats.

In terms of end users, human nutrition and health are expected to account for 45% of the market in 2025, reinforcing the consumer-driven demand base. Growth, however, will also be reinforced by industrial users at 7.6% CAGR, supported by pharmaceutical and cosmeceutical adoption, and by animal feed applications at 6.9% CAGR, where aquaculture innovations are enhancing sustainability.

By 2035, the market is forecasted to display both scale and diversity, with broader adoption beyond supplements into medical, industrial, and personal care ecosystems, positioning marine prebiotics as an integrated pillar of global health solutions.

Segmental Analysis

The Marine Prebiotics Market has been segmented across product type, application, end-user, source, distribution channel, and region, reflecting the multifaceted drivers of adoption. Product type segmentation highlights polysaccharides, oligosaccharides, fibers, and other marine-derived compounds, each contributing uniquely to functional efficacy. Applications span dietary supplements, functional foods, pharmaceuticals, cosmetics, and animal nutrition, illustrating the broad commercial relevance of marine-based prebiotics. End-user segmentation includes human nutrition and health, animal and aquaculture feed, and industrial users, aligning demand with distinct consumption pathways. Source-based segmentation emphasizes seaweed, microalgae, marine crustaceans, and marine bacteria, showcasing the depth of resource utilization. Distribution channels are split into direct supply, retail, online platforms, and specialty stores, reflecting evolving consumer access points. Regionally, the scope covers North America, Latin America, Europe, East Asia, South Asia & Pacific, and the Middle East & Africa, where market potential is expected to differ based on dietary preferences, regulatory frameworks, and marine biotechnology investments.
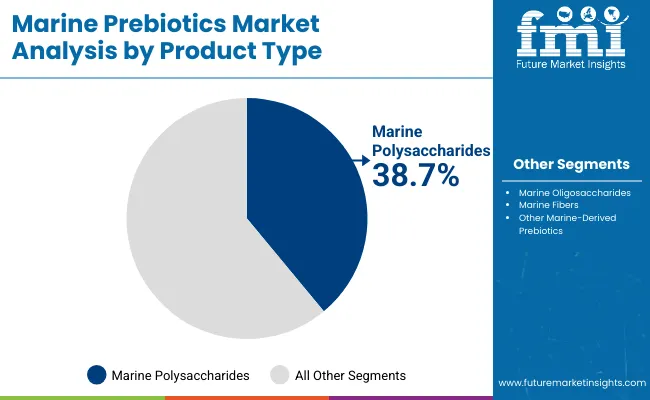
Insights into the Product Type Segment with Marine Polysaccharides Leading in Market Share

Marine Prebiotics Market By Product Type

Product Type Segment Market Value Share, 2025
Marine Polysaccharides (fucoidan, laminarin, alginate) 38.7%
Marine Oligosaccharides (galacto-oligosaccharides, xylo-oligosaccharides) 34.1%

Marine polysaccharides are expected to dominate with 38.7% share in 2025, reflecting their strong clinical validation and wide functional range. Their application in gut health, immunity, and anti-inflammatory benefits has been widely supported by research, positioning them as trusted bioactive compounds. Growth is anticipated to be supported by regulatory acceptance and increased availability of scalable extraction methods from seaweed. Meanwhile, innovation in marine oligosaccharides and fibers is being accelerated, enhancing their positioning in premium formulations. Polysaccharides are projected to retain leadership as advancements in biotechnology improve cost efficiency and bioactivity, ensuring their sustained prominence.
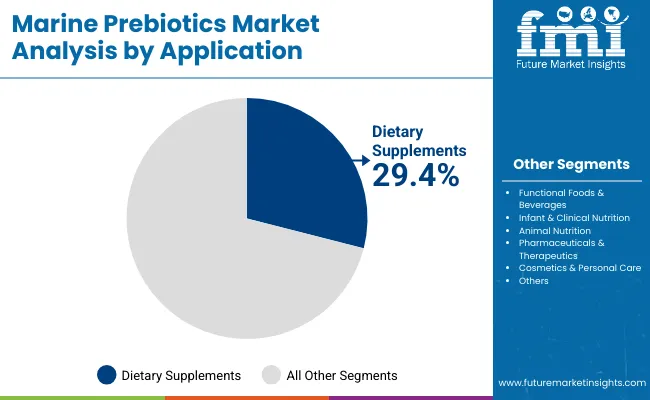
Insights into the Application Segment with Dietary Supplements Dominating the Demand

Marine Prebiotics Market By Application

Application 2025 Share%
Dietary Supplements 29.4%
Functional Foods & Beverages 21.7%
Infant & Clinical Nutrition 14.3%

Dietary supplements are forecasted to hold the leading share of 29.4% in 2025, with consumer demand for microbiome-supporting products serving as a primary growth catalyst. Marine prebiotics are being increasingly formulated into capsules, powders, and blends, enhancing accessibility for health-conscious consumers. This segment is being reinforced by clinical research linking marine-derived bioactives with gut health, immunity, and metabolic wellness. Growth is further supported by consumer willingness to pay for natural and sustainable alternatives to synthetic ingredients. Over the decade, pharmaceutical and cosmetic applications are projected to accelerate faster, but dietary supplements will remain the core entry point for widespread adoption.
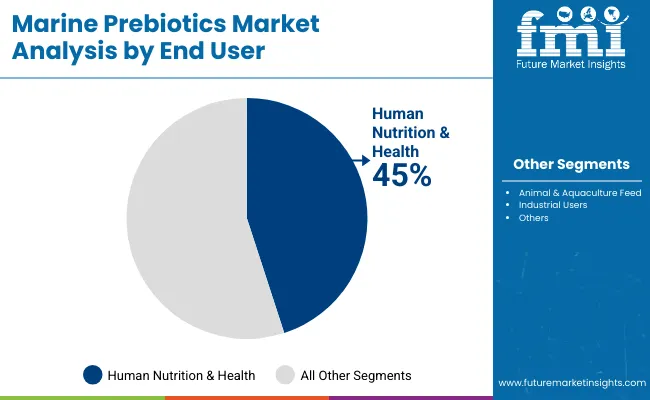
Insights into the End-User Segment with Focus on Human Nutrition & Health

Marine Prebiotics Market By End User

End-User 2025 Share%
Human Nutrition & Health 45%
Animal & Aquaculture Feed 35%
Industrial Users (cosmeceutical & pharmaceutical companies) 20%

Human nutrition and health are expected to command 45% of the market in 2025, supported by strong integration into nutraceuticals, functional foods, and medical nutrition. Consumer demand for natural gut health enhancers and immune-supporting ingredients is being amplified by rising awareness of microbiome wellness. Expansion in this segment is being driven by lifestyle-driven health concerns and preventive healthcare trends. Animal and aquaculture feed is projected to remain critical, particularly in sustainable aquaculture systems where marine prebiotics enhance growth performance and immunity in aquatic species. Industrial users, though smaller in share, are forecasted to expand faster due to rising adoption in cosmeceuticals and pharmaceutical formulations, reinforcing the market’s diversification potential.

What are the Drivers, Restraints, and Key Trends of the Marine Prebiotics Market?

Rising health awareness and demand for natural gut-supporting ingredients are being recognized as primary growth drivers for the Marine Prebiotics Market. However, challenges linked to high extraction costs and limited regulatory clarity are being observed as restraints. Simultaneously, expanding applications in pharmaceuticals, cosmetics, and aquaculture are being positioned as transformative trends shaping future opportunities.

Rising Demand for Gut Health and Immunity Solutions

Global consumer focus on gut health and immunity is being reinforced by scientific evidence, positioning marine prebiotics as valuable bioactive ingredients. The market is being driven by their ability to support microbiome balance, enhance metabolic health, and deliver anti-inflammatory benefits. Nutraceutical brands are expected to integrate these prebiotics into mainstream supplements and functional foods, ensuring wider adoption across human health applications. This driver is expected to remain fundamental to long-term market expansion.

Expansion into Pharmaceuticals and Cosmeceuticals

A notable trend is being observed in the adoption of marine prebiotics within pharmaceuticals and personal care products. Their potential for anti-inflammatory, antimicrobial, and skin barrier-enhancing effects is being validated through clinical and biotechnological studies. This expansion is expected to diversify revenue streams and position marine prebiotics as more than nutritional additives. Future growth will be strengthened by partnerships between biotech firms and cosmetic innovators, establishing marine prebiotics as premium multifunctional ingredients.
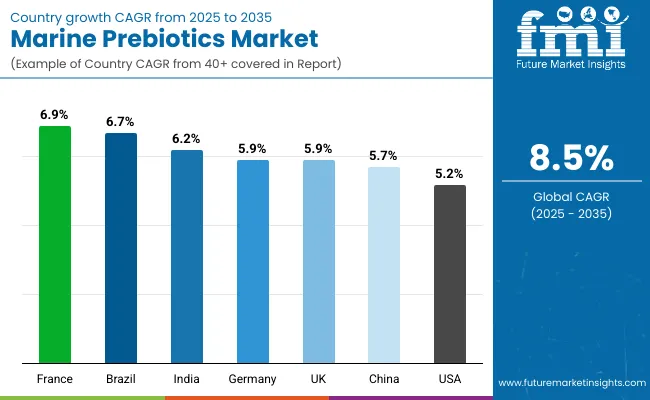
Analysis of Marine Prebiotics Market by Key Countries

Country Wise Marine Prebiotics Market

Countries CAGR (2025 to 2035)
China 5.7%
India 6.2%
Germany 5.9%
France 6.9%
UK 5.9%
USA 5.2%
Brazil 6.7%

The global Marine Prebiotics Market is expected to expand unevenly across countries, reflecting differences in dietary patterns, regulatory ecosystems, and levels of investment in marine biotechnology. Growth momentum is projected to be strongest in Asia-Pacific, with India (6.2% CAGR) and China (5.7% CAGR) emerging as critical demand centers. Expansion in these markets is being reinforced by government-backed initiatives in functional food innovation and aquaculture sustainability, enabling marine prebiotics to be integrated into mainstream nutrition and feed systems. India’s trajectory is expected to be supported by rapid urban health awareness and rising nutraceutical consumption, while China is projected to leverage its large-scale seaweed industry to strengthen domestic production capacity.

In Europe, steady adoption is anticipated, led by France (6.9% CAGR), Germany (5.9% CAGR), and the UK (5.9% CAGR). Strong regulatory frameworks on food safety and consumer inclination toward natural functional ingredients are driving incorporation into supplements and cosmeceuticals. France is expected to stand out due to its innovation-driven marine bioeconomy, while Germany and the UK are projected to remain central to clinical validation and premium product launches.

In the Americas, Brazil (6.7% CAGR) is forecasted to outpace the USA (5.2% CAGR), as adoption in Latin America is being stimulated by aquaculture growth and functional food demand, while the USA market reflects maturity and slower expansion in traditional supplement categories.
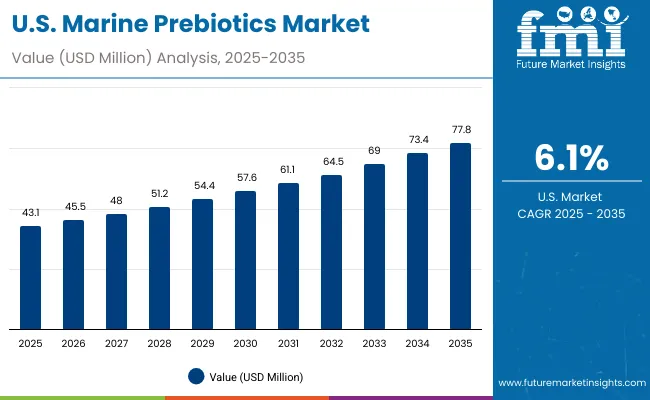
Sales Outlook for Marine Prebiotics in the United States

Usa Marine Prebiotics Market

Year USA Marine Prebiotics Market (USD Million)
2025 43.1
2026 45.5
2027 48.0
2028 51.2
2029 54.4
2030 57.6
2031 61.1
2032 64.5
2033 69.0
2034 73.4
2035 77.8

The Marine Prebiotics Market in the United States is projected to grow from USD 43.1 million in 2025 to USD 77.8 million by 2035, advancing at a CAGR of approximately 5.2%. Expansion is being supported by consumer demand for microbiome-targeted nutrition, growing integration of marine-derived ingredients in dietary supplements, and rising acceptance of natural solutions in functional foods and beverages.

  • Healthcare-oriented applications are expected to drive strong adoption, with infant and clinical nutrition demonstrating accelerated demand as clinical validation of marine prebiotics expands. Pharmaceutical and cosmeceutical applications are also anticipated to diversify growth pathways, supported by innovation in bioactive formulations. Increased emphasis on sustainability in sourcing is reinforcing the appeal of marine prebiotics over synthetic alternatives.
  • Digital retail channels and specialty health stores are projected to further enable market penetration, particularly as USA consumers increasingly adopt direct-to-consumer supplement models. Partnerships between marine biotechnology firms and USA-based nutraceutical brands are expected to shape competitive positioning and accelerate innovation pipelines.
  • Dietary supplements remain the leading USA application segment, reflecting strong consumer focus on gut and immune health.
  • Pharmaceutical and cosmetic formulations are anticipated to emerge as high-value growth frontiers during the forecast period.

Growth and Expansion Outlook for Marine Prebiotics Market in the United Kingdom

The Marine Prebiotics Market in the UK is expected to expand steadily, advancing at a CAGR of 5.9% between 2025 and 2035. Demand is being reinforced by consumer preference for sustainable and clinically validated functional ingredients. Strong alignment with regulatory frameworks on food safety and nutrition labeling is anticipated to strengthen trust and adoption. Growth is expected to be centered on premium dietary supplements and cosmeceutical applications, with marine-derived fibers and polysaccharides gaining prominence.

  • Dietary supplements remain the primary driver, supported by preventive health awareness.
  • Cosmeceuticals are projected to accelerate, reflecting demand for natural skin wellness solutions.
  • Regulatory clarity is anticipated to build stronger market credibility.
  • Collaborations between UK nutraceutical brands and marine biotech firms are likely to enhance product innovation.

Growth and Expansion Outlook for Marine Prebiotics in India

The Marine Prebiotics Market in India is projected to grow at a CAGR of 6.2%, the highest among key markets, driven by rapid urbanization, rising health awareness, and expansion of nutraceutical consumption. Increasing penetration of dietary supplements and functional beverages is being supported by younger demographics and shifting preventive healthcare preferences. Domestic marine resources and biotechnology investments are expected to enhance scalability and reduce dependence on imports.

  • Dietary supplements and beverages are expected to anchor consumption growth.
  • Expanding aquaculture is likely to reinforce marine prebiotic demand in feed applications.
  • Rising disposable incomes are projected to boost premium nutrition adoption.
  • Collaborations between Indian nutraceuticals and global marine ingredient suppliers are anticipated to stimulate innovation pipelines.

Sales Outlook for Marine Prebiotics in China

The Marine Prebiotics Market in China is forecasted to expand at a CAGR of 5.7%, supported by its strong seaweed industry and biotechnology advancements. Demand is being shaped by rising consumer preference for natural, science-backed gut health solutions and government focus on marine resource utilization. Functional food integration is expected to gain significant momentum, particularly in fortified beverages and infant nutrition products. Pharmaceutical and cosmeceutical applications are also anticipated to create high-value opportunities.
  • Seaweed-based polysaccharides are projected to dominate due to domestic raw material strength.
  • Infant and clinical nutrition will expand as clinical validation progresses.
  • Government support for marine biotechnology is expected to boost innovation capacity.
  • Partnerships between domestic producers and global supplement brands are anticipated to expand export potential.

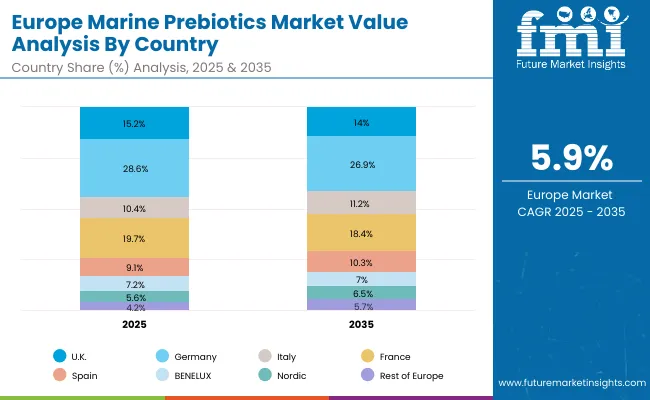
In-depth Analysis of Marine Prebiotics in Germany

Europe Marine Prebiotics Market

Countries 2025
UK 15.2%
Germany 28.6%
Italy 10.4%
France 19.7%
Spain 9.1%
BENELUX 7.2%
Nordic 5.6%
Rest of Europe 4.2%
Countries 2035
UK 14.0%
Germany 26.9%
Italy 11.2%
France 18.4%
Spain 10.3%
BENELUX 7.0%
Nordic 6.5%
Rest of Europe 5.7%

The Marine Prebiotics Market in Germany is projected to record a CAGR of 5.9%, with growth underpinned by stringent regulatory standards, consumer demand for natural health solutions, and strong innovation pipelines. Functional foods and dietary supplements are expected to remain central to adoption, while pharmaceuticals and cosmeceuticals are anticipated to accelerate steadily. Market penetration is being reinforced by clinical validation, which remains a key purchasing factor among German consumers.
  • Functional foods and supplements will remain the largest demand drivers.
  • Pharmaceutical and cosmeceutical applications are projected to see rising acceptance.
  • Strict quality standards are expected to shape competitive differentiation.
  • Collaborations with European biotech firms are anticipated to foster new formulations.
  • Germany’s role as a European innovation hub is projected to foster rapid new product development and consumer trial.

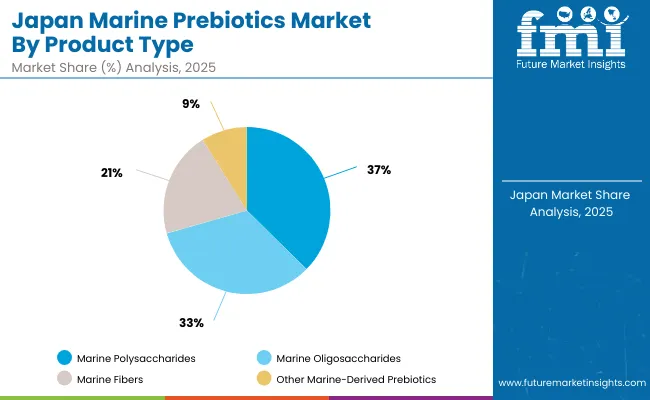
Growth Outlook for Marine Prebiotics in Japan

Japan Marine Prebiotics Market

Product Type Market Value Share, 2025
Marine Polysaccharides (fucoidan, laminarin, alginate) 37.4%
Marine Oligosaccharides (galacto-oligosaccharides, xylo-oligosaccharides) 33.2%
Marine Fibers (chitosan, chitin, seaweed fiber) 20.5%
Other Marine-Derived Prebiotics 8.9%

The Marine Prebiotics Market in Japan is projected to display steady expansion, underpinned by strong consumer orientation toward scientifically validated and naturally derived health ingredients. In 2025, marine polysaccharides are expected to contribute the highest share at 37.4%, while marine oligosaccharides follow with 33.2%, highlighting their significant role in gut health and immunity support. Marine fibers and other marine-derived prebiotics, although smaller in share, are forecasted to record higher CAGRs (7.1% and 7.4%, respectively), reflecting innovation-driven adoption and growing functional versatility.

This distribution reflects Japan’s focus on preventive healthcare, aging population needs, and demand for evidence-based nutritional solutions. Marine polysaccharides are likely to maintain dominance due to established clinical relevance, while fibers are projected to gain traction in cosmeceuticals and functional food applications. Rising integration into premium supplements and fortified foods will define the competitive outlook. Partnerships between Japanese nutraceutical firms and global marine biotechnology companies are expected to accelerate product innovation and ensure differentiation.
  • Japan is expected to retain a strong regional role in Asia’s marine prebiotics development.
  • Marine polysaccharides lead in share but fibers and other prebiotics show stronger growth momentum.
  • Aging population and preventive healthcare priorities are driving adoption.
  • Cross-industry collaborations are anticipated to strengthen innovation in premium formulations

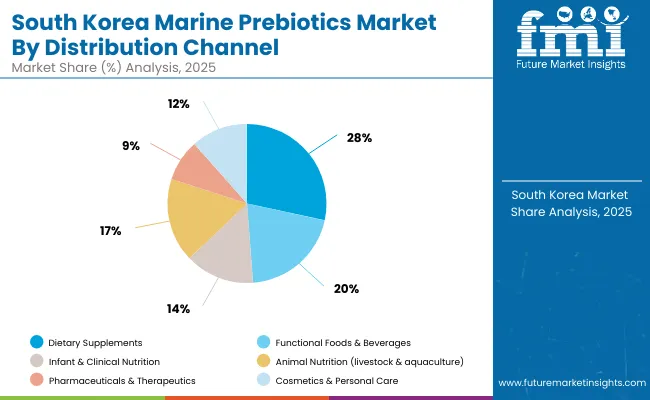
Opportunity Analysis of South Korea Marine Prebiotics Market

South Korea Marine Prebiotics Market

Application Market Value Share, 2025
Dietary Supplements 28.4%
Functional Foods & Beverages 20.4%
Infant & Clinical Nutrition 14.1%
Animal Nutrition (livestock & aquaculture) 17.1%
Pharmaceuticals & Therapeutics 8.5%
Cosmetics & Personal Care 11.5%

The Marine Prebiotics Market in South Korea is projected to expand steadily, supported by advanced functional food innovation and a strong domestic culture of preventive healthcare. In 2025, dietary supplements are expected to lead with 28.4% share, reflecting widespread consumer reliance on microbiome-supporting solutions. Functional foods and beverages, at 20.4%, are anticipated to benefit from South Korea’s position as a trendsetter in health-oriented food and drink formulations.

Higher growth momentum is forecasted in pharmaceuticals (8.2% CAGR) and cosmetics (8.5% CAGR), where marine prebiotics are increasingly recognized for their therapeutic and skin wellness benefits. Infant and clinical nutrition is also anticipated to grow steadily at 7.6% CAGR, reflecting strong emphasis on maternal and child health. Animal nutrition is projected to gain relevance through aquaculture, given South Korea’s investments in marine sustainability.
  • Supplements remain the largest application, aligned with strong consumer trust in probiotics and prebiotics.
  • Cosmetics and pharmaceuticals are expected to diversify market growth with premium innovation.
  • Functional foods will remain a core driver of mainstream adoption.
  • Aquaculture integration is projected to reinforce sustainability-linked demand.

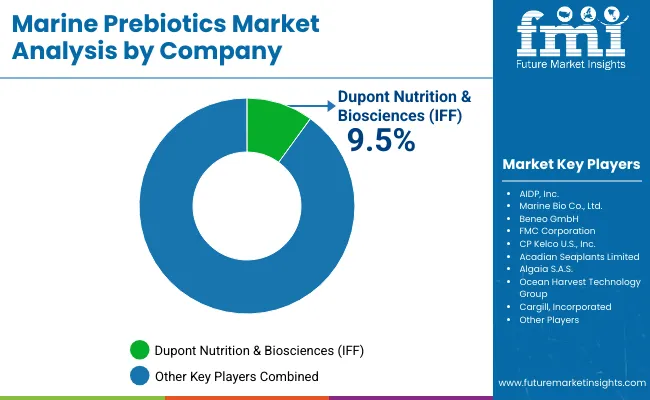
Competitive Landscape of Marine Prebiotics Market

Marine Prebiotics Market By Comapny

Company Global Value Share 2025
Dupont Nutrition & Biosciences (IFF) 9.5%
Others 90 .5%

The Marine Prebiotics Market is moderately fragmented, with global leaders, mid-sized innovators, and specialized firms competing across diverse application areas. Multinational ingredient leaders such as Dupont Nutrition & Biosciences (IFF), Beneo GmbH, and Cargill, Incorporated are expected to maintain significant market positions, supported by advanced R&D capabilities, extensive distribution networks, and integration into global food, pharmaceutical, and nutraceutical value chains. Their strategies are being increasingly aligned with sustainability commitments, clinical validation, and cross-category innovation.

Established marine-focused specialists such as FMC Corporation, CP Kelco USA, Inc., and Acadian Seaplants Limited are reinforcing competitiveness by leveraging expertise in seaweed-derived bioactives, scalable extraction technologies, and partnerships with global nutraceutical and cosmetic brands. Their ability to deliver traceable, natural, and eco-certified solutions is expected to remain a critical differentiator in high-value markets.

Niche players including Marine Bio Co., Ltd., Algaia S.A.S., AIDP, Inc., and Ocean Harvest Technology Group are positioning themselves through innovation-driven approaches, catering to specific product applications such as dietary supplements, infant nutrition, and animal feed. These firms are expected to benefit from targeted regional demand and customized solutions.

Competitive differentiation is shifting toward end-to-end ecosystems, where clinical substantiation, digital supply chain integration, and sustainability-driven narratives are projected to define future success.

Key Developments in Marine Prebiotics Market

  • In August 2025, Acadian Seaplants confirmed gut-health benefits of its cultivated red seaweed Palmaria palmata (dulse), with xylan-rich fiber (>15%) demonstrating strong prebiotic effects. This development is being leveraged for nutraceutical and clean-label food applications, reinforcing traceability, sustainability, and function in marine prebiotic ingredients.
  • In December 2024, the ILSI Europe Prebiotics Task Force published a roadmap in Gut Microbes proposing standardized protocols, biomarker validation, and regulatory clarity to enable use of the term “prebiotic” in health claims in Europe. This development is being viewed as foundational for market trust and product innovation.

Scope of the Report

Item Value
Quantitative Units USD 240.6 million
Product Type Marine Polysaccharides (fucoidan, laminarin, alginate); Marine Oligosaccharides (GOS, XOS); Marine Fibers (chitosan, chitin, seaweed fiber); Other Marine-Derived Prebiotics
Source Seaweed (brown, red, green); Microalgae (spirulina, chlorella, nannochloropsis); Marine Crustaceans (chitin/chitosan from shell waste); Marine Bacteria & Fungi (fermentation-derived prebiotics)
Application Dietary Supplements; Functional Foods & Beverages; Infant & Clinical Nutrition; Animal Nutrition (livestock & aquaculture); Pharmaceuticals & Therapeutics; Cosmetics & Personal Care
End-User Human Nutrition & Health; Animal & Aquaculture Feed; Industrial Users (cosmeceutical & pharmaceutical companies)
Distribution Channel Direct (B2B ingredient supply); Retail (supermarkets & pharmacies); Online Sales (nutraceuticals & functional platforms); Specialty & Health Stores
Regions Covered North America, Europe, Asia-Pacific, Latin America, Middle East & Africa
Country Covered United States, Canada, Germany, France, United Kingdom, China, Japan, India, Brazil, South Africa
Key Companies Profiled AIDP, Inc.; Marine Bio Co., Ltd.; Beneo GmbH; Dupont Nutrition & Biosciences (IFF); FMC Corporation; CP Kelco USA, Inc.; Acadian Seaplants Limited; Algaia S.A.S.; Ocean Harvest Technology Group; Cargill, Incorporated
Additional Attributes Dollar sales by product type and application; adoption trends in functional foods, supplements, and animal feed; rising use in pharmaceuticals and cosmetics; sustainability-driven sourcing from seaweed and algae; regional shifts in marine biotechnology investment; regulatory support for health claims; and innovation in bioavailability and fermentation processes.

Key Segmentation

By Product Type:

  • Marine Polysaccharides
    • Fucoidan
    • Laminarin
    • Alginate
  • Marine Oligosaccharides
    • Galacto-Oligosaccharides
    • Xylo-oligosaccharides
  • Marine Fibers
  • Other Marine-Derived Prebiotics

By Source:

  • Seaweed
  • Microalgae
  • Marine Crustaceans
  • Marine Bacteria and Fungi

By Application:

  • Dietary Supplements
  • Functional Foods & Beverages
  • Infant & Clinical Nutrition
  • Animal Nutrition (livestock & aquaculture)
  • Pharmaceuticals & Therapeutics
  • Cosmetics & Personal Care

By Distribution Channel:

  • Direct (B2B ingredient supply)
  • Retail Sales
  • Online Sales
  • Specialty & Health Stores

By End User:

  • Human Nutrition & Health
  • Animal & Aquaculture Feed
  • Industrial Users

By Region:

  • North America
  • Latin America
  • Europe
  • East Asia
  • South Asia & Pacific
  • Middle East and Africa

Table of Content

  1. Executive Summary
    • Global Market Outlook
    • Demand-side Trends
    • Supply-side Trends
    • Technology Roadmap Analysis
    • Analysis and Recommendations
  2. Market Overview
    • Market Coverage / Taxonomy
    • Market Definition / Scope / Limitations
  3. Market Background
    • Market Dynamics
      • Drivers
      • Restraints
      • Opportunity
      • Trends
    • Scenario Forecast
      • Demand in Optimistic Scenario
      • Demand in Likely Scenario
      • Demand in Conservative Scenario
    • Opportunity Map Analysis
    • Product Life Cycle Analysis
    • Supply Chain Analysis
    • Investment Feasibility Matrix
    • Value Chain Analysis
    • PESTLE and Porter’s Analysis
    • Regulatory Landscape
    • Regional Parent Market Outlook
    • Production and Consumption Statistics
    • Import and Export Statistics
  4. Global Analysis 2020 to 2024 and Forecast, 2025 to 2035
    • Historical Market Size Value (USD Million) & Volume (Units) Analysis, 2020 to 2024
    • Current and Future Market Size Value (USD Million) & Volume (Units) Projections, 2025 to 2035
      • Y-o-Y Growth Trend Analysis
      • Absolute $ Opportunity Analysis
  5. Global Pricing Analysis 2020 to 2024 and Forecast 2025 to 2035
  6. Global Analysis 2020 to 2024 and Forecast 2025 to 2035, By Product Type
    • Introduction / Key Findings
    • Historical Market Size Value (USD Million) & Volume (Units) Analysis By Product Type, 2020 to 2024
    • Current and Future Market Size Value (USD Million) & Volume (Units) Analysis and Forecast By Product Type, 2025 to 2035
      • Marine Polysaccharides
        • Fucoidan
        • Laminarin
        • Alginate
      • Marine Oligosaccharides
        • Galacto-Oligosaccharides
        • Xylo-oligosaccharides
      • Marine Fibers
      • Other Marine-Derived Prebiotics
    • Y-o-Y Growth Trend Analysis By Product Type, 2020 to 2024
    • Absolute $ Opportunity Analysis By Product Type, 2025 to 2035
  7. Global Analysis 2020 to 2024 and Forecast 2025 to 2035, By Source
    • Introduction / Key Findings
    • Historical Market Size Value (USD Million) & Volume (Units) Analysis By Source, 2020 to 2024
    • Current and Future Market Size Value (USD Million) & Volume (Units) Analysis and Forecast By Source, 2025 to 2035
      • Seaweed
      • Microalgae
      • Marine Crustaceans
      • Marine Bacteria and Fungi
    • Y-o-Y Growth Trend Analysis By Source, 2020 to 2024
    • Absolute $ Opportunity Analysis By Source, 2025 to 2035
  8. Global Analysis 2020 to 2024 and Forecast 2025 to 2035, By Application
    • Introduction / Key Findings
    • Historical Market Size Value (USD Million) & Volume (Units) Analysis By Application, 2020 to 2024
    • Current and Future Market Size Value (USD Million) & Volume (Units) Analysis and Forecast By Application, 2025 to 2035
      • Dietary Supplements
      • Functional Foods & Beverages
      • Infant & Clinical Nutrition
      • Animal Nutrition (livestock & aquaculture)
      • Pharmaceuticals & Therapeutics
      • Cosmetics & Personal Care
    • Y-o-Y Growth Trend Analysis By Application, 2020 to 2024
    • Absolute $ Opportunity Analysis By Application, 2025 to 2035
  9. Global Analysis 2020 to 2024 and Forecast 2025 to 2035, By Distribution Channel
    • Introduction / Key Findings
    • Historical Market Size Value (USD Million) & Volume (Units) Analysis By Distribution Channel, 2020 to 2024
    • Current and Future Market Size Value (USD Million) & Volume (Units) Analysis and Forecast By Distribution Channel, 2025 to 2035
      • Direct (B2B ingredient supply)
      • Retail Sales
      • Online Sales
      • Specialty & Health Stores
    • Y-o-Y Growth Trend Analysis By Distribution Channel, 2020 to 2024
    • Absolute $ Opportunity Analysis By Distribution Channel, 2025 to 2035
  10. Global Analysis 2020 to 2024 and Forecast 2025 to 2035, By End User
    • Introduction / Key Findings
    • Historical Market Size Value (USD Million) & Volume (Units) Analysis By End User, 2020 to 2024
    • Current and Future Market Size Value (USD Million) & Volume (Units) Analysis and Forecast By End User, 2025 to 2035
      • Human Nutrition & Health
      • Animal & Aquaculture Feed
      • Industrial Users
    • Y-o-Y Growth Trend Analysis By End User, 2020 to 2024
    • Absolute $ Opportunity Analysis By End User, 2025 to 2035
  11. Global Analysis 2020 to 2024 and Forecast 2025 to 2035, By Region
    • Introduction
    • Historical Market Size Value (USD Million) & Volume (Units) Analysis By Region, 2020 to 2024
    • Current Market Size Value (USD Million) & Volume (Units) Analysis and Forecast By Region, 2025 to 2035
      • North America
      • Latin America
      • Europe
      • East Asia
      • South Asia & Pacific
      • Middle East and Africa
    • Market Attractiveness Analysis By Region
  12. North America Analysis 2020 to 2024 and Forecast 2025 to 2035, By Country
    • Historical Market Size Value (USD Million) & Volume (Units) Trend Analysis By Market Taxonomy, 2020 to 2024
    • Market Size Value (USD Million) & Volume (Units) Forecast By Market Taxonomy, 2025 to 2035
      • By Country
        • U.S.
        • Canada
      • By Product Type
      • By Source
      • By Application
      • By Distribution Channel
      • By End User
    • Market Attractiveness Analysis
      • By Country
      • By Product Type
      • By Source
      • By Application
      • By Distribution Channel
      • By End User
    • Key Takeaways
  13. Latin America Analysis 2020 to 2024 and Forecast 2025 to 2035, By Country
    • Historical Market Size Value (USD Million) & Volume (Units) Trend Analysis By Market Taxonomy, 2020 to 2024
    • Market Size Value (USD Million) & Volume (Units) Forecast By Market Taxonomy, 2025 to 2035
      • By Country
        • Brazil
        • Mexico
        • Colombia
        • Rest of Latin America
      • By Product Type
      • By Source
      • By Application
      • By Distribution Channel
      • By End User
    • Market Attractiveness Analysis
      • By Country
      • By Product Type
      • By Source
      • By Application
      • By Distribution Channel
      • By End User
    • Key Takeaways
  14. Europe Analysis 2020 to 2024 and Forecast 2025 to 2035, By Country
    • Historical Market Size Value (USD Million) & Volume (Units) Trend Analysis By Market Taxonomy, 2020 to 2024
    • Market Size Value (USD Million) & Volume (Units) Forecast By Market Taxonomy, 2025 to 2035
      • By Country
        • Germany
        • U.K.
        • France
        • Italy
        • Spain
        • Belgium
        • Netherlands
        • Nordic
        • Switzerland
        • Russia
        • Poland
        • Rest of Europe
      • By Product Type
      • By Source
      • By Application
      • By Distribution Channel
      • By End User
    • Market Attractiveness Analysis
      • By Country
      • By Product Type
      • By Source
      • By Application
      • By Distribution Channel
      • By End User
    • Key Takeaways
  15. East Asia Analysis 2020 to 2024 and Forecast 2025 to 2035, By Country
    • Historical Market Size Value (USD Million) & Volume (Units) Trend Analysis By Market Taxonomy, 2020 to 2024
    • Market Size Value (USD Million) & Volume (Units) Forecast By Market Taxonomy, 2025 to 2035
      • By Country
        • China
        • Japan
        • South Korea
      • By Product Type
      • By Source
      • By Application
      • By Distribution Channel
      • By End User
    • Market Attractiveness Analysis
      • By Country
      • By Product Type
      • By Source
      • By Application
      • By Distribution Channel
      • By End User
    • Key Takeaways
  16. South Asia & Pacific Analysis 2020 to 2024 and Forecast 2025 to 2035, By Country
    • Historical Market Size Value (USD Million) & Volume (Units) Trend Analysis By Market Taxonomy, 2020 to 2024
    • Market Size Value (USD Million) & Volume (Units) Forecast By Market Taxonomy, 2025 to 2035
      • By Country
        • India
        • Thailand
        • Malaysia
        • Indonesia
        • Singapore
        • Vietnam
        • Australia
        • New Zealand
        • Rest of South Asia
      • By Product Type
      • By Source
      • By Application
      • By Distribution Channel
      • By End User
    • Market Attractiveness Analysis
      • By Country
      • By Product Type
      • By Source
      • By Application
      • By Distribution Channel
      • By End User
    • Key Takeaways
  17. Middle East and Africa Analysis 2020 to 2024 and Forecast 2025 to 2035, By Country
    • Historical Market Size Value (USD Million) & Volume (Units) Trend Analysis By Market Taxonomy, 2020 to 2024
    • Market Size Value (USD Million) & Volume (Units) Forecast By Market Taxonomy, 2025 to 2035
      • By Country
        • Turkey
        • UAE
        • Saudi Arabia
        • Israel
        • Other GCC Countries
        • North Africa
        • South Africa
      • By Product Type
      • By Source
      • By Application
      • By Distribution Channel
      • By End User
    • Market Attractiveness Analysis
      • By Country
      • By Product Type
      • By Source
      • By Application
      • By Distribution Channel
      • By End User
    • Key Takeaways
  18. Key Countries Analysis
    • U.S.
      • Pricing Analysis
      • Market Share Analysis, 2024
        • By Product Type
        • By Source
        • By Application
        • By Distribution Channel
        • By End User
    • Canada
      • Pricing Analysis
      • Market Share Analysis, 2024
        • By Product Type
        • By Source
        • By Application
        • By Distribution Channel
        • By End User
    • Mexico
      • Pricing Analysis
      • Market Share Analysis, 2024
        • By Product Type
        • By Source
        • By Application
        • By Distribution Channel
        • By End User
    • Brazil
      • Pricing Analysis
      • Market Share Analysis, 2024
        • By Product Type
        • By Source
        • By Application
        • By Distribution Channel
        • By End User
    • Chile
      • Pricing Analysis
      • Market Share Analysis, 2024
        • By Product Type
        • By Source
        • By Application
        • By Distribution Channel
        • By End User
    • Germany
      • Pricing Analysis
      • Market Share Analysis, 2024
        • By Product Type
        • By Source
        • By Application
        • By Distribution Channel
        • By End User
    • U.K.
      • Pricing Analysis
      • Market Share Analysis, 2024
        • By Product Type
        • By Source
        • By Application
        • By Distribution Channel
        • By End User
    • Italy
      • Pricing Analysis
      • Market Share Analysis, 2024
        • By Product Type
        • By Source
        • By Application
        • By Distribution Channel
        • By End User
    • Spain
      • Pricing Analysis
      • Market Share Analysis, 2024
        • By Product Type
        • By Source
        • By Application
        • By Distribution Channel
        • By End User
    • France
      • Pricing Analysis
      • Market Share Analysis, 2024
        • By Product Type
        • By Source
        • By Application
        • By Distribution Channel
        • By End User
    • India
      • Pricing Analysis
      • Market Share Analysis, 2024
        • By Product Type
        • By Source
        • By Application
        • By Distribution Channel
        • By End User
    • ASEAN
      • Pricing Analysis
      • Market Share Analysis, 2024
        • By Product Type
        • By Source
        • By Application
        • By Distribution Channel
        • By End User
    • Australia & New Zealand
      • Pricing Analysis
      • Market Share Analysis, 2024
        • By Product Type
        • By Source
        • By Application
        • By Distribution Channel
        • By End User
    • China
      • Pricing Analysis
      • Market Share Analysis, 2024
        • By Product Type
        • By Source
        • By Application
        • By Distribution Channel
        • By End User
    • Japan
      • Pricing Analysis
      • Market Share Analysis, 2024
        • By Product Type
        • By Source
        • By Application
        • By Distribution Channel
        • By End User
    • South Korea
      • Pricing Analysis
      • Market Share Analysis, 2024
        • By Product Type
        • By Source
        • By Application
        • By Distribution Channel
        • By End User
    • Russia
      • Pricing Analysis
      • Market Share Analysis, 2024
        • By Product Type
        • By Source
        • By Application
        • By Distribution Channel
        • By End User
    • Poland
      • Pricing Analysis
      • Market Share Analysis, 2024
        • By Product Type
        • By Source
        • By Application
        • By Distribution Channel
        • By End User
    • Hungary
      • Pricing Analysis
      • Market Share Analysis, 2024
        • By Product Type
        • By Source
        • By Application
        • By Distribution Channel
        • By End User
    • Kingdom of Saudi Arabia
      • Pricing Analysis
      • Market Share Analysis, 2024
        • By Product Type
        • By Source
        • By Application
        • By Distribution Channel
        • By End User
    • Turkiye
      • Pricing Analysis
      • Market Share Analysis, 2024
        • By Product Type
        • By Source
        • By Application
        • By Distribution Channel
        • By End User
    • South Africa
      • Pricing Analysis
      • Market Share Analysis, 2024
        • By Product Type
        • By Source
        • By Application
        • By Distribution Channel
        • By End User
  19. Market Structure Analysis
    • Competition Dashboard
    • Competition Benchmarking
    • Market Share Analysis of Top Players
      • By Regional
      • By Product Type
      • By Source
      • By Application
      • By Distribution Channel
      • By End User
  20. Competition Analysis
    • Competition Deep Dive
      • AIDP, Inc.
        • Overview
        • Product Portfolio
        • Profitability by Market Segments (Product/Age /Sales Channel/Region)
        • Sales Footprint
        • Strategy Overview
      • Marine Bio Co., Ltd.
      • Beneo GmbH
      • Dupont Nutrition & Biosciences (IFF)
      • FMC Corporation
      • CP Kelco U.S., Inc.
      • Acadian Seaplants Limited
      • Algaia S.A.S.
      • Ocean Harvest Technology Group
      • Cargill, Incorporated
    • Assumptions & Acronyms Used
    • Research Methodology

List of Tables

  • Table 1: Global Value (USD Million) Forecast by Region, 2020-2035
  • Table 2: Global Volume (Units) Forecast by Region, 2020-2035
  • Table 3: Global Value (USD Million) Forecast by Product Type, 2020-2035
  • Table 4: Global Volume (Units) Forecast by Product Type, 2020-2035
  • Table 5: Global Value (USD Million) Forecast by Source, 2020-2035
  • Table 6: Global Volume (Units) Forecast by Source, 2020-2035
  • Table 7: Global Value (USD Million) Forecast by Application, 2020-2035
  • Table 8: Global Volume (Units) Forecast by Application, 2020-2035
  • Table 9: Global Value (USD Million) Forecast by Distribution Channel, 2020-2035
  • Table 10: Global Volume (Units) Forecast by Distribution Channel, 2020-2035
  • Table 11: Global Value (USD Million) Forecast by End User, 2020-2035
  • Table 12: Global Volume (Units) Forecast by End User, 2020-2035
  • Table 13: North America Value (USD Million) Forecast by Country, 2020-2035
  • Table 14: North America Volume (Units) Forecast by Country, 2020-2035
  • Table 15: North America Value (USD Million) Forecast by Product Type, 2020-2035
  • Table 16: North America Volume (Units) Forecast by Product Type, 2020-2035
  • Table 17: North America Value (USD Million) Forecast by Source, 2020-2035
  • Table 18: North America Volume (Units) Forecast by Source, 2020-2035
  • Table 19: North America Value (USD Million) Forecast by Application, 2020-2035
  • Table 20: North America Volume (Units) Forecast by Application, 2020-2035
  • Table 21: North America Value (USD Million) Forecast by Distribution Channel, 2020-2035
  • Table 22: North America Volume (Units) Forecast by Distribution Channel, 2020-2035
  • Table 23: North America Value (USD Million) Forecast by End User, 2020-2035
  • Table 24: North America Volume (Units) Forecast by End User, 2020-2035
  • Table 25: Latin America Value (USD Million) Forecast by Country, 2020-2035
  • Table 26: Latin America Volume (Units) Forecast by Country, 2020-2035
  • Table 27: Latin America Value (USD Million) Forecast by Product Type, 2020-2035
  • Table 28: Latin America Volume (Units) Forecast by Product Type, 2020-2035
  • Table 29: Latin America Value (USD Million) Forecast by Source, 2020-2035
  • Table 30: Latin America Volume (Units) Forecast by Source, 2020-2035
  • Table 31: Latin America Value (USD Million) Forecast by Application, 2020-2035
  • Table 32: Latin America Volume (Units) Forecast by Application, 2020-2035
  • Table 33: Latin America Value (USD Million) Forecast by Distribution Channel, 2020-2035
  • Table 34: Latin America Volume (Units) Forecast by Distribution Channel, 2020-2035
  • Table 35: Latin America Value (USD Million) Forecast by End User, 2020-2035
  • Table 36: Latin America Volume (Units) Forecast by End User, 2020-2035
  • Table 37: Europe Value (USD Million) Forecast by Country, 2020-2035
  • Table 38: Europe Volume (Units) Forecast by Country, 2020-2035
  • Table 39: Europe Value (USD Million) Forecast by Product Type, 2020-2035
  • Table 40: Europe Volume (Units) Forecast by Product Type, 2020-2035
  • Table 41: Europe Value (USD Million) Forecast by Source, 2020-2035
  • Table 42: Europe Volume (Units) Forecast by Source, 2020-2035
  • Table 43: Europe Value (USD Million) Forecast by Application, 2020-2035
  • Table 44: Europe Volume (Units) Forecast by Application, 2020-2035
  • Table 45: Europe Value (USD Million) Forecast by Distribution Channel, 2020-2035
  • Table 46: Europe Volume (Units) Forecast by Distribution Channel, 2020-2035
  • Table 47: Europe Value (USD Million) Forecast by End User, 2020-2035
  • Table 48: Europe Volume (Units) Forecast by End User, 2020-2035
  • Table 49: East Asia Value (USD Million) Forecast by Country, 2020-2035
  • Table 50: East Asia Volume (Units) Forecast by Country, 2020-2035
  • Table 51: East Asia Value (USD Million) Forecast by Product Type, 2020-2035
  • Table 52: East Asia Volume (Units) Forecast by Product Type, 2020-2035
  • Table 53: East Asia Value (USD Million) Forecast by Source, 2020-2035
  • Table 54: East Asia Volume (Units) Forecast by Source, 2020-2035
  • Table 55: East Asia Value (USD Million) Forecast by Application, 2020-2035
  • Table 56: East Asia Volume (Units) Forecast by Application, 2020-2035
  • Table 57: East Asia Value (USD Million) Forecast by Distribution Channel, 2020-2035
  • Table 58: East Asia Volume (Units) Forecast by Distribution Channel, 2020-2035
  • Table 59: East Asia Value (USD Million) Forecast by End User, 2020-2035
  • Table 60: East Asia Volume (Units) Forecast by End User, 2020-2035
  • Table 61: South Asia & Pacific Value (USD Million) Forecast by Country, 2020-2035
  • Table 62: South Asia & Pacific Volume (Units) Forecast by Country, 2020-2035
  • Table 63: South Asia & Pacific Value (USD Million) Forecast by Product Type, 2020-2035
  • Table 64: South Asia & Pacific Volume (Units) Forecast by Product Type, 2020-2035
  • Table 65: South Asia & Pacific Value (USD Million) Forecast by Source, 2020-2035
  • Table 66: South Asia & Pacific Volume (Units) Forecast by Source, 2020-2035
  • Table 67: South Asia & Pacific Value (USD Million) Forecast by Application, 2020-2035
  • Table 68: South Asia & Pacific Volume (Units) Forecast by Application, 2020-2035
  • Table 69: South Asia & Pacific Value (USD Million) Forecast by Distribution Channel, 2020-2035
  • Table 70: South Asia & Pacific Volume (Units) Forecast by Distribution Channel, 2020-2035
  • Table 71: South Asia & Pacific Value (USD Million) Forecast by End User, 2020-2035
  • Table 72: South Asia & Pacific Volume (Units) Forecast by End User, 2020-2035
  • Table 73: Middle East and Africa Value (USD Million) Forecast by Country, 2020-2035
  • Table 74: Middle East and Africa Volume (Units) Forecast by Country, 2020-2035
  • Table 75: Middle East and Africa Value (USD Million) Forecast by Product Type, 2020-2035
  • Table 76: Middle East and Africa Volume (Units) Forecast by Product Type, 2020-2035
  • Table 77: Middle East and Africa Value (USD Million) Forecast by Source, 2020-2035
  • Table 78: Middle East and Africa Volume (Units) Forecast by Source, 2020-2035
  • Table 79: Middle East and Africa Value (USD Million) Forecast by Application, 2020-2035
  • Table 80: Middle East and Africa Volume (Units) Forecast by Application, 2020-2035
  • Table 81: Middle East and Africa Value (USD Million) Forecast by Distribution Channel, 2020-2035
  • Table 82: Middle East and Africa Volume (Units) Forecast by Distribution Channel, 2020-2035
  • Table 83: Middle East and Africa Value (USD Million) Forecast by End User, 2020-2035
  • Table 84: Middle East and Africa Volume (Units) Forecast by End User, 2020-2035

List of Figures

  • Figure 1: Global Volume (Units) Forecast 2020-2035
  • Figure 2: Global Pricing Analysis
  • Figure 3: Global Value (USD Million) Forecast 2020-2035
  • Figure 4: Global Value Share and BPS Analysis by Product Type, 2025 and 2035
  • Figure 5: Global Y-o-Y Growth Comparison by Product Type, 2025-2035
  • Figure 6: Global Attractiveness Analysis by Product Type
  • Figure 7: Global Value Share and BPS Analysis by Source, 2025 and 2035
  • Figure 8: Global Y-o-Y Growth Comparison by Source, 2025-2035
  • Figure 9: Global Attractiveness Analysis by Source
  • Figure 10: Global Value Share and BPS Analysis by Application, 2025 and 2035
  • Figure 11: Global Y-o-Y Growth Comparison by Application, 2025-2035
  • Figure 12: Global Attractiveness Analysis by Application
  • Figure 13: Global Value Share and BPS Analysis by Distribution Channel, 2025 and 2035
  • Figure 14: Global Y-o-Y Growth Comparison by Distribution Channel, 2025-2035
  • Figure 15: Global Attractiveness Analysis by Distribution Channel
  • Figure 16: Global Value Share and BPS Analysis by End User, 2025 and 2035
  • Figure 17: Global Y-o-Y Growth Comparison by End User, 2025-2035
  • Figure 18: Global Attractiveness Analysis by End User
  • Figure 19: Global Value (USD Million) Share and BPS Analysis by Region, 2025 and 2035
  • Figure 20: Global Y-o-Y Growth Comparison by Region, 2025-2035
  • Figure 21: Global Attractiveness Analysis by Region
  • Figure 22: North America Incremental $ Opportunity, 2025-2035
  • Figure 23: Latin America Incremental $ Opportunity, 2025-2035
  • Figure 24: Europe Incremental $ Opportunity, 2025-2035
  • Figure 25: East Asia Incremental $ Opportunity, 2025-2035
  • Figure 26: South Asia & Pacific Incremental $ Opportunity, 2025-2035
  • Figure 27: Middle East and Africa Incremental $ Opportunity, 2025-2035
  • Figure 28: North America Value Share and BPS Analysis by Country, 2025 and 2035
  • Figure 29: North America Value Share and BPS Analysis by Product Type, 2025 and 2035
  • Figure 30: North America Y-o-Y Growth Comparison by Product Type, 2025-2035
  • Figure 31: North America Attractiveness Analysis by Product Type
  • Figure 32: North America Value Share and BPS Analysis by Source, 2025 and 2035
  • Figure 33: North America Y-o-Y Growth Comparison by Source, 2025-2035
  • Figure 34: North America Attractiveness Analysis by Source
  • Figure 35: North America Value Share and BPS Analysis by Application, 2025 and 2035
  • Figure 36: North America Y-o-Y Growth Comparison by Application, 2025-2035
  • Figure 37: North America Attractiveness Analysis by Application
  • Figure 38: North America Value Share and BPS Analysis by Distribution Channel, 2025 and 2035
  • Figure 39: North America Y-o-Y Growth Comparison by Distribution Channel, 2025-2035
  • Figure 40: North America Attractiveness Analysis by Distribution Channel
  • Figure 41: North America Value Share and BPS Analysis by End User, 2025 and 2035
  • Figure 42: North America Y-o-Y Growth Comparison by End User, 2025-2035
  • Figure 43: North America Attractiveness Analysis by End User
  • Figure 44: Latin America Value Share and BPS Analysis by Country, 2025 and 2035
  • Figure 45: Latin America Value Share and BPS Analysis by Product Type, 2025 and 2035
  • Figure 46: Latin America Y-o-Y Growth Comparison by Product Type, 2025-2035
  • Figure 47: Latin America Attractiveness Analysis by Product Type
  • Figure 48: Latin America Value Share and BPS Analysis by Source, 2025 and 2035
  • Figure 49: Latin America Y-o-Y Growth Comparison by Source, 2025-2035
  • Figure 50: Latin America Attractiveness Analysis by Source
  • Figure 51: Latin America Value Share and BPS Analysis by Application, 2025 and 2035
  • Figure 52: Latin America Y-o-Y Growth Comparison by Application, 2025-2035
  • Figure 53: Latin America Attractiveness Analysis by Application
  • Figure 54: Latin America Value Share and BPS Analysis by Distribution Channel, 2025 and 2035
  • Figure 55: Latin America Y-o-Y Growth Comparison by Distribution Channel, 2025-2035
  • Figure 56: Latin America Attractiveness Analysis by Distribution Channel
  • Figure 57: Latin America Value Share and BPS Analysis by End User, 2025 and 2035
  • Figure 58: Latin America Y-o-Y Growth Comparison by End User, 2025-2035
  • Figure 59: Latin America Attractiveness Analysis by End User
  • Figure 60: Europe Value Share and BPS Analysis by Country, 2025 and 2035
  • Figure 61: Europe Value Share and BPS Analysis by Product Type, 2025 and 2035
  • Figure 62: Europe Y-o-Y Growth Comparison by Product Type, 2025-2035
  • Figure 63: Europe Attractiveness Analysis by Product Type
  • Figure 64: Europe Value Share and BPS Analysis by Source, 2025 and 2035
  • Figure 65: Europe Y-o-Y Growth Comparison by Source, 2025-2035
  • Figure 66: Europe Attractiveness Analysis by Source
  • Figure 67: Europe Value Share and BPS Analysis by Application, 2025 and 2035
  • Figure 68: Europe Y-o-Y Growth Comparison by Application, 2025-2035
  • Figure 69: Europe Attractiveness Analysis by Application
  • Figure 70: Europe Value Share and BPS Analysis by Distribution Channel, 2025 and 2035
  • Figure 71: Europe Y-o-Y Growth Comparison by Distribution Channel, 2025-2035
  • Figure 72: Europe Attractiveness Analysis by Distribution Channel
  • Figure 73: Europe Value Share and BPS Analysis by End User, 2025 and 2035
  • Figure 74: Europe Y-o-Y Growth Comparison by End User, 2025-2035
  • Figure 75: Europe Attractiveness Analysis by End User
  • Figure 76: East Asia Value Share and BPS Analysis by Country, 2025 and 2035
  • Figure 77: East Asia Value Share and BPS Analysis by Product Type, 2025 and 2035
  • Figure 78: East Asia Y-o-Y Growth Comparison by Product Type, 2025-2035
  • Figure 79: East Asia Attractiveness Analysis by Product Type
  • Figure 80: East Asia Value Share and BPS Analysis by Source, 2025 and 2035
  • Figure 81: East Asia Y-o-Y Growth Comparison by Source, 2025-2035
  • Figure 82: East Asia Attractiveness Analysis by Source
  • Figure 83: East Asia Value Share and BPS Analysis by Application, 2025 and 2035
  • Figure 84: East Asia Y-o-Y Growth Comparison by Application, 2025-2035
  • Figure 85: East Asia Attractiveness Analysis by Application
  • Figure 86: East Asia Value Share and BPS Analysis by Distribution Channel, 2025 and 2035
  • Figure 87: East Asia Y-o-Y Growth Comparison by Distribution Channel, 2025-2035
  • Figure 88: East Asia Attractiveness Analysis by Distribution Channel
  • Figure 89: East Asia Value Share and BPS Analysis by End User, 2025 and 2035
  • Figure 90: East Asia Y-o-Y Growth Comparison by End User, 2025-2035
  • Figure 91: East Asia Attractiveness Analysis by End User
  • Figure 92: South Asia & Pacific Value Share and BPS Analysis by Country, 2025 and 2035
  • Figure 93: South Asia & Pacific Value Share and BPS Analysis by Product Type, 2025 and 2035
  • Figure 94: South Asia & Pacific Y-o-Y Growth Comparison by Product Type, 2025-2035
  • Figure 95: South Asia & Pacific Attractiveness Analysis by Product Type
  • Figure 96: South Asia & Pacific Value Share and BPS Analysis by Source, 2025 and 2035
  • Figure 97: South Asia & Pacific Y-o-Y Growth Comparison by Source, 2025-2035
  • Figure 98: South Asia & Pacific Attractiveness Analysis by Source
  • Figure 99: South Asia & Pacific Value Share and BPS Analysis by Application, 2025 and 2035
  • Figure 100: South Asia & Pacific Y-o-Y Growth Comparison by Application, 2025-2035
  • Figure 101: South Asia & Pacific Attractiveness Analysis by Application
  • Figure 102: South Asia & Pacific Value Share and BPS Analysis by Distribution Channel, 2025 and 2035
  • Figure 103: South Asia & Pacific Y-o-Y Growth Comparison by Distribution Channel, 2025-2035
  • Figure 104: South Asia & Pacific Attractiveness Analysis by Distribution Channel
  • Figure 105: South Asia & Pacific Value Share and BPS Analysis by End User, 2025 and 2035
  • Figure 106: South Asia & Pacific Y-o-Y Growth Comparison by End User, 2025-2035
  • Figure 107: South Asia & Pacific Attractiveness Analysis by End User
  • Figure 108: Middle East and Africa Value Share and BPS Analysis by Country, 2025 and 2035
  • Figure 109: Middle East and Africa Value Share and BPS Analysis by Product Type, 2025 and 2035
  • Figure 110: Middle East and Africa Y-o-Y Growth Comparison by Product Type, 2025-2035
  • Figure 111: Middle East and Africa Attractiveness Analysis by Product Type
  • Figure 112: Middle East and Africa Value Share and BPS Analysis by Source, 2025 and 2035
  • Figure 113: Middle East and Africa Y-o-Y Growth Comparison by Source, 2025-2035
  • Figure 114: Middle East and Africa Attractiveness Analysis by Source
  • Figure 115: Middle East and Africa Value Share and BPS Analysis by Application, 2025 and 2035
  • Figure 116: Middle East and Africa Y-o-Y Growth Comparison by Application, 2025-2035
  • Figure 117: Middle East and Africa Attractiveness Analysis by Application
  • Figure 118: Middle East and Africa Value Share and BPS Analysis by Distribution Channel, 2025 and 2035
  • Figure 119: Middle East and Africa Y-o-Y Growth Comparison by Distribution Channel, 2025-2035
  • Figure 120: Middle East and Africa Attractiveness Analysis by Distribution Channel
  • Figure 121: Middle East and Africa Value Share and BPS Analysis by End User, 2025 and 2035
  • Figure 122: Middle East and Africa Y-o-Y Growth Comparison by End User, 2025-2035
  • Figure 123: Middle East and Africa Attractiveness Analysis by End User
  • Figure 124: Global - Tier Structure Analysis
  • Figure 125: Global - Company Share Analysis

Frequently Asked Questions

How big is the Marine Prebiotics Market in 2025?

The global Marine Prebiotics is estimated to be valued at USD 240.6 million in 2025.

What will be the size of Marine Prebiotics Market in 2035?

The market size for the Marine Prebiotics is projected to reach USD 544.0 million by 2035.

How much will be the Marine Prebiotics Market growth between 2025 and 2035?

The Marine Prebiotics is expected to grow at a 8.5% CAGR between 2025 and 2035.

What are the key product type in the Marine Prebiotics Market?

The key product types in the Marine Prebiotics Market are marine polysaccharides, marine oligosaccharides, marine fibers, and other marine-derived prebiotics.

Which application segment to contribute significant share in the Marine Prebiotics Market in 2025?

In terms of application, , the dietary supplements segment is expected to command the largest share of 29.4% in 2025, followed by functional foods & beverages and animal nutrition.

Explore Similar Insights

Future Market Insights

Marine Prebiotics Market

Chat With

MaRIA

Hi There, I am MaRIA, Your Market Research Intelligence Assistant. How may I help you?