Percutaneous Electrical Nerve Stimulators Market Size, Share & Forecast Outlook 2025 to 2035

The percutaneous electrical nerve stimulators market is valued at USD 311.3 million in 2025 and is projected to grow to USD 547 million by 2035, at a CAGR of 5.8%. This expansion is being fueled by the mounting prevalence of chronic pain and neurological disorders, with electrically based neuromodulation increasingly favored over pharmacological therapies.
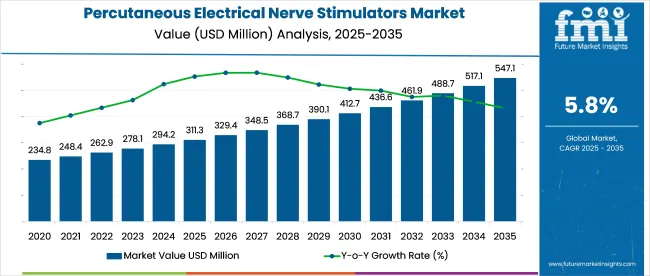
Quick Stats of the Percutaneous Electrical Nerve Stimulators Market

  • Industry Size (2025): USD 311.3 million
  • Industry Value (2035): USD 547 million
  • Forecast CAGR (2025 to 2035): 5.8%
  • Leading Segment: Chronic Musculoskeletal Pain (32%)
  • Key Growth Region: Asia Pacific (India)
  • Key Players: IonClinics, Vertis Neurosciences, Biowave Corp., SPR Therapeutics, Inc., DyAnsys, Inc.

Percutaneous Electrical Nerve Stimulators Market

Technological sophistication is being introduced via percutaneous modalities, such as fine-needle electrodes, which are believed to offer better depth targeting than non-invasive transcutaneous units. It is suggested that early adoption of image-guided insertion and remote programming platforms will differentiate premium suppliers. Industry consolidation is being anticipated as larger medtech firms acquire niche nervestimulator specialists to build integrated chronicpain portfolios.

In November 2024, NeurAxis secured expanded FDA 510(k) clearance for its IB-Stim device, enhancing its position in the industry. This regulatory milestone significantly increases the device’s clinical application across broader patient groups, reinforcing its role in non-opioid pain management and neuromodulation therapy.

The IB-Stim system delivers targeted electrical stimulation through the ear to influence autonomic nervous system function. Addressing this expansion, Brian Carrico, President and CEO of NeurAxis, stated, “We are excited to receive this new 510(k) clearance for IBStim, which expands the IBStim addressable market by roughly 75%.” The quote reflects the commercial potential unlocked by this clearance.

The industry holds a specialized share within its parent markets. In the medical devices market, it accounts for approximately 2-3%, as it is a niche segment focused on pain relief and nerve stimulation. Within the pain management market, its share is around 5-7%, driven by the increasing demand for non-invasive pain treatment options for chronic pain conditions.

In the neurology market, the share is about 3-5%, as these stimulators are used for neurological disorders, such as nerve pain and rehabilitation. In the physical therapy market, its share is approximately 4-6%, as these devices are commonly used in rehabilitation therapies for muscle and nerve stimulation. In the electrotherapy market, the share is around 6-8%, reflecting its growing application in various therapeutic treatments.

Analyzing Percutaneous Electrical Nerve Stimulators Market by Top Investment Segments

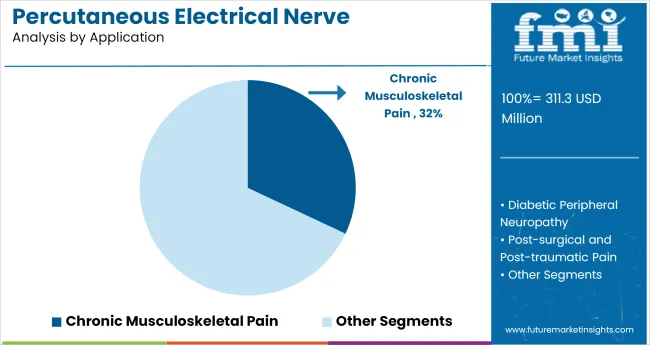
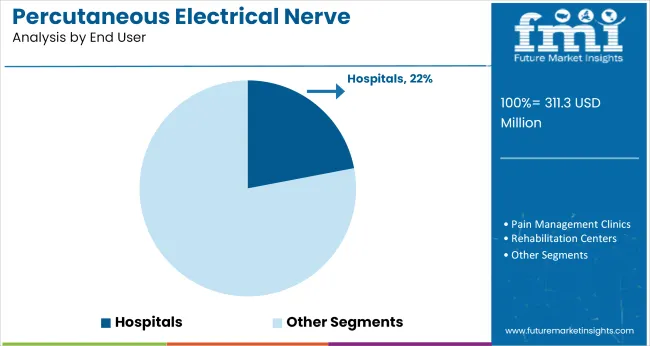
The industry is projected to grow, with percutaneous needle-based stimulators capturing 28% of the industry, chronic musculoskeletal pain leading the application segment with 32%, and hospitals representing 22% of the end-user share.
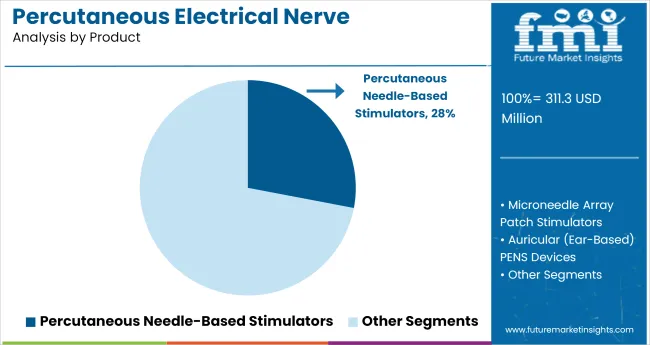
Percutaneous needle-based stimulators lead product segment with 28% industry share

Percutaneous Electrical Nerve Stimulators Market Analysis By Product

Percutaneous needle-based stimulators are expected to account for 28% of the industry share in 2025. These devices are commonly used for targeted nerve stimulation in treating pain, particularly in patients with musculoskeletal conditions.

Percutaneous needle-based stimulators are known for their precise delivery of electrical impulses to specific nerves, offering an effective treatment for chronic pain conditions. Their ability to provide localized pain relief while minimizing systemic side effects makes them a popular choice among healthcare providers and patients.
  • Precise and localized pain relief through targeted nerve stimulation
  • Effective treatment option for chronic musculoskeletal pain conditions
  • Increased demand due to growing awareness of non-invasive pain management options

Chronic musculoskeletal pain dominates application segment with 32% industry share

Percutaneous Electrical Nerve Stimulators Market Analysis By Application

Chronic musculoskeletal pain is expected to hold 32% of the application industry share in 2025. This condition is one of the most common reasons for seeking percutaneous electrical nerve stimulation therapy.

The growing prevalence of musculoskeletal disorders, such as arthritis, back pain, and neck pain, is driving the demand for pain management therapies like nerve stimulators. As non-invasive treatment options gain popularity, the chronic musculoskeletal pain segment continues to be the largest application for percutaneous electrical nerve stimulators.
  • High prevalence of musculoskeletal disorders drives demand for nerve stimulators
  • Non-invasive treatment options offer pain relief without surgery or medication
  • Growing awareness of chronic pain management fuels the industry demand

Hospitals lead end-user segment with 22% industry share

Percutaneous Electrical Nerve Stimulators Market Analysis By End User

Hospitals are projected to capture 22% of the end-user industry share for percutaneous electrical nerve stimulators in 2025. Hospitals are the primary setting for advanced pain management therapies, including percutaneous nerve stimulation, due to their comprehensive medical infrastructure and specialized staff.

The growing use of non-invasive treatments in hospitals, along with increased adoption of nerve stimulators in pain management protocols, reinforces their dominant position in the industry.

  • Hospitals offer advanced infrastructure for non-invasive pain management treatments
  • Specialized medical teams support the use of percutaneous electrical nerve stimulators
  • Increasing adoption of nerve stimulation therapy in hospitals boosts industry growth

Top Percutaneous Electrical Nerve Stimulators Market Dynamics

The industry is expanding due to rising demand for non-invasive pain management solutions, driven by preferences for alternatives to opioids. However, high costs and the need for specialized training limit accessibility, especially in regions with constrained healthcare resources.

Growing Demand for Non-Invasive Pain Management Solutions

The industry is experiencing growth due to increasing consumer preference for non-invasive pain relief options. As the demand for alternatives to traditional pain management methods, such as opioids, rises, percutaneous electrical nerve stimulators are gaining popularity.

These devices offer targeted pain relief for conditions like chronic back pain, arthritis, and post-surgical recovery. The shift towards safer, non-invasive treatments is driving the adoption of nerve stimulators, particularly among patients seeking alternatives with fewer side effects.

  • The preference for non-invasive pain relief is driving industry growth.
  • Percutaneous electrical nerve stimulators are gaining popularity as opioid alternatives.
  • These devices are increasingly used for chronic pain management and post-surgical recovery.

High Cost and Accessibility Limit Industry Growth

Despite growing demand, the industry faces challenges from high costs and limited accessibility. The devices often require significant investment, making them less accessible to patients in regions with constrained healthcare budgets.

These devices typically require specialized training for proper use, creating barriers to adoption in smaller clinics or non-specialized healthcare settings. These factors limit the widespread use of percutaneous electrical nerve stimulators, especially in developing industries where affordability and infrastructure are concerns.
  • High costs of devices create accessibility barriers for patients in low-budget regions.
  • Specialized training requirements limit adoption in smaller clinics and non-specialized settings.
  • Industry growth is restricted in developing regions with affordability and infrastructure challenges.

Analyzing Key Countries Producing, Distributing, and Adopting Percutaneous Electrical Nerve Stimulators

Percutaneous Electrical Nerve Stimulators Market Cagr Analysis By Country

Countries CAGR (2025 to 2035)
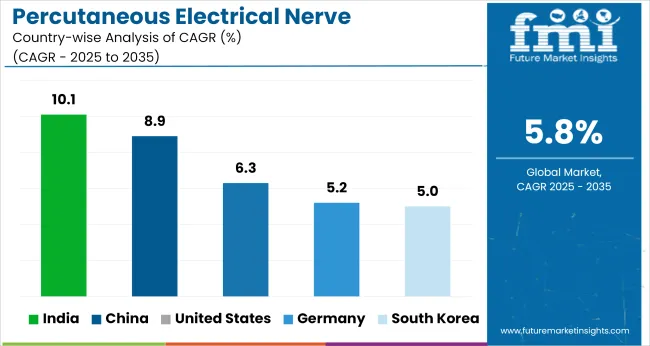
India 10.1%
China 8.9%
United States 6.3%
Germany 5.2%
South Korea 5%

Global industry demand is projected to rise at a 5.8% CAGR from 2025 to 2035. Of the five profiled countries out of 40 covered, India leads at 10.1%, followed by China at 8.9%, and the United States at 6.3%, while Germany posts 5.2% and South Korea records 5.0%. These rates translate to a growth premium of +74% for India, +53% for China, and -9% for Germany versus the baseline, while South Korea shows the slowest growth.

Divergence reflects local catalysts: expanding healthcare access and rising demand for non-invasive pain management solutions in India and China, steady demand in the United States due to established healthcare infrastructure, and slower adoption in Germany and South Korea driven by industry saturation and more mature healthcare systems.

India Percutaneous Electrical Nerve Stimulators Market Outlook

The industry in India is projected to grow at a CAGR of 10.1% through 2035, led by rising pain therapy adoption across outpatient and homecare settings. Regional hospitals are using these devices for musculoskeletal and post-surgical recovery programs. State-led tenders have incorporated nerve stimulators under physiotherapy equipment packages.

Insurance inclusion under Ayushman Bharat has widened access to low-income patients. Clinical demand is further driven by orthopedic surgeons integrating electrical nerve stimulation post-arthroscopy and fracture fixation.

  • District health schemes are bundling stimulators with rehab protocols for accident victims.
  • Private clinics in Tier-2 cities now stock reusable nerve stimulators for rent.
  • Ayurveda hospitals use them as adjuncts in chronic back pain therapy.

China Percutaneous Electrical Nerve Stimulators Market Trends

The industry in China is forecast to expand at 8.9% CAGR from 2025 to 2035. Strong integration into outpatient physical medicine departments supports nationwide device uptake. Reimbursement through the Urban Employee Basic Medical Insurance (UEBMI) and fast-track approvals under NMPA have allowed local production to scale.

Tertiary hospitals are using multi-channel stimulators for nerve regeneration in diabetic neuropathy cases. Adoption is also growing in sports clinics and senior care institutions.

  • Export-focused manufacturers in Shenzhen supply devices with CE and FDA registration.
  • Shanghai's public hospitals use stimulators in gait training for stroke patients.
  • Bundled TENS and percutaneous units are promoted by local rehab chains.

United States Percutaneous Electrical Nerve Stimulators Market Insights

The United States industry is projected to grow at a CAGR of 6.3% between 2025 and 2035. Ambulatory surgical centers and pain clinics are driving volumes, especially for sciatica, spinal stenosis, and shoulder impingement cases.

Medicare Part B includes coverage under durable medical equipment for defined indications. Adoption has risen in veteran hospitals and occupational therapy centers. Demand has intensified as opioid alternatives are being promoted by insurers and state health agencies.

  • Payer formularies are listing peripheral nerve stimulators for lower back pain.
  • Home health agencies use Bluetooth-linked stimulators in post-operative care.
  • Workers’ compensation insurers fund units for repetitive strain injury cases.

Germany Percutaneous Electrical Nerve Stimulators Market Forecast

The industry in Germany is expected to grow at 5.2% CAGR. Public hospitals use stimulators in physiotherapy programs reimbursed under statutory health insurance (GKV). Neurology and orthopedic centers use percutaneous devices for nerve entrapment and neuropathic pain.

Preference for CE-certified products, combined with outpatient rehab mandates, sustains hospital-level demand. Device leasing models are emerging in rural clinics.

  • Krankenkassen-approved suppliers offer rentals for post-op shoulder and knee cases.
  • Manual therapists include nerve stimulators in interdisciplinary care models.
  • Tender bids from municipal hospitals favor dual-mode stimulators.

South Korea Percutaneous Electrical Nerve Stimulators Demand Forecast

South Korea is forecast to register a 5.0% CAGR from 2025 to 2035. Demand is centered around physiotherapy chains and tertiary hospitals in Seoul and Busan. Coverage under the National Health Insurance Service (NHIS) has expanded access. Surgeons are adopting these stimulators for managing post-laparoscopic nerve pain. Government-backed R&D investments support local device refinements for chronic lower back pain.
  • Aging demographics have pushed usage in geriatric rehab clinics.
  • Electrotherapy units are paired with kinesiotherapy under NHIS packages.
  • Distribution alliances with orthopedic clinics have improved suburban access.

Leading Percutaneous Electrical Nerve Stimulators Market Suppliers

Percutaneous Electrical Nerve Stimulators Market Analysis By Company

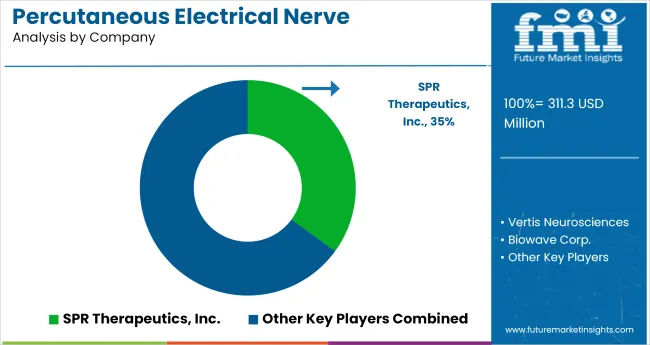
The industry is led by SPR Therapeutics, Inc., a pioneer in the development of non-invasive, short-term neurostimulation therapies. Their flagship product, the SPRINT® PNS System, has demonstrated significant efficacy in treating chronic pain conditions, including chronic low back pain and post-surgical pain, with sustained relief reported even after the treatment period.

SPR Therapeutics has expanded its industry presence through strategic partnerships and clinical studies, establishing a strong foothold in the USA and international industries.The company's focus on minimally invasive, outpatient procedures aligns with the growing demand for effective pain management solutions that minimize patient recovery time and healthcare costs.

Recent Industry Developments

  • In Q1 2025, NeurAxis achieved a 39% year-over-year revenue increase, treating around 300 patients-projecting 1,200 annually-while serving only 0.2% of the 600,000 USA children impacted by functional abdominal pain, signaling substantial untapped market potential.
  • In March 2025, Nervonik, Inc. secured USD 13 million in a Series A funding round led by USA Venture Partners, with investors including Foothill Ventures and Correlation Ventures. The capital supports advancing its next-gen, wireless, opioid-free peripheral nerve stimulation system through clinical studies, regulatory milestones, and commercialization for chronic pain relief.

Report Scope

Report Attributes Details
Current Industry Size (2025) USD 311.3 million
Projected Industry Size (2035) USD 547 million
CAGR (2025 to 2035) 5.8%
Base Year for Estimation 2024
Historical Period 2020 to 2024
Projections Period 2025 to 2035
Quantitative Units USD million for value and million units for volume
Product Segmentation Percutaneous Needle-Based Stimulators, Microneedle Array Patch Stimulators, Auricular PENS Devices, Hybrid PENS-TENS Devices, Extended-Wear PENS Systems
Application Segmentation Chronic Musculoskeletal Pain, Diabetic Peripheral Neuropathy, Post-surgical and Post-traumatic Pain, Headache and Migraines, Surface Hyperalgesia and Neuropathic Pain, Cancer-related Pain
End-User Segmentation Hospitals, Pain Management Clinics, Rehabilitation Centers, Specialty Clinics, Ambulatory Surgical Centers
Regions Covered North America, Latin America, Western Europe, Eastern Europe, East Asia, South Asia, Middle East & Africa (MEA)
Countries Covered United States, Canada, Mexico, Brazil, Argentina, Germany, France, United Kingdom, Italy, Spain, Netherlands, China, India, Japan, South Korea, Australia, New Zealand, GCC Countries, South Africa
Key Players Influencing the Industry IonClinics, Vertis Neurosciences, Biowave Corp., SPR Therapeutics, Inc., DyAnsys, Inc.
Additional Attributes Dollar sales by product type, application, and end-user, rising demand for non-invasive pain management solutions, growth in chronic pain and neuropathic pain treatment, increasing adoption in hospitals and pain management clinics, advancements in PENS technology and extended wear systems.

Key Players

  • IonClinics
  • Vertis Neurosciences
  • Biowave Corp.
  • SPR Therapeutics, Inc.
  • DyAnsys, Inc.

Percutaneous Electrical Nerve Stimulators Market Analyzed by Key Investment Segments

By Product:

Product segmentation includes Percutaneous Needle-Based Stimulators, Microneedle Array Patch Stimulators, Auricular PENS Devices, Hybrid PENS-TENS Devices, and Extended-Wear PENS Systems.

By Application:

Applications encompass Chronic Musculoskeletal Pain, Diabetic Peripheral Neuropathy, Post-surgical and Post-traumatic Pain, Headache and Migraines, Surface Hyperalgesia and Neuropathic Pain, and Cancer-related Pain.

By End User:

End users consist of Hospitals, Pain Management Clinics, Rehabilitation Centers, Specialty Clinics, and Ambulatory Surgical Centers.

By Region:

Key countries of North America, Latin America, Western Europe, Eastern Europe, East Asia, South Asia, Middle East and Africa (MEA), have been covered in the report.

Table of Content

  1. Executive Summary
    • Global Market Outlook
    • Demand-side Trends
    • Supply-side Trends
    • Technology Roadmap Analysis
    • Analysis and Recommendations
  2. Market Overview
    • Market Coverage / Taxonomy
    • Market Definition / Scope / Limitations
  3. Market Background
    • Market Dynamics
      • Drivers
      • Restraints
      • Opportunity
      • Trends
    • Scenario Forecast
      • Demand in Optimistic Scenario
      • Demand in Likely Scenario
      • Demand in Conservative Scenario
    • Opportunity Map Analysis
    • Product Life Cycle Analysis
    • Supply Chain Analysis
      • Supply Side Participants and their Roles
        • Producers
        • Mid-Level Participants (Traders/ Agents/ Brokers)
        • Wholesalers and Distributors
      • Value Added and Value Created at Node in the Supply Chain
      • List of Raw Material Suppliers
      • List of Existing and Potential Buyer’s
    • Investment Feasibility Matrix
    • Value Chain Analysis
      • Profit Margin Analysis
      • Wholesalers and Distributors
      • Retailers
    • PESTLE and Porter’s Analysis
    • Regulatory Landscape
      • By Key Regions
      • By Key Countries
    • Regional Parent Market Outlook
    • Production and Consumption Statistics
    • Import and Export Statistics
  4. Global Market Analysis 2020 to 2024 and Forecast, 2025 to 2035
    • Historical Market Size Value (USD Million) & Volume (Million Units) Analysis, 2020 to 2024
    • Current and Future Market Size Value (USD Million) & Volume (Million Units) Projections, 2025 to 2035
      • Y-o-Y Growth Trend Analysis
      • Absolute $ Opportunity Analysis
  5. Global Market Pricing Analysis 2020 to 2024 and Forecast 2025 to 2035
  6. Global Market Analysis 2020 to 2024 and Forecast 2025 to 2035, By Product
    • Introduction / Key Findings
    • Historical Market Size Value (USD Million) & Volume (Million Units) Analysis By Product, 2020 to 2024
    • Current and Future Market Size Value (USD Million) & Volume (Million Units) Analysis and Forecast By Product, 2025 to 2035
      • Percutaneous Needle-Based Stimulators
      • Microneedle Array Patch Stimulators
      • Auricular (Ear-Based) PENS Devices
      • Hybrid PENS-TENS Devices
      • Extended-Wear PENS Systems
    • Y-o-Y Growth Trend Analysis By Product, 2020 to 2024
    • Absolute $ Opportunity Analysis By Product, 2025 to 2035
  7. Global Market Analysis 2020 to 2024 and Forecast 2025 to 2035, By Application
    • Introduction / Key Findings
    • Historical Market Size Value (USD Million) & Volume (Million Units) Analysis By Application, 2020 to 2024
    • Current and Future Market Size Value (USD Million) & Volume (Million Units) Analysis and Forecast By Application, 2025 to 2035
      • Chronic Musculoskeletal Pain
      • Diabetic Peripheral Neuropathy
      • Post-surgical and Post-traumatic Pain
      • Headache and Migraines
      • Surface Hyperalgesia and Neuropathic Pain
      • Cancer-related Pain
    • Y-o-Y Growth Trend Analysis By Application, 2020 to 2024
    • Absolute $ Opportunity Analysis By Application, 2025 to 2035
  8. Global Market Analysis 2020 to 2024 and Forecast 2025 to 2035, By End-User
    • Introduction / Key Findings
    • Historical Market Size Value (USD Million) & Volume (Million Units) Analysis By End-User, 2020 to 2024
    • Current and Future Market Size Value (USD Million) & Volume (Million Units) Analysis and Forecast By End-User, 2025 to 2035
      • Hospitals
      • Pain Management Clinics
      • Rehabilitation Centers
      • Speciality Clinics
      • Ambulatory Surgical Centers
    • Y-o-Y Growth Trend Analysis By End-User, 2020 to 2024
    • Absolute $ Opportunity Analysis By End-User, 2025 to 2035
  9. Global Market Analysis 2020 to 2024 and Forecast 2025 to 2035, By Region
    • Introduction
    • Historical Market Size Value (USD Million) & Volume (Million Units) Analysis By Region, 2020 to 2024
    • Current Market Size Value (USD Million) & Volume (Million Units) Analysis and Forecast By Region, 2025 to 2035
      • North America
      • Latin America
      • Western Europe
      • Eastern Europe
      • East Asia
      • South Asia & Pacific
      • Middle East and Africa
    • Market Attractiveness Analysis By Region
  10. North America Market Analysis 2020 to 2024 and Forecast 2025 to 2035, By Country
    • Historical Market Size Value (USD Million) & Volume (Million Units) Trend Analysis By Market Taxonomy, 2020 to 2024
    • Market Size Value (USD Million) & Volume (Million Units) Forecast By Market Taxonomy, 2025 to 2035
      • By Country
        • USA
        • Canada
        • Mexico
      • By Product
      • By Application
      • By End-User
    • Market Attractiveness Analysis
      • By Country
      • By Product
      • By Application
      • By End-User
    • Key Takeaways
  11. Latin America Market Analysis 2020 to 2024 and Forecast 2025 to 2035, By Country
    • Historical Market Size Value (USD Million) & Volume (Million Units) Trend Analysis By Market Taxonomy, 2020 to 2024
    • Market Size Value (USD Million) & Volume (Million Units) Forecast By Market Taxonomy, 2025 to 2035
      • By Country
        • Brazil
        • Argentina
        • Rest of LATAM
      • By Product
      • By Application
      • By End-User
    • Market Attractiveness Analysis
      • By Country
      • By Product
      • By Application
      • By End-User
    • Key Takeaways
  12. Western Europe Market Analysis 2020 to 2024 and Forecast 2025 to 2035, By Country
    • Historical Market Size Value (USD Million) & Volume (Million Units) Trend Analysis By Market Taxonomy, 2020 to 2024
    • Market Size Value (USD Million) & Volume (Million Units) Forecast By Market Taxonomy, 2025 to 2035
      • By Country
        • Germany
        • Italy
        • France
        • UK
        • Spain
        • BENELUX
        • Nordic
        • Rest of W.Europe
      • By Product
      • By Application
      • By End-User
    • Market Attractiveness Analysis
      • By Country
      • By Product
      • By Application
      • By End-User
    • Key Takeaways
  13. Eastern Europe Market Analysis 2020 to 2024 and Forecast 2025 to 2035, By Country
    • Historical Market Size Value (USD Million) & Volume (Million Units) Trend Analysis By Market Taxonomy, 2020 to 2024
    • Market Size Value (USD Million) & Volume (Million Units) Forecast By Market Taxonomy, 2025 to 2035
      • By Country
        • Russia
        • Hungary
        • Poland
        • Balkan & Baltics
        • Rest of E. Europe
      • By Product
      • By Application
      • By End-User
    • Market Attractiveness Analysis
      • By Country
      • By Product
      • By Application
      • By End-User
    • Key Takeaways
  14. East Asia Market Analysis 2020 to 2024 and Forecast 2025 to 2035, By Country
    • Historical Market Size Value (USD Million) & Volume (Million Units) Trend Analysis By Market Taxonomy, 2020 to 2024
    • Market Size Value (USD Million) & Volume (Million Units) Forecast By Market Taxonomy, 2025 to 2035
      • By Country
        • China
        • Japan
        • South Korea
      • By Product
      • By Application
      • By End-User
    • Market Attractiveness Analysis
      • By Country
      • By Product
      • By Application
      • By End-User
    • Key Takeaways
  15. South Asia & Pacific Market Analysis 2020 to 2024 and Forecast 2025 to 2035, By Country
    • Historical Market Size Value (USD Million) & Volume (Million Units) Trend Analysis By Market Taxonomy, 2020 to 2024
    • Market Size Value (USD Million) & Volume (Million Units) Forecast By Market Taxonomy, 2025 to 2035
      • By Country
        • India
        • Australia & New Zealand
        • ASEAN
        • Rest of SAP
      • By Product
      • By Application
      • By End-User
    • Market Attractiveness Analysis
      • By Country
      • By Product
      • By Application
      • By End-User
    • Key Takeaways
  16. Middle East and Africa Market Analysis 2020 to 2024 and Forecast 2025 to 2035, By Country
    • Historical Market Size Value (USD Million) & Volume (Million Units) Trend Analysis By Market Taxonomy, 2020 to 2024
    • Market Size Value (USD Million) & Volume (Million Units) Forecast By Market Taxonomy, 2025 to 2035
      • By Country
        • GCC Countries
        • Northern Africa
        • South Africa
        • Turkiye
        • Rest of MEA
      • By Product
      • By Application
      • By End-User
    • Market Attractiveness Analysis
      • By Country
      • By Product
      • By Application
      • By End-User
    • Key Takeaways
  17. Key Countries Market Analysis
    • USA
      • Pricing Analysis
      • Market Share Analysis, 2024
        • By Product
        • By Application
        • By End-User
    • Canada
      • Pricing Analysis
      • Market Share Analysis, 2024
        • By Product
        • By Application
        • By End-User
    • Brazil
      • Pricing Analysis
      • Market Share Analysis, 2024
        • By Product
        • By Application
        • By End-User
    • Mexico
      • Pricing Analysis
      • Market Share Analysis, 2024
        • By Product
        • By Application
        • By End-User
    • Argentina
      • Pricing Analysis
      • Market Share Analysis, 2024
        • By Product
        • By Application
        • By End-User
  18. Market Structure Analysis
    • Competition Dashboard
    • Competition Benchmarking
    • Market Share Analysis of Top Players
      • By Regional
      • By Product
      • By Application
      • By End-User
  19. Competition Analysis
    • Competition Deep Dive
      • IonClinics
        • Overview
        • Product Portfolio
        • Profitability by Market Segments (Product/Age /Sales Channel/Region)
        • Sales Footprint
        • Strategy Overview
          • Marketing Strategy
          • Product Strategy
          • Channel Strategy
      • Vertis Neurosciences
        • Overview
        • Product Portfolio
        • Profitability by Market Segments (Product/Age /Sales Channel/Region)
        • Sales Footprint
        • Strategy Overview
          • Marketing Strategy
          • Product Strategy
          • Channel Strategy
      • Biowave Corp.
        • Overview
        • Product Portfolio
        • Profitability by Market Segments (Product/Age /Sales Channel/Region)
        • Sales Footprint
        • Strategy Overview
          • Marketing Strategy
          • Product Strategy
          • Channel Strategy
      • SPR Therapeutics, Inc.
        • Overview
        • Product Portfolio
        • Profitability by Market Segments (Product/Age /Sales Channel/Region)
        • Sales Footprint
        • Strategy Overview
          • Marketing Strategy
          • Product Strategy
          • Channel Strategy
      • DyAnsys, Inc.
        • Overview
        • Product Portfolio
        • Profitability by Market Segments (Product/Age /Sales Channel/Region)
        • Sales Footprint
        • Strategy Overview
          • Marketing Strategy
          • Product Strategy
          • Channel Strategy
  20. Assumptions & Acronyms Used
  21. Research Methodology

List of Tables

  • Table 1: Global Market Value (USD Million) Forecast by Region, 2020 to 2035
  • Table 2: Global Market Volume (Million Units) Forecast by Region, 2020 to 2035
  • Table 3: Global Market Value (USD Million) Forecast by Product, 2020 to 2035
  • Table 4: Global Market Volume (Million Units) Forecast by Product, 2020 to 2035
  • Table 5: Global Market Value (USD Million) Forecast by Application, 2020 to 2035
  • Table 6: Global Market Volume (Million Units) Forecast by Application, 2020 to 2035
  • Table 7: Global Market Value (USD Million) Forecast by End-User, 2020 to 2035
  • Table 8: Global Market Volume (Million Units) Forecast by End-User, 2020 to 2035
  • Table 9: North America Market Value (USD Million) Forecast by Country, 2020 to 2035
  • Table 10: North America Market Volume (Million Units) Forecast by Country, 2020 to 2035
  • Table 11: North America Market Value (USD Million) Forecast by Product, 2020 to 2035
  • Table 12: North America Market Volume (Million Units) Forecast by Product, 2020 to 2035
  • Table 13: North America Market Value (USD Million) Forecast by Application, 2020 to 2035
  • Table 14: North America Market Volume (Million Units) Forecast by Application, 2020 to 2035
  • Table 15: North America Market Value (USD Million) Forecast by End-User, 2020 to 2035
  • Table 16: North America Market Volume (Million Units) Forecast by End-User, 2020 to 2035
  • Table 17: Latin America Market Value (USD Million) Forecast by Country, 2020 to 2035
  • Table 18: Latin America Market Volume (Million Units) Forecast by Country, 2020 to 2035
  • Table 19: Latin America Market Value (USD Million) Forecast by Product, 2020 to 2035
  • Table 20: Latin America Market Volume (Million Units) Forecast by Product, 2020 to 2035
  • Table 21: Latin America Market Value (USD Million) Forecast by Application, 2020 to 2035
  • Table 22: Latin America Market Volume (Million Units) Forecast by Application, 2020 to 2035
  • Table 23: Latin America Market Value (USD Million) Forecast by End-User, 2020 to 2035
  • Table 24: Latin America Market Volume (Million Units) Forecast by End-User, 2020 to 2035
  • Table 25: Western Europe Market Value (USD Million) Forecast by Country, 2020 to 2035
  • Table 26: Western Europe Market Volume (Million Units) Forecast by Country, 2020 to 2035
  • Table 27: Western Europe Market Value (USD Million) Forecast by Product, 2020 to 2035
  • Table 28: Western Europe Market Volume (Million Units) Forecast by Product, 2020 to 2035
  • Table 29: Western Europe Market Value (USD Million) Forecast by Application, 2020 to 2035
  • Table 30: Western Europe Market Volume (Million Units) Forecast by Application, 2020 to 2035
  • Table 31: Western Europe Market Value (USD Million) Forecast by End-User, 2020 to 2035
  • Table 32: Western Europe Market Volume (Million Units) Forecast by End-User, 2020 to 2035
  • Table 33: Eastern Europe Market Value (USD Million) Forecast by Country, 2020 to 2035
  • Table 34: Eastern Europe Market Volume (Million Units) Forecast by Country, 2020 to 2035
  • Table 35: Eastern Europe Market Value (USD Million) Forecast by Product, 2020 to 2035
  • Table 36: Eastern Europe Market Volume (Million Units) Forecast by Product, 2020 to 2035
  • Table 37: Eastern Europe Market Value (USD Million) Forecast by Application, 2020 to 2035
  • Table 38: Eastern Europe Market Volume (Million Units) Forecast by Application, 2020 to 2035
  • Table 39: Eastern Europe Market Value (USD Million) Forecast by End-User, 2020 to 2035
  • Table 40: Eastern Europe Market Volume (Million Units) Forecast by End-User, 2020 to 2035
  • Table 41: East Asia Market Value (USD Million) Forecast by Country, 2020 to 2035
  • Table 42: East Asia Market Volume (Million Units) Forecast by Country, 2020 to 2035
  • Table 43: East Asia Market Value (USD Million) Forecast by Product, 2020 to 2035
  • Table 44: East Asia Market Volume (Million Units) Forecast by Product, 2020 to 2035
  • Table 45: East Asia Market Value (USD Million) Forecast by Application, 2020 to 2035
  • Table 46: East Asia Market Volume (Million Units) Forecast by Application, 2020 to 2035
  • Table 47: East Asia Market Value (USD Million) Forecast by End-User, 2020 to 2035
  • Table 48: East Asia Market Volume (Million Units) Forecast by End-User, 2020 to 2035
  • Table 49: South Asia & Pacific Market Value (USD Million) Forecast by Country, 2020 to 2035
  • Table 50: South Asia & Pacific Market Volume (Million Units) Forecast by Country, 2020 to 2035
  • Table 51: South Asia & Pacific Market Value (USD Million) Forecast by Product, 2020 to 2035
  • Table 52: South Asia & Pacific Market Volume (Million Units) Forecast by Product, 2020 to 2035
  • Table 53: South Asia & Pacific Market Value (USD Million) Forecast by Application, 2020 to 2035
  • Table 54: South Asia & Pacific Market Volume (Million Units) Forecast by Application, 2020 to 2035
  • Table 55: South Asia & Pacific Market Value (USD Million) Forecast by End-User, 2020 to 2035
  • Table 56: South Asia & Pacific Market Volume (Million Units) Forecast by End-User, 2020 to 2035
  • Table 57: Middle East and Africa Market Value (USD Million) Forecast by Country, 2020 to 2035
  • Table 58: Middle East and Africa Market Volume (Million Units) Forecast by Country, 2020 to 2035
  • Table 59: Middle East and Africa Market Value (USD Million) Forecast by Product, 2020 to 2035
  • Table 60: Middle East and Africa Market Volume (Million Units) Forecast by Product, 2020 to 2035
  • Table 61: Middle East and Africa Market Value (USD Million) Forecast by Application, 2020 to 2035
  • Table 62: Middle East and Africa Market Volume (Million Units) Forecast by Application, 2020 to 2035
  • Table 63: Middle East and Africa Market Value (USD Million) Forecast by End-User, 2020 to 2035
  • Table 64: Middle East and Africa Market Volume (Million Units) Forecast by End-User, 2020 to 2035

List of Figures

  • Figure 1: Global Market Volume (Million Units) Forecast 2020 to 2035
  • Figure 2: Global Market Pricing Analysis
  • Figure 3: Global Market Value (USD Million) Forecast 2020 to 2035
  • Figure 4: Global Market Value Share and BPS Analysis by Product, 2025 and 2035
  • Figure 5: Global Market Y-o-Y Growth Comparison by Product, 2025 to 2035
  • Figure 6: Global Market Attractiveness Analysis by Product
  • Figure 7: Global Market Value Share and BPS Analysis by Application, 2025 and 2035
  • Figure 8: Global Market Y-o-Y Growth Comparison by Application, 2025 to 2035
  • Figure 9: Global Market Attractiveness Analysis by Application
  • Figure 10: Global Market Value Share and BPS Analysis by End-User, 2025 and 2035
  • Figure 11: Global Market Y-o-Y Growth Comparison by End-User, 2025 to 2035
  • Figure 12: Global Market Attractiveness Analysis by End-User
  • Figure 13: Global Market Value (USD Million) Share and BPS Analysis by Region, 2025 and 2035
  • Figure 14: Global Market Y-o-Y Growth Comparison by Region, 2025 to 2035
  • Figure 15: Global Market Attractiveness Analysis by Region
  • Figure 16: North America Market Incremental $ Opportunity, 2025 to 2035
  • Figure 17: Latin America Market Incremental $ Opportunity, 2025 to 2035
  • Figure 18: Western Europe Market Incremental $ Opportunity, 2025 to 2035
  • Figure 19: Eastern Europe Market Incremental $ Opportunity, 2025 to 2035
  • Figure 20: East Asia Market Incremental $ Opportunity, 2025 to 2035
  • Figure 21: South Asia & Pacific Market Incremental $ Opportunity, 2025 to 2035
  • Figure 22: Middle East and Africa Market Incremental $ Opportunity, 2025 to 2035
  • Figure 23: North America Market Value Share and BPS Analysis by Country, 2025 and 2035
  • Figure 24: North America Market Value Share and BPS Analysis by Product, 2025 and 2035
  • Figure 25: North America Market Y-o-Y Growth Comparison by Product, 2025 to 2035
  • Figure 26: North America Market Attractiveness Analysis by Product
  • Figure 27: North America Market Value Share and BPS Analysis by Application, 2025 and 2035
  • Figure 28: North America Market Y-o-Y Growth Comparison by Application, 2025 to 2035
  • Figure 29: North America Market Attractiveness Analysis by Application
  • Figure 30: North America Market Value Share and BPS Analysis by End-User, 2025 and 2035
  • Figure 31: North America Market Y-o-Y Growth Comparison by End-User, 2025 to 2035
  • Figure 32: North America Market Attractiveness Analysis by End-User
  • Figure 33: Latin America Market Value Share and BPS Analysis by Country, 2025 and 2035
  • Figure 34: Latin America Market Value Share and BPS Analysis by Product, 2025 and 2035
  • Figure 35: Latin America Market Y-o-Y Growth Comparison by Product, 2025 to 2035
  • Figure 36: Latin America Market Attractiveness Analysis by Product
  • Figure 37: Latin America Market Value Share and BPS Analysis by Application, 2025 and 2035
  • Figure 38: Latin America Market Y-o-Y Growth Comparison by Application, 2025 to 2035
  • Figure 39: Latin America Market Attractiveness Analysis by Application
  • Figure 40: Latin America Market Value Share and BPS Analysis by End-User, 2025 and 2035
  • Figure 41: Latin America Market Y-o-Y Growth Comparison by End-User, 2025 to 2035
  • Figure 42: Latin America Market Attractiveness Analysis by End-User
  • Figure 43: Western Europe Market Value Share and BPS Analysis by Country, 2025 and 2035
  • Figure 44: Western Europe Market Value Share and BPS Analysis by Product, 2025 and 2035
  • Figure 45: Western Europe Market Y-o-Y Growth Comparison by Product, 2025 to 2035
  • Figure 46: Western Europe Market Attractiveness Analysis by Product
  • Figure 47: Western Europe Market Value Share and BPS Analysis by Application, 2025 and 2035
  • Figure 48: Western Europe Market Y-o-Y Growth Comparison by Application, 2025 to 2035
  • Figure 49: Western Europe Market Attractiveness Analysis by Application
  • Figure 50: Western Europe Market Value Share and BPS Analysis by End-User, 2025 and 2035
  • Figure 51: Western Europe Market Y-o-Y Growth Comparison by End-User, 2025 to 2035
  • Figure 52: Western Europe Market Attractiveness Analysis by End-User
  • Figure 53: Eastern Europe Market Value Share and BPS Analysis by Country, 2025 and 2035
  • Figure 54: Eastern Europe Market Value Share and BPS Analysis by Product, 2025 and 2035
  • Figure 55: Eastern Europe Market Y-o-Y Growth Comparison by Product, 2025 to 2035
  • Figure 56: Eastern Europe Market Attractiveness Analysis by Product
  • Figure 57: Eastern Europe Market Value Share and BPS Analysis by Application, 2025 and 2035
  • Figure 58: Eastern Europe Market Y-o-Y Growth Comparison by Application, 2025 to 2035
  • Figure 59: Eastern Europe Market Attractiveness Analysis by Application
  • Figure 60: Eastern Europe Market Value Share and BPS Analysis by End-User, 2025 and 2035
  • Figure 61: Eastern Europe Market Y-o-Y Growth Comparison by End-User, 2025 to 2035
  • Figure 62: Eastern Europe Market Attractiveness Analysis by End-User
  • Figure 63: East Asia Market Value Share and BPS Analysis by Country, 2025 and 2035
  • Figure 64: East Asia Market Value Share and BPS Analysis by Product, 2025 and 2035
  • Figure 65: East Asia Market Y-o-Y Growth Comparison by Product, 2025 to 2035
  • Figure 66: East Asia Market Attractiveness Analysis by Product
  • Figure 67: East Asia Market Value Share and BPS Analysis by Application, 2025 and 2035
  • Figure 68: East Asia Market Y-o-Y Growth Comparison by Application, 2025 to 2035
  • Figure 69: East Asia Market Attractiveness Analysis by Application
  • Figure 70: East Asia Market Value Share and BPS Analysis by End-User, 2025 and 2035
  • Figure 71: East Asia Market Y-o-Y Growth Comparison by End-User, 2025 to 2035
  • Figure 72: East Asia Market Attractiveness Analysis by End-User
  • Figure 73: South Asia & Pacific Market Value Share and BPS Analysis by Country, 2025 and 2035
  • Figure 74: South Asia & Pacific Market Value Share and BPS Analysis by Product, 2025 and 2035
  • Figure 75: South Asia & Pacific Market Y-o-Y Growth Comparison by Product, 2025 to 2035
  • Figure 76: South Asia & Pacific Market Attractiveness Analysis by Product
  • Figure 77: South Asia & Pacific Market Value Share and BPS Analysis by Application, 2025 and 2035
  • Figure 78: South Asia & Pacific Market Y-o-Y Growth Comparison by Application, 2025 to 2035
  • Figure 79: South Asia & Pacific Market Attractiveness Analysis by Application
  • Figure 80: South Asia & Pacific Market Value Share and BPS Analysis by End-User, 2025 and 2035
  • Figure 81: South Asia & Pacific Market Y-o-Y Growth Comparison by End-User, 2025 to 2035
  • Figure 82: South Asia & Pacific Market Attractiveness Analysis by End-User
  • Figure 83: Middle East and Africa Market Value Share and BPS Analysis by Country, 2025 and 2035
  • Figure 84: Middle East and Africa Market Value Share and BPS Analysis by Product, 2025 and 2035
  • Figure 85: Middle East and Africa Market Y-o-Y Growth Comparison by Product, 2025 to 2035
  • Figure 86: Middle East and Africa Market Attractiveness Analysis by Product
  • Figure 87: Middle East and Africa Market Value Share and BPS Analysis by Application, 2025 and 2035
  • Figure 88: Middle East and Africa Market Y-o-Y Growth Comparison by Application, 2025 to 2035
  • Figure 89: Middle East and Africa Market Attractiveness Analysis by Application
  • Figure 90: Middle East and Africa Market Value Share and BPS Analysis by End-User, 2025 and 2035
  • Figure 91: Middle East and Africa Market Y-o-Y Growth Comparison by End-User, 2025 to 2035
  • Figure 92: Middle East and Africa Market Attractiveness Analysis by End-User
  • Figure 93: Global Market - Tier Structure Analysis
  • Figure 94: Global Market - Company Share Analysis

Frequently Asked Questions

What is the size of the percutaneous electrical nerve stimulators market in 2025?

The industry in 2025 is estimated to be valued at USD 311.3 million.

What is the projected value of the percutaneous electrical nerve stimulators market in 2035 and its CAGR?

The industry in 2035 is projected to reach USD 547 million, with a CAGR of 5.8%.

What is the leading segment in the percutaneous electrical nerve stimulators market?

Chronic musculoskeletal pain dominates the application segment with a 32% industry share.

Which country will lead the percutaneous electrical nerve stimulators market?

India will lead industry with a 10.1% CAGR from 2025 to 2035.

Who is the leading company in the percutaneous electrical nerve stimulators market?

SPR Therapeutics, Inc. is the leading company in the industry with a 35% industry share.

Explore Similar Insights

Future Market Insights

Percutaneous Electrical Nerve Stimulators Market