Reports

- Global Locations -

Headquarters

Future Market Insights, Inc.

Christiana Corporate, 200
Continental Drive, Suite 401,
Newark, Delaware - 19713,
United States

T: +1-845-579-5705

Americas

Future Market Insights, Inc.

616 Corporate Way, Suite 2-9018,
Valley Cottage, NY 10989, United States

T: +1-347-918-3531

MEA

Future Market Insights

1602-6 Jumeirah Bay X2 Tower, Plot No: JLT-PH2-X2A,
Jumeirah Lakes Towers, Dubai,
United Arab Emirates

Europe

Future Market Insights

3rd Floor, 207 Regent Street,
W1B 3HH London
United Kingdom

T: + 44 (0) 20 8123 9659
D: +44 (0) 20 3287 4268

Asia Pacific

Future Market Insights

IndiaLand Global Tech Park, Unit UG-1, Behind Grand HighStreet, Phase 1, Hinjawadi, MH, Pune – 411057, India

Rib Fracture Repair Systems Market Snapshot (2022 to 2032)

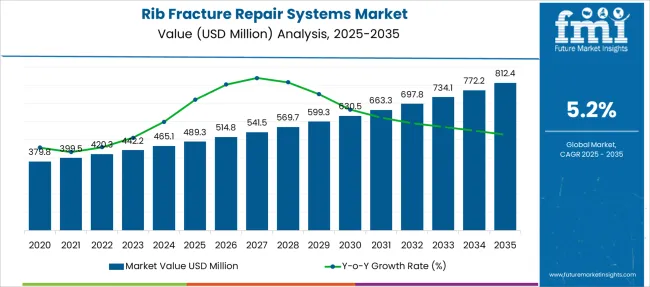
Global Rib Fracture Repair Systems demand is anticipated to be valued at US$ 420.3 Million in 2022, forecast to grow at a CAGR of 5.2% to be valued at US$ 699.5 Million from 2022 to 2032. Growth is attributed to the human vulnerability to rib fractures and injuries.

Report Attribute Details
Estimated Base Year Value (2021) US$ 400.0 Million
Expected Market Value (2022) US$ 420.3 Million
Anticipated Forecast Value (2032) US$ 699.5 Million
Projected Growth Rate (2022 to 2032) 5.2% CAGR

Rib Fracture Repair Systems are implants and devices, that are designed to support the reconstruction of a fractured rib. The devices are primarily made up of titanium alloys and stainless steel coated by the polymer. The novel type of core internal fixation implants and devices will escalate the growth opportunities for the rib fracture repair system market.

Rib Fracture Repair Systems is one of the prime comprehensive thoracic care systems. The repair system integrates locking screws and plates. The plates offer an advantage in intraoperative bleeding offering surgeons an advantage for surgery.

Other major factors like the human vulnerability to rib fractures and injuries, and an unbalanced food diet, coupled with the increase in the geriatric population are likely to boost the market growth during the forecast period.

On the flip side, the stringent regulatory guidelines for the approval of new treatments are further projected to impede the growth of the rib fracture treatment market in the timeline period.

Don't pay for what you don't need

Customize your report by selecting specific countries or regions and save 30%!

Which are Some Prominent Drivers Spearheading Rib Fracture Repair Systems Market Growth?

The increasing number of hard falls, accidental cases, domestic issues, and other types of violence are the major factors that are expected to fuel the growth of the Rib Fracture Repair Systems market over the forecast period.

The rise in cases of low bone density and the growing amount of excessive playing of contact sports including football and rugby are further anticipated to accelerate the growth of the rib fracture treatment market in the forthcoming years.

The human vulnerability to rib fractures and injuries, and an unbalanced food diet, coupled with the increase in the geriatric population are the major factors that are likely to boost the market growth during the forecast period.

Factors such as the rising cases of osteoporosis and arthritis, the rise in the healthcare infrastructure, and the growth of the aging population due to the natural phenomenon of aging leading to fragile bone structures are expected to augment the market growth over the analysis period.

What are the Challenges Faced by the Rib Fracture Repair Systems Industry?

Factors such as the high rate of invasion associated with Rib Fracture Repair Systems and long surgical procedures are expected to hinder the growth of the Rib Fracture Repair Systems market during the forecast period.

Unsuitable reimbursement policies, and the increased expenses of surgeries, and therapy are the major factors that are anticipated to impede market growth in the near future.

The stringent regulatory guidelines for the approval of new treatments are further projected to hamper the growth of the rib fracture treatment market over the analysis period.
Sabyasachi Ghosh
Sabyasachi Ghosh

Principal Consultant

Talk to Analyst

Find your sweet spots for generating winning opportunities in this market.

Why is North America Emerging as an Opportunistic Rib Fracture Repair Systems Market?

North America dominates the rib fracture treatment market, attributed to the high demand for rib fracture treatment for treating trauma cases and sports-related injuries. In addition, the growing healthcare infrastructure is further expected to propel the growth of the rib fracture treatment market in the region over the analysis period.

The increasing number of casualties from motor accidents is one of the major factors that is anticipated to augment the market growth in the region in the forthcoming years.

The Rib Fracture Repair Systems market in North America is expected to hold the largest share of US$ 330.3 Million. Considering the revenue generation, the regional market is expected to reach a CAGR of 5.15% during the forecast period.

How is Asia-Pacific Contributing to Growth of the Rib Fracture Repair Systems Market?

The Asia-Pacific rib fracture repair systems market is expected to reach a CAGR of 4.6% with a market value of US$ 250.9 Million. The rib fracture repair systems market in Asia-Pacific is expected to observe a significant amount of growth in the rib fracture treatment market during the forecast period, attributed to the growing incidence of rib fracture cases in the region.

The constant rise in the population in Asia Pacific countries including China and India is one of the major factors that is anticipated to boost the regional growth of rib fracture repair systems over the analysis period.
Get the data you need at a Fraction of the cost

Personalize your report by choosing insights you need
and save 40%!

Market Competition

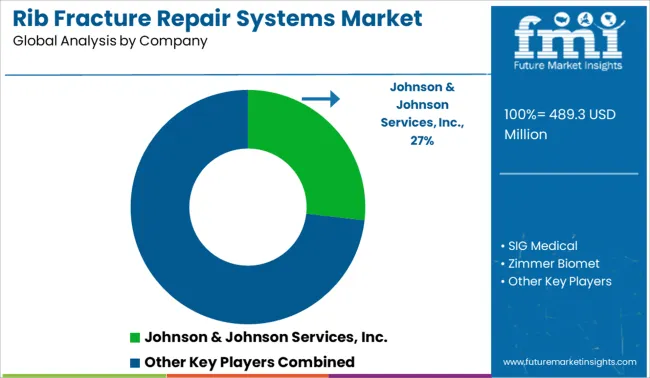
Some of the key participants present in the global Rib Fracture Repair Systems market include DePuy Synthes, SIG Medical, Zimmer Biomet, Acumed, LLC, Novartis AG, Sun Pharmaceutical Industries Ltd., Larken Laboratories, Teva Pharmaceutical Industries Ltd., Cipher Pharmaceuticals Inc., Mylan N.V., Purdue Pharma L.P., Allergan plc., USWM, LLC., GlaxoSmithKline plc., and Pfizer Inc., among others.

Attributed to the presence of such a high number of participants, the market is highly competitive. While global players such as DePuy Synthes, SIG Medical, Zimmer Biomet, Acumed, LLC, and Novartis AG, account for a considerable market size, several regional-level players are also operating across key growth regions, particularly in North America.

Recent Developments:

  • In 2021, Johnson & Johnson’s subsidiary company DePuy Synthes announced the launch of a 2.7mm variable angle locking compression plate. This plate is used in the lateral, shaft, and medical fractures of clavicles.
  • In 2019, Smith & Nephew announced the launch of CONQUEST FN. This product is used in femoral neck fracture treatment.

Report Scope

Report Attribute Details
Growth Rate CAGR of 5.2% from 2022 to 2032
Market Value in 2022 US$ 420.3 Million
Market Value in 2032 US$ 699.5 Million
Base Year for Estimation 2021
Historical Data 2017 to 2021
Forecast Period 2022 to 2032
Quantitative Units Revenue in USD Million and CAGR from 2022 to 2032
Report Coverage Revenue Forecast, Volume Forecast, Company Ranking, Competitive Landscape, Growth Factors, Trends, and Pricing Analysis
Segments Covered
  • Product Type
  • End User
  • Region
Regional Scope
  • North America
  • Latin America
  • Europe
  • Asia Pacific
  • Middle East and Africa
Country Scope
  • USA
  • Canada
  • Brazil
  • Mexico
  • Germany
  • United Kingdom
  • France
  • Spain
  • Italy
  • China
  • Japan
  • South Korea
  • Malaysia
  • Singapore
  • Australia
  • GCC Countries
  • South Africa
  • Israel
Key Companies Profiled
  • Johnson & Johnson Services Inc. (DePuy Synthes)
  • SIG Medical
  • Zimmer Biomet
  • Acumed LLC
  • Jeil Medical Corporation
  • Waston Medical Co. Ltd.
  • NEURO FRANCE Implants
  • KLS Martin Group
  • Stryker Corporation
  • Olympus Corporation
Report Customization & Pricing Available upon Request

Key Segments Profiled in the Rib Fracture Repair Systems Industry Survey

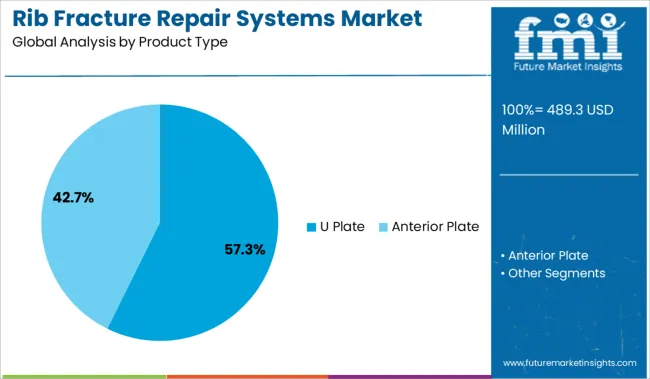
By Product Type:

  • U Plate
  • Anterior Plate

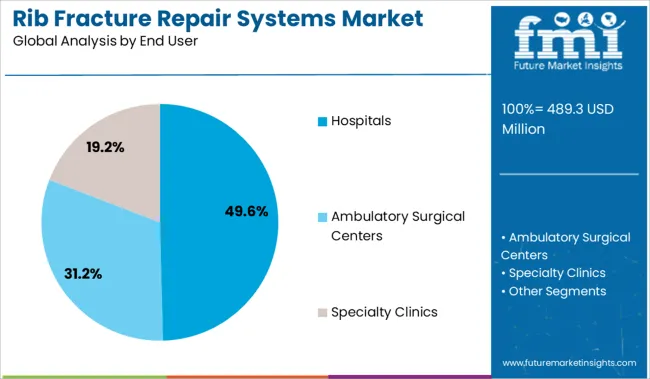
By End User:

  • Hospitals
  • Ambulatory Surgical Centers
  • Specialty Clinics

By Region:

  • North America
  • Latin America
  • Europe Rib
  • Asia Pacific
  • Middle East & Africa

Frequently Asked Questions

What is the anticipated growth of the Rib Fracture Repair Systems market until 2032?

FMI projects the global Rib Fracture Repair Systems market to expand at a 5.2% value CAGR by 2032

Which region is forecast to be the most lucrative for Rib Fracture Repair Systems market growth?

North America is expected to be the most opportunistic Rib Fracture Repair Systems market, expanding at 5.15% CAGR

Which are some prominent Rib Fracture Repair Systems manufacturers?

DePuy Synthes, SIG Medical, Zimmer Biomet, Acumed, LLC, Novartis AG, Sun Pharmaceutical Industries Ltd., Larken Laboratories, and Teva Pharmaceutical Industries Ltd., are some prominent Rib Fracture Repair Systems manufacturers

Table of Content

1. Executive Summary | Rib Fracture Repair Systems Market

    1.1. Global Market Outlook

    1.2. Demand-side Trends

    1.3. Supply-side Trends

    1.4. Technology Roadmap Analysis

    1.5. Analysis and Recommendations

2. Market Overview

    2.1. Market Coverage / Taxonomy

    2.2. Market Definition / Scope / Limitations

3. Market Background

    3.1. Market Dynamics

        3.1.1. Drivers

        3.1.2. Restraints

        3.1.3. Opportunity

        3.1.4. Trends

    3.2. Scenario Forecast

        3.2.1. Demand in Optimistic Scenario

        3.2.2. Demand in Likely Scenario

        3.2.3. Demand in Conservative Scenario

    3.3. Opportunity Map Analysis

    3.4. Investment Feasibility Matrix

    3.5. PESTLE and Porter’s Analysis

    3.6. Regulatory Landscape

        3.6.1. By Key Regions

        3.6.2. By Key Countries

    3.7. Regional Parent Market Outlook

4. Global Market Analysis 2017 to 2021 and Forecast, 2022 to 2032

    4.1. Historical Market Size Value (US$ Million) Analysis, 2017 to 2021

    4.2. Current and Future Market Size Value (US$ Million) Projections, 2022 to 2032

        4.2.1. Y-o-Y Growth Trend Analysis

        4.2.2. Absolute $ Opportunity Analysis

5. Global Market Analysis 2017 to 2021 and Forecast 2022 to 2032, By Product Type

    5.1. Introduction / Key Findings

    5.2. Historical Market Size Value (US$ Million) Analysis By Product Type, 2017 to 2021

    5.3. Current and Future Market Size Value (US$ Million) Analysis and Forecast By Product Type, 2022 to 2032

        5.3.1. U Plate Rib Fracture Repair Systems

        5.3.2. Anterior Plate Rib Fracture Repair Systems

    5.4. Y-o-Y Growth Trend Analysis By Product Type, 2017 to 2021

    5.5. Absolute $ Opportunity Analysis By Product Type, 2022 to 2032

6. Global Market Analysis 2017 to 2021 and Forecast 2022 to 2032, By End User

    6.1. Introduction / Key Findings

    6.2. Historical Market Size Value (US$ Million) Analysis By End User, 2017 to 2021

    6.3. Current and Future Market Size Value (US$ Million) Analysis and Forecast By End User, 2022 to 2032

        6.3.1. Hospitals

        6.3.2. Ambulatory Surgical Centers

        6.3.3. Specialty Clinics

    6.4. Y-o-Y Growth Trend Analysis By End User, 2017 to 2021

    6.5. Absolute $ Opportunity Analysis By End User, 2022 to 2032

7. Global Market Analysis 2017 to 2021 and Forecast 2022 to 2032, By Region

    7.1. Introduction

    7.2. Historical Market Size Value (US$ Million) Analysis By Region, 2017 to 2021

    7.3. Current Market Size Value (US$ Million) Analysis and Forecast By Region, 2022 to 2032

        7.3.1. North America

        7.3.2. Latin America

        7.3.3. Europe

        7.3.4. Asia Pacific

        7.3.5. Middle East and Africa

    7.4. Market Attractiveness Analysis By Region

8. North America Market Analysis 2017 to 2021 and Forecast 2022 to 2032, By Country

    8.1. Historical Market Size Value (US$ Million) Trend Analysis By Market Taxonomy, 2017 to 2021

    8.2. Market Size Value (US$ Million) Forecast By Market Taxonomy, 2022 to 2032

        8.2.1. By Country

            8.2.1.1. United Kingdom

            8.2.1.2. Canada

        8.2.2. By Product Type

        8.2.3. By End User

    8.3. Market Attractiveness Analysis

        8.3.1. By Country

        8.3.2. By Product Type

        8.3.3. By End User

    8.4. Key Takeaways

9. Latin America Market Analysis 2017 to 2021 and Forecast 2022 to 2032, By Country

    9.1. Historical Market Size Value (US$ Million) Trend Analysis By Market Taxonomy, 2017 to 2021

    9.2. Market Size Value (US$ Million) Forecast By Market Taxonomy, 2022 to 2032

        9.2.1. By Country

            9.2.1.1. Brazil

            9.2.1.2. Mexico

            9.2.1.3. Rest of Latin America

        9.2.2. By Product Type

        9.2.3. By End User

    9.3. Market Attractiveness Analysis

        9.3.1. By Country

        9.3.2. By Product Type

        9.3.3. By End User

    9.4. Key Takeaways

10. Europe Market Analysis 2017 to 2021 and Forecast 2022 to 2032, By Country

    10.1. Historical Market Size Value (US$ Million) Trend Analysis By Market Taxonomy, 2017 to 2021

    10.2. Market Size Value (US$ Million) Forecast By Market Taxonomy, 2022 to 2032

        10.2.1. By Country

            10.2.1.1. Germany

            10.2.1.2. United Kingdom

            10.2.1.3. France

            10.2.1.4. Spain

            10.2.1.5. Italy

            10.2.1.6. Rest of Europe

        10.2.2. By Product Type

        10.2.3. By End User

    10.3. Market Attractiveness Analysis

        10.3.1. By Country

        10.3.2. By Product Type

        10.3.3. By End User

    10.4. Key Takeaways

11. Asia Pacific Market Analysis 2017 to 2021 and Forecast 2022 to 2032, By Country

    11.1. Historical Market Size Value (US$ Million) Trend Analysis By Market Taxonomy, 2017 to 2021

    11.2. Market Size Value (US$ Million) Forecast By Market Taxonomy, 2022 to 2032

        11.2.1. By Country

            11.2.1.1. China

            11.2.1.2. Japan

            11.2.1.3. South Korea

            11.2.1.4. Malaysia

            11.2.1.5. Singapore

            11.2.1.6. Australia

            11.2.1.7. Rest of Asia Pacific

        11.2.2. By Product Type

        11.2.3. By End User

    11.3. Market Attractiveness Analysis

        11.3.1. By Country

        11.3.2. By Product Type

        11.3.3. By End User

    11.4. Key Takeaways

12. Middle East and Africa Market Analysis 2017 to 2021 and Forecast 2022 to 2032, By Country

    12.1. Historical Market Size Value (US$ Million) Trend Analysis By Market Taxonomy, 2017 to 2021

    12.2. Market Size Value (US$ Million) Forecast By Market Taxonomy, 2022 to 2032

        12.2.1. By Country

            12.2.1.1. GCC Countries

            12.2.1.2. South Africa

            12.2.1.3. Israel

            12.2.1.4. Rest of Middle East and Africa

        12.2.2. By Product Type

        12.2.3. By End User

    12.3. Market Attractiveness Analysis

        12.3.1. By Country

        12.3.2. By Product Type

        12.3.3. By End User

    12.4. Key Takeaways

13. Key Countries Market Analysis

    13.1. United Kingdom

        13.1.1. Pricing Analysis

        13.1.2. Market Share Analysis, 2021

            13.1.2.1. By Product Type

            13.1.2.2. By End User

    13.2. Canada

        13.2.1. Pricing Analysis

        13.2.2. Market Share Analysis, 2021

            13.2.2.1. By Product Type

            13.2.2.2. By End User

    13.3. Brazil

        13.3.1. Pricing Analysis

        13.3.2. Market Share Analysis, 2021

            13.3.2.1. By Product Type

            13.3.2.2. By End User

    13.4. Mexico

        13.4.1. Pricing Analysis

        13.4.2. Market Share Analysis, 2021

            13.4.2.1. By Product Type

            13.4.2.2. By End User

    13.5. Rest of Latin America

        13.5.1. Pricing Analysis

        13.5.2. Market Share Analysis, 2021

            13.5.2.1. By Product Type

            13.5.2.2. By End User

    13.6. Germany

        13.6.1. Pricing Analysis

        13.6.2. Market Share Analysis, 2021

            13.6.2.1. By Product Type

            13.6.2.2. By End User

    13.7. United Kingdom

        13.7.1. Pricing Analysis

        13.7.2. Market Share Analysis, 2021

            13.7.2.1. By Product Type

            13.7.2.2. By End User

    13.8. France

        13.8.1. Pricing Analysis

        13.8.2. Market Share Analysis, 2021

            13.8.2.1. By Product Type

            13.8.2.2. By End User

    13.9. Spain

        13.9.1. Pricing Analysis

        13.9.2. Market Share Analysis, 2021

            13.9.2.1. By Product Type

            13.9.2.2. By End User

    13.10. Italy

        13.10.1. Pricing Analysis

        13.10.2. Market Share Analysis, 2021

            13.10.2.1. By Product Type

            13.10.2.2. By End User

    13.11. Rest of Europe

        13.11.1. Pricing Analysis

        13.11.2. Market Share Analysis, 2021

            13.11.2.1. By Product Type

            13.11.2.2. By End User

    13.12. China

        13.12.1. Pricing Analysis

        13.12.2. Market Share Analysis, 2021

            13.12.2.1. By Product Type

            13.12.2.2. By End User

    13.13. Japan

        13.13.1. Pricing Analysis

        13.13.2. Market Share Analysis, 2021

            13.13.2.1. By Product Type

            13.13.2.2. By End User

    13.14. South Korea

        13.14.1. Pricing Analysis

        13.14.2. Market Share Analysis, 2021

            13.14.2.1. By Product Type

            13.14.2.2. By End User

    13.15. Malaysia

        13.15.1. Pricing Analysis

        13.15.2. Market Share Analysis, 2021

            13.15.2.1. By Product Type

            13.15.2.2. By End User

    13.16. Singapore

        13.16.1. Pricing Analysis

        13.16.2. Market Share Analysis, 2021

            13.16.2.1. By Product Type

            13.16.2.2. By End User

    13.17. Australia

        13.17.1. Pricing Analysis

        13.17.2. Market Share Analysis, 2021

            13.17.2.1. By Product Type

            13.17.2.2. By End User

    13.18. Rest of Asia Pacific

        13.18.1. Pricing Analysis

        13.18.2. Market Share Analysis, 2021

            13.18.2.1. By Product Type

            13.18.2.2. By End User

    13.19. GCC Countries

        13.19.1. Pricing Analysis

        13.19.2. Market Share Analysis, 2021

            13.19.2.1. By Product Type

            13.19.2.2. By End User

    13.20. South Africa

        13.20.1. Pricing Analysis

        13.20.2. Market Share Analysis, 2021

            13.20.2.1. By Product Type

            13.20.2.2. By End User

    13.21. Israel

        13.21.1. Pricing Analysis

        13.21.2. Market Share Analysis, 2021

            13.21.2.1. By Product Type

            13.21.2.2. By End User

    13.22. Rest of the Middle East and Africa

        13.22.1. Pricing Analysis

        13.22.2. Market Share Analysis, 2021

            13.22.2.1. By Product Type

            13.22.2.2. By End User

14. Market Structure Analysis

    14.1. Competition Dashboard

    14.2. Competition Benchmarking

    14.3. Market Share Analysis of Top Players

        14.3.1. By Regional

        14.3.2. By Product Type

        14.3.3. By End User

15. Competition Analysis

    15.1. Competition Deep Dive

        15.1.1. Johnson & Johnson Services, Inc.

            15.1.1.1. Overview

            15.1.1.2. Product Portfolio

            15.1.1.3. Profitability by Market Segments

            15.1.1.4. Sales Footprint

            15.1.1.5. Strategy Overview

                15.1.1.5.1. Marketing Strategy

        15.1.2. SIG Medical

            15.1.2.1. Overview

            15.1.2.2. Product Portfolio

            15.1.2.3. Profitability by Market Segments

            15.1.2.4. Sales Footprint

            15.1.2.5. Strategy Overview

                15.1.2.5.1. Marketing Strategy

        15.1.3. Zimmer Biomet

            15.1.3.1. Overview

            15.1.3.2. Product Portfolio

            15.1.3.3. Profitability by Market Segments

            15.1.3.4. Sales Footprint

            15.1.3.5. Strategy Overview

                15.1.3.5.1. Marketing Strategy

        15.1.4. Acumed, LLC

            15.1.4.1. Overview

            15.1.4.2. Product Portfolio

            15.1.4.3. Profitability by Market Segments

            15.1.4.4. Sales Footprint

            15.1.4.5. Strategy Overview

                15.1.4.5.1. Marketing Strategy

        15.1.5. Jeil Medical Corporation

            15.1.5.1. Overview

            15.1.5.2. Product Portfolio

            15.1.5.3. Profitability by Market Segments

            15.1.5.4. Sales Footprint

            15.1.5.5. Strategy Overview

                15.1.5.5.1. Marketing Strategy

        15.1.6. Waston Medical Co., Ltd.

            15.1.6.1. Overview

            15.1.6.2. Product Portfolio

            15.1.6.3. Profitability by Market Segments

            15.1.6.4. Sales Footprint

            15.1.6.5. Strategy Overview

                15.1.6.5.1. Marketing Strategy

        15.1.7. NEURO FRANCE Implants

            15.1.7.1. Overview

            15.1.7.2. Product Portfolio

            15.1.7.3. Profitability by Market Segments

            15.1.7.4. Sales Footprint

            15.1.7.5. Strategy Overview

                15.1.7.5.1. Marketing Strategy

        15.1.8. KLS Martin Group

            15.1.8.1. Overview

            15.1.8.2. Product Portfolio

            15.1.8.3. Profitability by Market Segments

            15.1.8.4. Sales Footprint

            15.1.8.5. Strategy Overview

                15.1.8.5.1. Marketing Strategy

        15.1.9. Stryker Corporation

            15.1.9.1. Overview

            15.1.9.2. Product Portfolio

            15.1.9.3. Profitability by Market Segments

            15.1.9.4. Sales Footprint

            15.1.9.5. Strategy Overview

                15.1.9.5.1. Marketing Strategy

        15.1.10. Olympus Corporation

            15.1.10.1. Overview

            15.1.10.2. Product Portfolio

            15.1.10.3. Profitability by Market Segments

            15.1.10.4. Sales Footprint

            15.1.10.5. Strategy Overview

                15.1.10.5.1. Marketing Strategy

16. Assumptions & Acronyms Used

17. Research Methodology

Don't pay for what you don't need

Customize your report by selecting specific countries or regions and save 30%!

List of Tables

Table 1: Global Market Value (US$ Million) Forecast by Region, 2017 to 2032

Table 2: Global Market Value (US$ Million) Forecast by Product Type, 2017 to 2032

Table 3: Global Market Value (US$ Million) Forecast by End User, 2017 to 2032

Table 4: North America Market Value (US$ Million) Forecast by Country, 2017 to 2032

Table 5: North America Market Value (US$ Million) Forecast by Product Type, 2017 to 2032

Table 6: North America Market Value (US$ Million) Forecast by End User, 2017 to 2032

Table 7: Latin America Market Value (US$ Million) Forecast by Country, 2017 to 2032

Table 8: Latin America Market Value (US$ Million) Forecast by Product Type, 2017 to 2032

Table 9: Latin America Market Value (US$ Million) Forecast by End User, 2017 to 2032

Table 10: Europe Market Value (US$ Million) Forecast by Country, 2017 to 2032

Table 11: Europe Market Value (US$ Million) Forecast by Product Type, 2017 to 2032

Table 12: Europe Market Value (US$ Million) Forecast by End User, 2017 to 2032

Table 13: Asia Pacific Market Value (US$ Million) Forecast by Country, 2017 to 2032

Table 14: Asia Pacific Market Value (US$ Million) Forecast by Product Type, 2017 to 2032

Table 15: Asia Pacific Market Value (US$ Million) Forecast by End User, 2017 to 2032

Table 16: MEA Market Value (US$ Million) Forecast by Country, 2017 to 2032

Table 17: MEA Market Value (US$ Million) Forecast by Product Type, 2017 to 2032

Table 18: MEA Market Value (US$ Million) Forecast by End User, 2017 to 2032
Sabyasachi Ghosh
Sabyasachi Ghosh

Principal Consultant

Talk to Analyst

Find your sweet spots for generating winning opportunities in this market.

List of Charts

Figure 1: Global Rib Fracture Repair Systems Market Value (US$ Million) by Product Type, 2022 to 2032

Figure 2: Global Rib Fracture Repair Systems Market Value (US$ Million) by End User, 2022 to 2032

Figure 3: Global Rib Fracture Repair Systems Market Value (US$ Million) by Region, 2022 to 2032

Figure 4: Global Rib Fracture Repair Systems Market Value (US$ Million) Analysis by Region, 2017 to 2032

Figure 5: Global Rib Fracture Repair Systems Market Value Share (%) and BPS Analysis by Region, 2022 to 2032

Figure 6: Global Rib Fracture Repair Systems Market Y-o-Y Growth (%) Projections by Region, 2022 to 2032

Figure 7: Global Rib Fracture Repair Systems Market Value (US$ Million) Analysis by Product Type, 2017 to 2032

Figure 8: Global Rib Fracture Repair Systems Market Value Share (%) and BPS Analysis by Product Type, 2022 to 2032

Figure 9: Global Rib Fracture Repair Systems Market Y-o-Y Growth (%) Projections by Product Type, 2022 to 2032

Figure 10: Global Rib Fracture Repair Systems Market Value (US$ Million) Analysis by End User, 2017 to 2032

Figure 11: Global Rib Fracture Repair Systems Market Value Share (%) and BPS Analysis by End User, 2022 to 2032

Figure 12: Global Rib Fracture Repair Systems Market Y-o-Y Growth (%) Projections by End User, 2022 to 2032

Figure 13: Global Rib Fracture Repair Systems Market Attractiveness by Product Type, 2022 to 2032

Figure 14: Global Rib Fracture Repair Systems Market Attractiveness by End User, 2022 to 2032

Figure 15: Global Rib Fracture Repair Systems Market Attractiveness by Region, 2022 to 2032

Figure 16: North America Rib Fracture Repair Systems Market Value (US$ Million) by Product Type, 2022 to 2032

Figure 17: North America Rib Fracture Repair Systems Market Value (US$ Million) by End User, 2022 to 2032

Figure 18: North America Market Value (US$ Million) by Country, 2022 to 2032

Figure 19: North America Market Value (US$ Million) Analysis by Country, 2017 to 2032

Figure 20: North America Market Value Share (%) and BPS Analysis by Country, 2022 to 2032

Figure 21: North America Market Y-o-Y Growth (%) Projections by Country, 2022 to 2032

Figure 22: North America Market Value (US$ Million) Analysis by Product Type, 2017 to 2032

Figure 23: North America Market Value Share (%) and BPS Analysis by Product Type, 2022 to 2032

Figure 24: North America Market Y-o-Y Growth (%) Projections by Product Type, 2022 to 2032

Figure 25: North America Market Value (US$ Million) Analysis by End User, 2017 to 2032

Figure 26: North America Market Value Share (%) and BPS Analysis by End User, 2022 to 2032

Figure 27: North America Market Y-o-Y Growth (%) Projections by End User, 2022 to 2032

Figure 28: North America Market Attractiveness by Product Type, 2022 to 2032

Figure 29: North America Market Attractiveness by End User, 2022 to 2032

Figure 30: North America Market Attractiveness by Country, 2022 to 2032

Figure 31: Latin America Market Value (US$ Million) by Product Type, 2022 to 2032

Figure 32: Latin America Market Value (US$ Million) by End User, 2022 to 2032

Figure 33: Latin America Market Value (US$ Million) by Country, 2022 to 2032

Figure 34: Latin America Market Value (US$ Million) Analysis by Country, 2017 to 2032

Figure 35: Latin America Market Value Share (%) and BPS Analysis by Country, 2022 to 2032

Figure 36: Latin America Market Y-o-Y Growth (%) Projections by Country, 2022 to 2032

Figure 37: Latin America Market Value (US$ Million) Analysis by Product Type, 2017 to 2032

Figure 38: Latin America Market Value Share (%) and BPS Analysis by Product Type, 2022 to 2032

Figure 39: Latin America Market Y-o-Y Growth (%) Projections by Product Type, 2022 to 2032

Figure 40: Latin America Market Value (US$ Million) Analysis by End User, 2017 to 2032

Figure 41: Latin America Market Value Share (%) and BPS Analysis by End User, 2022 to 2032

Figure 42: Latin America Market Y-o-Y Growth (%) Projections by End User, 2022 to 2032

Figure 43: Latin America Market Attractiveness by Product Type, 2022 to 2032

Figure 44: Latin America Market Attractiveness by End User, 2022 to 2032

Figure 45: Latin America Market Attractiveness by Country, 2022 to 2032

Figure 46: Europe Market Value (US$ Million) by Product Type, 2022 to 2032

Figure 47: Europe Market Value (US$ Million) by End User, 2022 to 2032

Figure 48: Europe Market Value (US$ Million) by Country, 2022 to 2032

Figure 49: Europe Market Value (US$ Million) Analysis by Country, 2017 to 2032

Figure 50: Europe Market Value Share (%) and BPS Analysis by Country, 2022 to 2032

Figure 51: Europe Market Y-o-Y Growth (%) Projections by Country, 2022 to 2032

Figure 52: Europe Market Value (US$ Million) Analysis by Product Type, 2017 to 2032

Figure 53: Europe Market Value Share (%) and BPS Analysis by Product Type, 2022 to 2032

Figure 54: Europe Market Y-o-Y Growth (%) Projections by Product Type, 2022 to 2032

Figure 55: Europe Market Value (US$ Million) Analysis by End User, 2017 to 2032

Figure 56: Europe Market Value Share (%) and BPS Analysis by End User, 2022 to 2032

Figure 57: Europe Market Y-o-Y Growth (%) Projections by End User, 2022 to 2032

Figure 58: Europe Market Attractiveness by Product Type, 2022 to 2032

Figure 59: Europe Market Attractiveness by End User, 2022 to 2032

Figure 60: Europe Market Attractiveness by Country, 2022 to 2032

Figure 61: Asia Pacific Market Value (US$ Million) by Product Type, 2022 to 2032

Figure 62: Asia Pacific Market Value (US$ Million) by End User, 2022 to 2032

Figure 63: Asia Pacific Market Value (US$ Million) by Country, 2022 to 2032

Figure 64: Asia Pacific Market Value (US$ Million) Analysis by Country, 2017 to 2032

Figure 65: Asia Pacific Market Value Share (%) and BPS Analysis by Country, 2022 to 2032

Figure 66: Asia Pacific Market Y-o-Y Growth (%) Projections by Country, 2022 to 2032

Figure 67: Asia Pacific Market Value (US$ Million) Analysis by Product Type, 2017 to 2032

Figure 68: Asia Pacific Market Value Share (%) and BPS Analysis by Product Type, 2022 to 2032

Figure 69: Asia Pacific Market Y-o-Y Growth (%) Projections by Product Type, 2022 to 2032

Figure 70: Asia Pacific Market Value (US$ Million) Analysis by End User, 2017 to 2032

Figure 71: Asia Pacific Market Value Share (%) and BPS Analysis by End User, 2022 to 2032

Figure 72: Asia Pacific Market Y-o-Y Growth (%) Projections by End User, 2022 to 2032

Figure 73: Asia Pacific Market Attractiveness by Product Type, 2022 to 2032

Figure 74: Asia Pacific Market Attractiveness by End User, 2022 to 2032

Figure 75: Asia Pacific Market Attractiveness by Country, 2022 to 2032

Figure 76: MEA Market Value (US$ Million) by Product Type, 2022 to 2032

Figure 77: MEA Market Value (US$ Million) by End User, 2022 to 2032

Figure 78: MEA Market Value (US$ Million) by Country, 2022 to 2032

Figure 79: MEA Market Value (US$ Million) Analysis by Country, 2017 to 2032

Figure 80: MEA Market Value Share (%) and BPS Analysis by Country, 2022 to 2032

Figure 81: MEA Market Y-o-Y Growth (%) Projections by Country, 2022 to 2032

Figure 82: MEA Market Value (US$ Million) Analysis by Product Type, 2017 to 2032

Figure 83: MEA Market Value Share (%) and BPS Analysis by Product Type, 2022 to 2032

Figure 84: MEA Market Y-o-Y Growth (%) Projections by Product Type, 2022 to 2032

Figure 85: MEA Market Value (US$ Million) Analysis by End User, 2017 to 2032

Figure 86: MEA Market Value Share (%) and BPS Analysis by End User, 2022 to 2032

Figure 87: MEA Market Y-o-Y Growth (%) Projections by End User, 2022 to 2032

Figure 88: MEA Market Attractiveness by Product Type, 2022 to 2032

Figure 89: MEA Market Attractiveness by End User, 2022 to 2032

Figure 90: MEA Market Attractiveness by Country, 2022 to 2032

Recommendations

Healthcare

Nerve Repair Market

Published : June 2023

Explore Healthcare Insights

View Reports

Rib Fracture Repair Systems Market