Ribbon Blenders Market Snapshot (2022-2032)

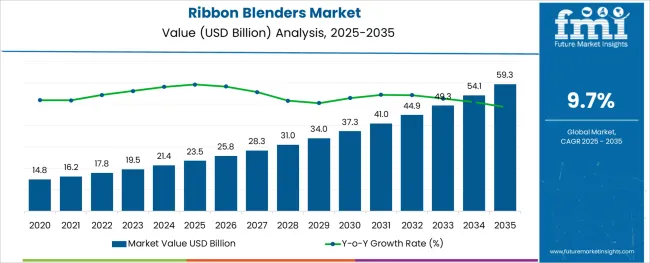
[250+ Pages Report] The global ribbon blenders market size is anticipated to be valued at US$ 21.3 Bn in 2032 and exhibit growth at a CAGR of 9.7% in the forecast period from 2022 to 2032. High demand for premium quality blenders in the food and beverage industry is set to augment sales of ribbon blenders in the upcoming years.

According to a report by FMI, the global ribbon blenders market is likely to reach US$ 17.8 Bn in 2022. Surging adoption of customized equipment designs to improve the overall performance and operational efficiency is estimated to bolster growth.

Report Attribute Details
Ribbon Blenders Market Estimated Base Year Value (2021) US$ 16.4 Billion
Ribbon Blenders Market Expected Market Value (2022) US$ 17.8 Billion
Ribbon Blenders Market Anticipated Forecast Value (2032) US$ 21.3 Billion
Ribbon Blenders Market Projected Growth Rate (2022-2032) 9.7% CAGR

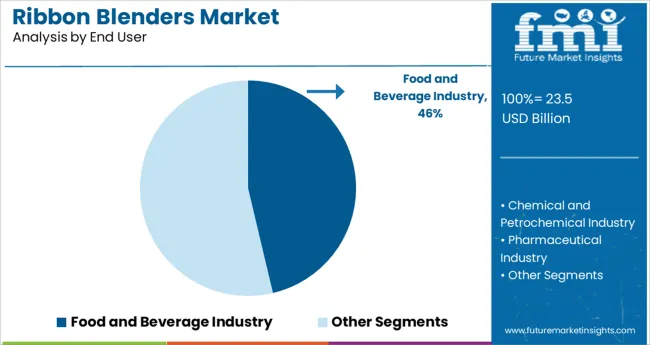
Ribbon blender is considered to be the most commonly used mixer in the food and beverage industry. It is cost-effective, versatile, and is extensively utilized to mix dry solids. It is suitable for blending most light pastes and solids.

The action of the outer and inner ribbons delivers economical and effective blending. Availability of a wide range of ribbon blenders that are capable of mixing free-flowing, dry solids, as well as bulk densities, is likely to push the market.

Surging need for dry juice mixes, protein powder mixes, and nutraceuticals worldwide is expected to accelerate the demand for ribbon mixers in the assessment period. Ability of these blenders to provide high homogeneity and low energy consumption is another crucial factor that is projected to aid growth.

Further, growing usage of ribbon blenders for making bread improvers, muffin mixes, energy drinks, tea, dairy products, coffee flour, cakes, snack bars, and cereals is set to drive growth. Emergence of new equipment with customizable structures with features, such as automated recipe control, spray system, and temperature control is also projected to boost growth.

Don't pay for what you don't need

Customize your report by selecting specific countries or regions and save 30%!

High Demand for Breakfast Cereals to Propel the Global Ribbon Blenders Market

Surging consumption of breakfast cereals with the rising popularity of ready-to-eat food items enabled by busy lifestyles of the working population is expected to augment the market. Rising need for healthy & convenient food, increasing preference for local flavors, and westernization of global diets are set to push cereal consumption in developing countries, thereby accelerating the ribbon blenders market growth.

Moreover, rapid expansion of retail infrastructure, such as hypermarkets and supermarkets in various parts of the globe is set to fuel the demand for breakfast cereals. Increasing number of new product launches with numerous flavors by key players is another crucial factor that would spur growth.

In November 2021, for instance, General Mills, Inc., a multinational food company based in the U.S., launched various products to expand its ready-to-eat cereal range. The lineup includes CinnaGraham Toast Crunch, Reese’s Puffs Cluster Crunch, Plentifull, PJ Masks Cereal, and Strawberry Banana Cheerios. Such unique product launches by companies in the breakfast cereal segment is set to foster the requirement of ribbon blenders.
Which Factors May Hamper Demand for Ribbon Blenders during 2022-2032?

It is very difficult to generate 100% discharge in ribbon blenders. The movement of ribbons located near the vessel walls can damage delicate materials and lead to attrition because of high compression and shear. In addition to that, high clearance between the container and the external periphery of the outer ribbon can often result in dead or unmixed spots. Spurred by the aforementioned disadvantages, sales of ribbon blenders may get hindered in the assessment period.

Nandini Roy Choudhury

Principal Consultant

Talk to Analyst

Find your sweet spots for generating winning opportunities in this market.

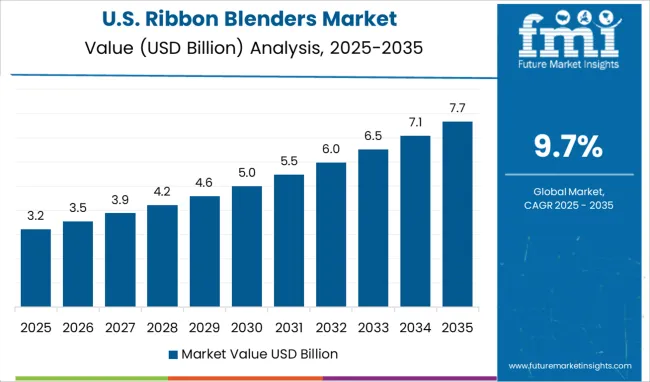
Increasing Consumption of Snack Bars to Drive the North America Ribbon Blenders Market

Increasing demand for snack bars among the health-conscious population in the U.S. and Canada is projected to bolster the North America ribbon blenders market share in future years. Rising replacement of high calorie content products with snack bars in the region is also expected to drive the regional market.

Surging cases of obesity are compelling consumers to opt for nutritious snack bars, which would propel the need for ribbon blenders. As per the Centers for Disease Control and Prevention (CDC), in 2017-March 2020, the prevalence of obesity in the U.S. was 41.9% and the estimated annual medical cost of obesity was about US$ 173 Bn in the country. The trend is set to continue throughout the forthcoming years, thereby fostering the North America market.

High Sales of Energy Drinks in India to Push the Asia Pacific Ribbon Blenders Market

Asia Pacific is set to remain in the second position, followed by North America during the forecast period. Launch of customized energy drinks to attract consumers belonging to the age group of 18-34 years in India, China, Japan, and South Korea is likely to augur well for the regional market.

In October 2021, for instance, AB InBev, a multinational drink and brewing company headquartered in Belgium, introduced Budweiser Beats in India. The company aims to expand its non-alcoholic beer and energy drink segments in the country. It also wants to lower the harmful effects of alcohol by nearly 10% in top 6 cities worldwide by launching energy drinks. On account of new product launches, sales of ribbon blenders are projected to grow in Asia Pacific.
Get the data you need at a Fraction of the cost

Personalize your report by choosing insights you need
and save 40%!

Market Competition

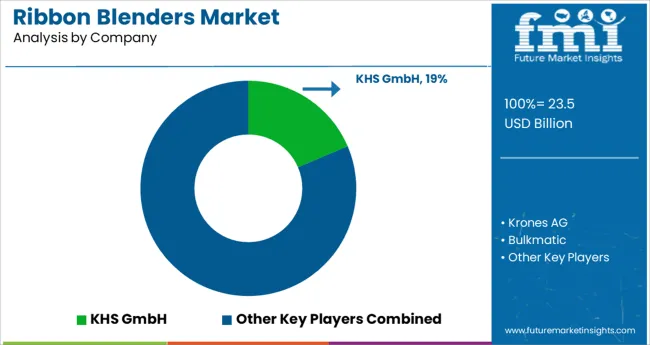
Some of the renowned companies operating in the global ribbon blenders market include Buhler Holding AG, Bulkmatic, Sulzer Ltd., KHS GmbH, Morton Mixers & Blenders, Highland Equipment, SPX Corporation, Tetra Laval International S.A., Lee Industries, Krones AG, Charles Ross & Son, Munson Machinery, Marel hf, Hosokawa Micron Corporation, John Bean Technologies Corporation, and GEA Group AG among others.

The majority of the key players in the market are focusing on research and development activities to introduce state-of-the-art products. They are also collaborating with renowned food and beverage manufacturers to provide their in-house ribbon blenders and gain a competitive edge in the market. Some of the other companies are aiming to generate high shares by engaging in mergers and acquisitions, joint ventures, and capacity expansion strategies.

Report Scope

Report Attribute Details
Growth Rate CAGR of 9.7% from 2022 to 2032
Base Year for Estimation 2021
Historical Data 2015-2020
Forecast Period 2022-2032
Quantitative Units Revenue in USD Million and CAGR from 2022-2032
Report Coverage Revenue Forecast, Volume Forecast, Company Ranking, Competitive Landscape, Growth Factors, Trends and Pricing Analysis
Segments Covered
  • End User
  • Type
  • Region
Regions Covered
  • North America
  • Latin America
  • Western Europe
  • Eastern Europe
  • APEJ
  • Japan
  • Middle East and Africa
Key Countries Profiled
  • USA
  • Canada
  • Brazil
  • Argentina
  • Germany
  • UK
  • France
  • Spain
  • Italy
  • Nordics
  • BENELUX
  • Australia & New Zealand
  • China
  • India
  • ASEAN
  • GCC
  • South Africa
Key Companies Profiled
  • Buhler Holding AG
  • Bulkmatic, Sulzer Ltd.
  • KHS GmbH
  • Morton Mixers & Blenders
  • Highland Equipment
  • SPX Corporation
  • Tetra Laval International S.A.
  • Lee Industries
  • Krones AG
  • Charles Ross & Son
  • Munson Machinery
  • Marel hf
  • Hosokawa Micron Corporation
  • John Bean Technologies Corporation
  • GEA Group AG
Customization Available Upon Request

Key Segments Profiled in the Ribbon Blenders Industry Survey

By End User:

  • Food and Beverage Industry
  • Chemical and Petrochemical Industry
  • Pharmaceutical Industry

By Type:

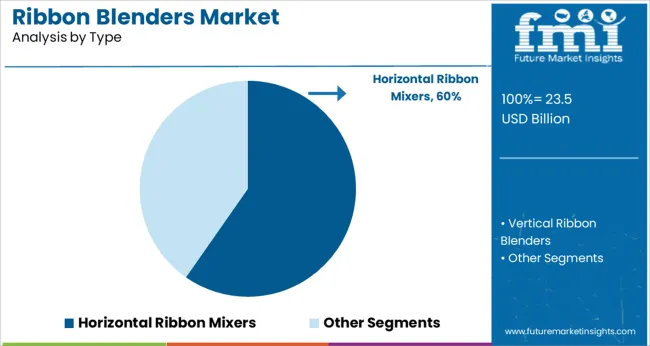
  • Vertical Ribbon Blenders
  • Horizontal Ribbon Mixers

By Region:

  • North America
  • Latin America
  • Western Europe
  • Eastern Europe
  • APEJ
  • Japan
  • Middle East and Africa

Frequently Asked Questions

What is the sales forecast for ribbon blenders in the global market until 2032?

The global ribbon blenders market is set to surpass US$ 21.3 Bn in 2032.

Which region is set to lead the ribbon blenders market?

North America is set to lead the ribbon blenders market in the forecast period.

Which are some of the renowned companies in the ribbon blenders market?

Buhler Holding AG, Bulkmatic, Sulzer Ltd., KHS GmbH, Morton Mixers & Blenders, Highland Equipment, SPX Corporation, and Tetra Laval International S.A. are some of the renowned companies in the ribbon blenders market.

Table of Content
1. Executive Summary

    1.1. Global Market Outlook

    1.2. Demand-side Trends

    1.3. Supply-side Trends

    1.4. Technology Roadmap Analysis

    1.5. Analysis and Recommendations

2. Market Overview

    2.1. Market Coverage / Taxonomy

    2.2. Market Definition / Scope / Limitations

3. Market Background

    3.1. Market Dynamics

        3.1.1. Drivers

        3.1.2. Restraints

        3.1.3. Opportunity

        3.1.4. Trends

    3.2. Scenario Forecast

        3.2.1. Demand in Optimistic Scenario

        3.2.2. Demand in Likely Scenario

        3.2.3. Demand in Conservative Scenario

    3.3. Opportunity Map Analysis

    3.4. Product Life Cycle Analysis

    3.5. Supply Chain Analysis

        3.5.1. Supply Side Participants and their Roles

            3.5.1.1. Producers

            3.5.1.2. Mid-Level Participants (Traders/ Agents/ Brokers)

            3.5.1.3. Wholesalers and Distributors

        3.5.2. Value Added and Value Created at Node in the Supply Chain

        3.5.3. List of Raw Material Suppliers

        3.5.4. List of Existing and Potential Buyer’s

    3.6. Investment Feasibility Matrix

    3.7. Value Chain Analysis

        3.7.1. Profit Margin Analysis

        3.7.2. Wholesalers and Distributors

        3.7.3. Retailers

    3.8. PESTLE and Porter’s Analysis

    3.9. Regulatory Landscape

        3.9.1. By Key Regions

        3.9.2. By Key Countries

    3.10. Regional Parent Market Outlook

    3.11. Production and Consumption Statistics

    3.12. Import and Export Statistics

4. Global Ribbon Blenders Market Analysis 2017-2021 and Forecast, 2022-2032

    4.1. Historical Market Size Value (US$ Mn) & Volume (Units) Analysis, 2017-2021

    4.2. Current and Future Market Size Value (US$ Mn) & Volume (Units) Projections, 2022-2032

        4.2.1. Y-o-Y Growth Trend Analysis

        4.2.2. Absolute $ Opportunity Analysis

5. Global Ribbon Blenders Market Analysis 2017-2021 and Forecast 2022-2032, By Type

    5.1. Introduction / Key Findings

    5.2. Historical Market Size Value (US$ Mn) & Volume (Units) Analysis By Type, 2017-2021

    5.3. Current and Future Market Size Value (US$ Mn) & Volume (Units) Analysis and Forecast By Type, 2022-2032

        5.3.1. Vertical Ribbon Blenders

        5.3.2. Horizontal Ribbon Mixers

    5.4. Y-o-Y Growth Trend Analysis By Type, 2017-2021

    5.5. Absolute $ Opportunity Analysis By Type, 2022-2032

6. Global Ribbon Blenders Market Analysis 2017-2021 and Forecast 2022-2032, By End User

    6.1. Introduction / Key Findings

    6.2. Historical Market Size Value (US$ Mn) & Volume (Units) Analysis By End User, 2017-2021

    6.3. Current and Future Market Size Value (US$ Mn) & Volume (Units) Analysis and Forecast By End User, 2022-2032

        6.3.1. Food and Beverage Industry

        6.3.2. Chemical and Petrochemical Industry

        6.3.3. Pharmaceutical Industry

    6.4. Y-o-Y Growth Trend Analysis By End User, 2017-2021

    6.5. Absolute $ Opportunity Analysis By End User, 2022-2032

7. Global Ribbon Blenders Market Analysis 2017-2021 and Forecast 2022-2032, By Region

    7.1. Introduction

    7.2. Historical Market Size Value (US$ Mn) & Volume (Units) Analysis By Region, 2017-2021

    7.3. Current Market Size Value (US$ Mn) & Volume (Units) Analysis and Forecast By Region, 2022-2032

        7.3.1. North America

        7.3.2. Latin America

        7.3.3. Europe

        7.3.4. Asia Pacific

        7.3.5. Middle East and Africa

    7.4. Market Attractiveness Analysis By Region

8. North America Ribbon Blenders Market Analysis 2017-2021 and Forecast 2022-2032, By Country

    8.1. Historical Market Size Value (US$ Mn) & Volume (Units) Trend Analysis By Market Taxonomy, 2017-2021

    8.2. Market Size Value (US$ Mn) & Volume (Units) Forecast By Market Taxonomy, 2022-2032

        8.2.1. By Country

            8.2.1.1. U.S.

            8.2.1.2. Canada

        8.2.2. By Type

        8.2.3. By End User

    8.3. Market Attractiveness Analysis

        8.3.1. By Country

        8.3.2. By Type

        8.3.3. By End User

    8.4. Key Takeaways

9. Latin America Ribbon Blenders Market Analysis 2017-2021 and Forecast 2022-2032, By Country

    9.1. Historical Market Size Value (US$ Mn) & Volume (Units) Trend Analysis By Market Taxonomy, 2017-2021

    9.2. Market Size Value (US$ Mn) & Volume (Units) Forecast By Market Taxonomy, 2022-2032

        9.2.1. By Country

            9.2.1.1. Brazil

            9.2.1.2. Mexico

            9.2.1.3. Argentina

            9.2.1.4. Chile

            9.2.1.5. Peru

            9.2.1.6. Rest of Latin America

        9.2.2. By Type

        9.2.3. By End User

    9.3. Market Attractiveness Analysis

        9.3.1. By Country

        9.3.2. By Type

        9.3.3. By End User

    9.4. Key Takeaways

10. Europe Ribbon Blenders Market Analysis 2017-2021 and Forecast 2022-2032, By Country

    10.1. Historical Market Size Value (US$ Mn) & Volume (Units) Trend Analysis By Market Taxonomy, 2017-2021

    10.2. Market Size Value (US$ Mn) & Volume (Units) Forecast By Market Taxonomy, 2022-2032

        10.2.1. By Country

            10.2.1.1. Germany

            10.2.1.2. Italy

            10.2.1.3. France

            10.2.1.4. U.K.

            10.2.1.5. Spain

            10.2.1.6. Russia

            10.2.1.7. BENELUX

            10.2.1.8. Rest of Europe

        10.2.2. By Type

        10.2.3. By End User

    10.3. Market Attractiveness Analysis

        10.3.1. By Country

        10.3.2. By Type

        10.3.3. By End User

    10.4. Key Takeaways

11. Asia Pacific Ribbon Blenders Market Analysis 2017-2021 and Forecast 2022-2032, By Country

    11.1. Historical Market Size Value (US$ Mn) & Volume (Units) Trend Analysis By Market Taxonomy, 2017-2021

    11.2. Market Size Value (US$ Mn) & Volume (Units) Forecast By Market Taxonomy, 2022-2032

        11.2.1. By Country

            11.2.1.1. China

            11.2.1.2. Japan

            11.2.1.3. South Korea

            11.2.1.4. Rest of Asia Pacific

        11.2.2. By Type

        11.2.3. By End User

    11.3. Market Attractiveness Analysis

        11.3.1. By Country

        11.3.2. By Type

        11.3.3. By End User

    11.4. Key Takeaways

12. Middle East and Africa Ribbon Blenders Market Analysis 2017-2021 and Forecast 2022-2032, By Country

    12.1. Historical Market Size Value (US$ Mn) & Volume (Units) Trend Analysis By Market Taxonomy, 2017-2021

    12.2. Market Size Value (US$ Mn) & Volume (Units) Forecast By Market Taxonomy, 2022-2032

        12.2.1. By Country

            12.2.1.1. GCC Countries

            12.2.1.2. South Africa

            12.2.1.3. Turkey

            12.2.1.4. Rest of Middle East and Africa

        12.2.2. By Type

        12.2.3. By End User

    12.3. Market Attractiveness Analysis

        12.3.1. By Country

        12.3.2. By Type

        12.3.3. By End User

    12.4. Key Takeaways

13. Key Countries Ribbon Blenders Market Analysis

    13.1. U.S.

        13.1.1. Pricing Analysis

        13.1.2. Market Share Analysis, 2021

            13.1.2.1. By Type

            13.1.2.2. By End User

    13.2. Canada

        13.2.1. Pricing Analysis

        13.2.2. Market Share Analysis, 2021

            13.2.2.1. By Type

            13.2.2.2. By End User

    13.3. Brazil

        13.3.1. Pricing Analysis

        13.3.2. Market Share Analysis, 2021

            13.3.2.1. By Type

            13.3.2.2. By End User

    13.4. Mexico

        13.4.1. Pricing Analysis

        13.4.2. Market Share Analysis, 2021

            13.4.2.1. By Type

            13.4.2.2. By End User

    13.5. Argentina

        13.5.1. Pricing Analysis

        13.5.2. Market Share Analysis, 2021

            13.5.2.1. By Type

            13.5.2.2. By End User

    13.6. Chile

        13.6.1. Pricing Analysis

        13.6.2. Market Share Analysis, 2021

            13.6.2.1. By Type

            13.6.2.2. By End User

    13.7. Peru

        13.7.1. Pricing Analysis

        13.7.2. Market Share Analysis, 2021

            13.7.2.1. By Type

            13.7.2.2. By End User

    13.8. Germany

        13.8.1. Pricing Analysis

        13.8.2. Market Share Analysis, 2021

            13.8.2.1. By Type

            13.8.2.2. By End User

    13.9. Italy

        13.9.1. Pricing Analysis

        13.9.2. Market Share Analysis, 2021

            13.9.2.1. By Type

            13.9.2.2. By End User

    13.10. France

        13.10.1. Pricing Analysis

        13.10.2. Market Share Analysis, 2021

            13.10.2.1. By Type

            13.10.2.2. By End User

    13.11. U.K.

        13.11.1. Pricing Analysis

        13.11.2. Market Share Analysis, 2021

            13.11.2.1. By Type

            13.11.2.2. By End User

    13.12. Spain

        13.12.1. Pricing Analysis

        13.12.2. Market Share Analysis, 2021

            13.12.2.1. By Type

            13.12.2.2. By End User

    13.13. Russia

        13.13.1. Pricing Analysis

        13.13.2. Market Share Analysis, 2021

            13.13.2.1. By Type

            13.13.2.2. By End User

    13.14. BENELUX

        13.14.1. Pricing Analysis

        13.14.2. Market Share Analysis, 2021

            13.14.2.1. By Type

            13.14.2.2. By End User

    13.15. China

        13.15.1. Pricing Analysis

        13.15.2. Market Share Analysis, 2021

            13.15.2.1. By Type

            13.15.2.2. By End User

    13.16. Japan

        13.16.1. Pricing Analysis

        13.16.2. Market Share Analysis, 2021

            13.16.2.1. By Type

            13.16.2.2. By End User

    13.17. South Korea

        13.17.1. Pricing Analysis

        13.17.2. Market Share Analysis, 2021

            13.17.2.1. By Type

            13.17.2.2. By End User

    13.18. GCC Countries

        13.18.1. Pricing Analysis

        13.18.2. Market Share Analysis, 2021

            13.18.2.1. By Type

            13.18.2.2. By End User

    13.19. South Africa

        13.19.1. Pricing Analysis

        13.19.2. Market Share Analysis, 2021

            13.19.2.1. By Type

            13.19.2.2. By End User

    13.20. Turkey

        13.20.1. Pricing Analysis

        13.20.2. Market Share Analysis, 2021

            13.20.2.1. By Type

            13.20.2.2. By End User

14. Market Structure Analysis

    14.1. Competition Dashboard

    14.2. Competition Benchmarking

    14.3. Market Share Analysis of Top Players

        14.3.1. By Regional

        14.3.2. By Type

        14.3.3. By End User

15. Competition Analysis

    15.1. Competition Deep Dive

        15.1.1. KHS GmbH

            15.1.1.1. Overview

            15.1.1.2. Product Portfolio

            15.1.1.3. Profitability by Market Segments

            15.1.1.4. Sales Footprint

            15.1.1.5. Strategy Overview

                15.1.1.5.1. Marketing Strategy

                15.1.1.5.2. Product Strategy

                15.1.1.5.3. Channel Strategy

        15.1.2. Krones AG

            15.1.2.1. Overview

            15.1.2.2. Product Portfolio

            15.1.2.3. Profitability by Market Segments

            15.1.2.4. Sales Footprint

            15.1.2.5. Strategy Overview

                15.1.2.5.1. Marketing Strategy

                15.1.2.5.2. Product Strategy

                15.1.2.5.3. Channel Strategy

        15.1.3. Bulkmatic

            15.1.3.1. Overview

            15.1.3.2. Product Portfolio

            15.1.3.3. Profitability by Market Segments

            15.1.3.4. Sales Footprint

            15.1.3.5. Strategy Overview

                15.1.3.5.1. Marketing Strategy

                15.1.3.5.2. Product Strategy

                15.1.3.5.3. Channel Strategy

        15.1.4. Marel hf.

            15.1.4.1. Overview

            15.1.4.2. Product Portfolio

            15.1.4.3. Profitability by Market Segments

            15.1.4.4. Sales Footprint

            15.1.4.5. Strategy Overview

                15.1.4.5.1. Marketing Strategy

                15.1.4.5.2. Product Strategy

                15.1.4.5.3. Channel Strategy

        15.1.5. Tetra Laval International S.A.

            15.1.5.1. Overview

            15.1.5.2. Product Portfolio

            15.1.5.3. Profitability by Market Segments

            15.1.5.4. Sales Footprint

            15.1.5.5. Strategy Overview

                15.1.5.5.1. Marketing Strategy

                15.1.5.5.2. Product Strategy

                15.1.5.5.3. Channel Strategy

        15.1.6. John Bean Technologies Corporation

            15.1.6.1. Overview

            15.1.6.2. Product Portfolio

            15.1.6.3. Profitability by Market Segments

            15.1.6.4. Sales Footprint

            15.1.6.5. Strategy Overview

                15.1.6.5.1. Marketing Strategy

                15.1.6.5.2. Product Strategy

                15.1.6.5.3. Channel Strategy

        15.1.7. Munson Machinery

            15.1.7.1. Overview

            15.1.7.2. Product Portfolio

            15.1.7.3. Profitability by Market Segments

            15.1.7.4. Sales Footprint

            15.1.7.5. Strategy Overview

                15.1.7.5.1. Marketing Strategy

                15.1.7.5.2. Product Strategy

                15.1.7.5.3. Channel Strategy

        15.1.8. Buhler Holding AG

            15.1.8.1. Overview

            15.1.8.2. Product Portfolio

            15.1.8.3. Profitability by Market Segments

            15.1.8.4. Sales Footprint

            15.1.8.5. Strategy Overview

                15.1.8.5.1. Marketing Strategy

                15.1.8.5.2. Product Strategy

                15.1.8.5.3. Channel Strategy

        15.1.9. Highland Equipment

            15.1.9.1. Overview

            15.1.9.2. Product Portfolio

            15.1.9.3. Profitability by Market Segments

            15.1.9.4. Sales Footprint

            15.1.9.5. Strategy Overview

                15.1.9.5.1. Marketing Strategy

                15.1.9.5.2. Product Strategy

                15.1.9.5.3. Channel Strategy

        15.1.10. GEA Group AG

            15.1.10.1. Overview

            15.1.10.2. Product Portfolio

            15.1.10.3. Profitability by Market Segments

            15.1.10.4. Sales Footprint

            15.1.10.5. Strategy Overview

                15.1.10.5.1. Marketing Strategy

                15.1.10.5.2. Product Strategy

                15.1.10.5.3. Channel Strategy

        15.1.11. Hosokawa Micron Corporation

            15.1.11.1. Overview

            15.1.11.2. Product Portfolio

            15.1.11.3. Profitability by Market Segments

            15.1.11.4. Sales Footprint

            15.1.11.5. Strategy Overview

                15.1.11.5.1. Marketing Strategy

                15.1.11.5.2. Product Strategy

                15.1.11.5.3. Channel Strategy

        15.1.12. SPX Corporation

            15.1.12.1. Overview

            15.1.12.2. Product Portfolio

            15.1.12.3. Profitability by Market Segments

            15.1.12.4. Sales Footprint

            15.1.12.5. Strategy Overview

                15.1.12.5.1. Marketing Strategy

                15.1.12.5.2. Product Strategy

                15.1.12.5.3. Channel Strategy

        15.1.13. Charles Ross & Son

            15.1.13.1. Overview

            15.1.13.2. Product Portfolio

            15.1.13.3. Profitability by Market Segments

            15.1.13.4. Sales Footprint

            15.1.13.5. Strategy Overview

                15.1.13.5.1. Marketing Strategy

                15.1.13.5.2. Product Strategy

                15.1.13.5.3. Channel Strategy

        15.1.14. Sulzer Ltd

            15.1.14.1. Overview

            15.1.14.2. Product Portfolio

            15.1.14.3. Profitability by Market Segments

            15.1.14.4. Sales Footprint

            15.1.14.5. Strategy Overview

                15.1.14.5.1. Marketing Strategy

                15.1.14.5.2. Product Strategy

                15.1.14.5.3. Channel Strategy

        15.1.15. Lee Industries

            15.1.15.1. Overview

            15.1.15.2. Product Portfolio

            15.1.15.3. Profitability by Market Segments

            15.1.15.4. Sales Footprint

            15.1.15.5. Strategy Overview

                15.1.15.5.1. Marketing Strategy

                15.1.15.5.2. Product Strategy

                15.1.15.5.3. Channel Strategy

        15.1.16. Morton Mixers & Blenders

            15.1.16.1. Overview

            15.1.16.2. Product Portfolio

            15.1.16.3. Profitability by Market Segments

            15.1.16.4. Sales Footprint

            15.1.16.5. Strategy Overview

                15.1.16.5.1. Marketing Strategy

                15.1.16.5.2. Product Strategy

                15.1.16.5.3. Channel Strategy

16. Assumptions & Acronyms Used

17. Research Methodology
Recommendations

Packaging

Food Packaging Equipment Market

September 2024

REP-GB-6218

Upcoming

Consumer Product

Food Blender and Mixer Market

March 2022

REP-GB-1040

April 2024

340 pages

Food and Beverage

Food And Beverage Air Filtration Market

November 2021

REP-GB-2965

June 2023

315 pages

Testing Equipment

Food Tester Market

January 2019

REP-GB-8479

October 2022

288 pages

Explore Process Automation Insights

View Reports