Card Printer Ribbons Market
Market Insights on Card Printer Ribbons covering sales outlook, demand forecast & up-to-date key trends
Card Printer Ribbons Market By Product (Colour, Monochrome), Printing (Single-sided, Dual-sided) & Region - Forecast 2022 - 2028
Card Printer Ribbons Market Outlook (2022-2028)
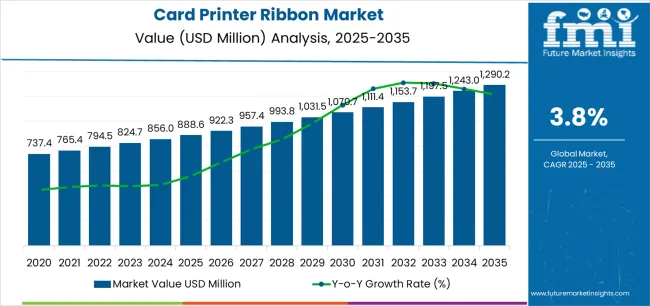
[322 Pages Report] The global card printer ribbons market is projected to expand at a CAGR of 4% over the forecast period of 2022-2028. In 2021, sales of card ribbon printers reflected a value of US$ 759 Mn, which is predicted to top US$ 997 Mn by the end of the year of assessment (2028).
Card Printer Ribbons Market Size (2022) |
US$ 790 Mn |
Sales Forecast (2028) |
US$ 997 Mn |
Global Market Growth Rate (2022 to 2028) |
4% CAGR |
Share of Top 5 Manufacturers of Card Printer Ribbons |
45% |
Card printer ribbon consumption accounted for around 11% share of the global industrial printer ribbon market in 2021. Dual-sided card printer ribbons are expected to be highly lucrative for market players and are anticipated to witness increasing demand from various end-use industry verticals.
Let us know your requirement to get
100% FREE customization
How The Market Progressed Till June 2022?
Market Statistics |
Details |
H1,2021 (A) |
4.0% |
H1,2022 Projected (P) |
4.1% |
H1,2022 Outlook (O) |
4.2% |
BPS Change : H1,2022 (O) - H1,2022 (P) |
(+) 14 ↑ |
BPS Change : H1,2022 (O) - H1,2021 (A) |
(+) 17 ↑ |
Future Market Insights anticipates a comparison and insightful analysis for the dynamics of the Card Printer Ribbon market, which is primarily influenced by a variety of industry factors as well certain macro-economic factors including baking sector growth, healthcare development and adaptation of technology. Some of the most recent industry advancements include the expansion of printer facilities based on applications, mergers and acquisitions, etc.
According to FMI analysis, the variation between the BPS values observed in the card printer ribbon market in H1, 2022 - Outlook over first half 2022 Projected reflects a positive of 14 units. However, compared to first half, 2021, the market is expected to gain 17 BPS in comparison with current estimation. Consumers' preference for cashless payments has shifted due to the increased use of cards for withdrawals and payments.
The trend of 'going cashless' is growing exponentially as several number of people use banking cards to make purchases at retail outlets, supermarkets, restaurants, and cafés all over the world. Retailers across the world are striving for improved ID cards and printing experiences in order to boost the entire production process and associated activities. This has prompted card printer makers to switch to thermal printing technology.
Cards are currently used in practically every circumstance, whether it is an identity card or a health card, due to increasing security along with technology improvements throughout the world. Furthermore, owing to increasing economic development, globalization, and digitalization, demand for digital printer ribbons is projected to skyrocket in the coming years.
Revenue Analysis of Card Printer Ribbons from 2013 to 2021 Compared to Demand Outlook for 2022 to 2028
“Advancements in Card Printing Technology Fueling Market Growth”
From 2013 to 2021, the global card printer ribbons market witnessed a CAGR of 3.6%.
Card printer ribbons are essentially those consumables that hold the printing ink that needs to be printed on cards, especially bank cards and ID cards. They guarantee sharp barcodes, crisp text, and accurate colour patterns.
Card printer ribbons print cards with the help of thermal technology and using ribbon cartridges. Typically, they do not have PLC (Programmable Logic Controllers) and have to rely on external computers.
New card printing technology use ribbons as they offer high quality ID cards with crisp detailing. This has pushed the application of card printers and their consumables in different industries such as banking, healthcare, manufacturing, etc.
Analysis of the card printer ribbons industry revels that the global market is dominated by a limited number of manufacturers. They are introducing new products and card printing technologies and are strategically focusing on reinforcing their base in the early phase of the product life cycle.
The global card printer ribbons market is projected to expand at a 4% CAGR from 2022 to 2028.
What’s Driving Sales of Card Printer Ribbons?
“Demand for Superior Quality ID Cards to Support Card Printer Ribbons Market Growth”
Increasing use of cards for withdrawals and payments has changed the preference of consumers towards cashless payments. The trend of 'go cashless' is rising as increasing number of individuals are using banking cards to carry out transactions in retail stores, supermarkets, restaurants, and cafes across the globe.
Retailers in the global market are pushing for superior ID cards and better printing experience with a view to spur the entire manufacturing process and associated activities. This has compelled manufacturers of card printers to shift towards thermal printing technology.
For instance,
- Large-scale end-use industries are focusing on updating their employee ID cards with latest cost-efficient technology. This is expected to trigger the use of card printer ribbons in the following years.
Find your sweet spots for generating winning opportunities in this market.
Talk to AnalystAre There Any Restraining Factors That Card Printer Ribbon Suppliers Face?
“Environmental Concerns Associated with Disposal of Cards and Card Printers to Hinder Global Market Growth”
Card printers have an average life of around 8 years from the date of manufacture, depending upon their use, post which, they are usually discarded. Considering this, card printer disposal across the entire globe adds to the cumulative electronic waste. In addition, disposal of huge volumes of ribbons and papers adds to the total amount of non-degradable electronic waste generated in a year.
The printing ink used in card printing contains harmful chemicals, whose disposal can have a high negative impact on the environment. This is expected to hinder demand growth of the global card printer ribbons market to some extent.
What are the Factors Driving High Revenue Generation in North America?
“Rapid Digitization to Fuel Sales of Digital Printer Ribbons in North America”
The North American regional market is expected to account for 20.4% of the global market share in 2022.
Due to increased security and technological advancements around the world, cards are now utilized in almost every situation, whether it is an identity card or a health card. Demand for digital printer ribbons is expected to increase significantly in North America owing to factors such as rapid economic expansion, globalization, and digitization.

An unified Market Research Subscription Platform, built for today’s disparate research needs.
Country-wise Analysis
What is the Card Printer Ribbons Market Scenario in the U.S.?
“Rising Adoption of Thermal Transfer Ribbons Fueling Market Expansion in the U.S.”
Consumption of thermal transfer ribbons is expected to increase at a healthy rate due to new and sophisticated digital technologies that are assisting enterprises in achieving high productivity and providing a better user experience to end users.
Card payment methods are becoming more prevalent through point of sale (PoS), mobile point of sale (mPoS), and online terminals, which is likely to fuel the consumption of thermal transfer ribbons in the U.S. Because of the high number of retail outlets in the U.S., adoption of mPoS and PoS terminals is likely to grow rapidly.
Which Technology is Driving Market Growth in China?
“Growing Use of PVC Card Printer Ribbons Boosting Market Growth”
China has shown high inclination towards the use of PVC card printer ribbons in past years, owing to high adoption in the manufacturing industry. Moreover, this has spurred the use of PVC card printer ribbons in the country, and is expected to grow at a high rate over the coming years.
The China card printer ribbons market is predicted to grow rapidly, owing to the rising need for confidentiality personal identity such as identification cards and cashless transactions.
Category-wise Insights
Which Product Type is Expected to Be the Largest Contributor to Card Printer Ribbon Sales Growth?
“End Users to Offer Potential Growth Opportunities for Manufacturers of Dual-sided Card Printer Ribbons”
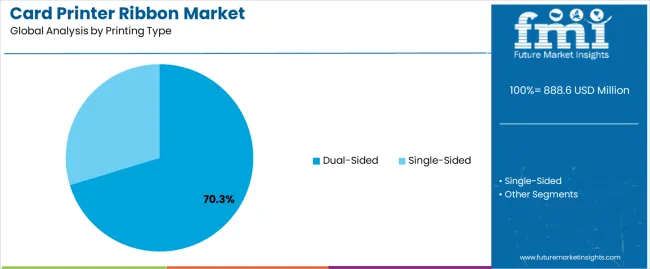
By printing type, the dual-sided card printer ribbons segment is the most lucrative and is projected to expand at a significant rate during the assessment period
Dual-sided card printer ribbons are most preferred by end users due to their capability to hold printing ink on both sides. This feature enhances their usability as compared to single-sided ribbons.
Dual-sided card printer ribbons in the printing type category are expected to be highly attractive and the largest segment with respect to value and volume. This segment is anticipated to dominate the global market.
Which End-use Industry is Poised to Offer Lucrative Market Growth?
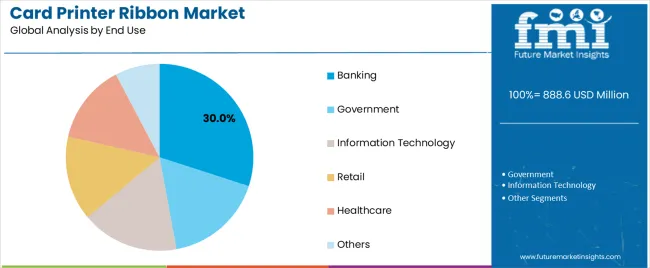
“Growing Banking Sector to Significantly Push Demand for Card Printer Ribbons”
The banking sector has witnessed noteworthy growth in the past several years across the globe. Governments in several developing countries are aiding their citizens to open bank accounts and are promoting the use of credit and debit cards.
Banks are looking forward to gaining incremental profitability from service or product innovations that are deployed through digital channels. This profitability can be achieved through efficiencies that are derived from process optimization and requisite operational changes. Consequently, banks are looking for better quality advanced ID cards for customers. This has pushed the demand for ID card printers and their consumables, such as card printer ribbons.
Impact of COVID-19 on Demand for Card Printer Ribbons
The COVID-19 pandemic has had a negative influence on the industrial printer ribbon market. Due to the closure and social distancing norms, large businesses have halted operations in several areas.
Due to increased urbanization, the industry anticipates a high level of demand and supply following the pandemic. Manufacturers involved in card printers and associated consumables are investing in research and development to develop and innovate new products to cater to changing customer requirements.
Competitive Landscape
Growth in the manufacturing sector is anticipated to generate significant growth opportunities for the sale of card printers, barcoding being one of the main reasons, which is widely used in the manufacturing sector. This is expected to trigger the sales of card printer ribbons at a significant pace over the coming years.
With the emergence of technological advancements, streamlining of manufacturing operations and automation are being carried out by various manufacturers across industry verticals worldwide to reduce material wastage and time and enhance output and efficiency.
Card Printer Ribbons Market Industry Scope
Attribute |
Details |
Forecast Period |
2022-2028 |
Historical Data Available for |
2013-2021 |
Market Analysis |
Value in US$ Mn, Volume in Units |
Key Regions Covered |
|
Key Countries Covered |
|
Key Market Segments Covered |
|
Key Companies Profiled |
|
Pricing |
Available upon Request |
Key Segments of Card Printer Ribbons Industry Survey
Card Printer Ribbons Market by Product:
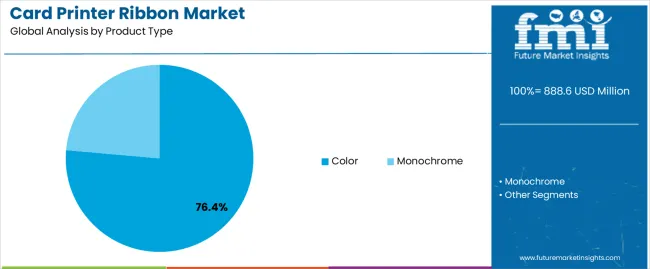
- Colour Card Printer Ribbons
- Monochrome Card Printer Ribbons
Card Printer Ribbons Market by Printing:
- Single-sided Card Printer Ribbons
- Dual-sided Card Printer Ribbons
Card Printer Ribbons Market by End Use:
- Banking
- Government
- Information Technology
- Retail
- Healthcare
- Others
Card Printer Ribbons Market by Region:
- North America Card Printer Ribbons Market
- Latin America Card Printer Ribbons Market
- Europe Card Printer Ribbons Market
- East Asia Card Printer Ribbons Market
- South Asia & Pacific Card Printer Ribbons Market
- Middle East & Africa (MEA) Card Printer Ribbons Market
Frequently Asked Questions
The global card printer ribbons market size is slated to reach US$ 997 Mn by 2028.
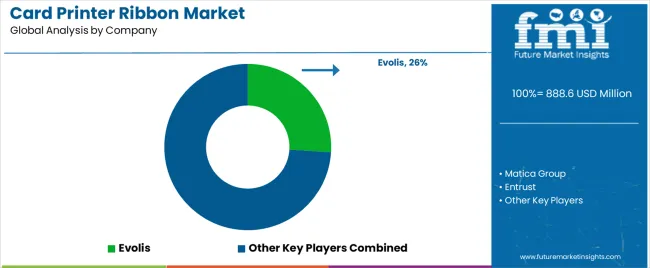
Zebra Technologies Corporation, Evolis S.A., ASSA ABLOY AB, Dai Nippon Printing Co., Ltd., and HiTi Digital, Inc. are key manufacturers of card printer ribbons.
North America accounts for 20.4% share of the global card printer ribbons market.
The global card printer ribbons market is projected to register a CAGR of 4% during 2022-2028.
The U.S., Japan, China, Germany, and France are dominant countries in the global card printer ribbons market.
Table of Content
1. Executive Summary
1.1. Market Overview
1.2. Market Dynamics
1.3. Market Analysis
1.4. FMI Analysis and Recommendations
1.5. Wheel of Fortune
2. Market Introduction
2.1. Market Taxonomy
2.2. Market Definition
3. Global Card Printer Ribbons Market Analysis Scenario
3.1. Introduction
3.1.1. Market Volume Projections
3.1.2. Market Size and Y-o-Y Growth
3.1.3. Absolute $ Opportunity
3.2. Macroeconomic Factors
3.3. Value Chain
3.4. Pricing Analysis, 2022
3.5. Macro-Economic Factors
3.6. Market Dynamics
3.6.1. Drivers
3.6.2. Restraints
3.6.3. Trends
3.6.4. Opportunities
3.7. Porters’ Five Forces Analysis
3.8. Forecast Factors: Relevance and Impact
4. Global Card Printer Ribbons Market Analysis 2013–2021 and Forecast 2022–2028, By Product Type
4.1. Introduction / Key Findings
4.2. Historical Market Size (US$ Mn) and Volume (‘000 Units) Trend Analysis By Product Type, 2013–2021
4.3. Current Market Size (US$ Mn) and Volume (‘000 Units) Forecast By Product Type, 2022–2028
4.3.1. Color
4.3.2. Monochrome
4.4. Market Attractiveness Analysis By Product Type
5. Global Card Printer Ribbons Market Analysis 2013–2021 and Forecast 2022–2028, By Printing Type
5.1. Introduction / Key Findings
5.2. Historical Market Size (US$ Mn) and Volume (‘000 Units) Trend Analysis By Printing Type, 2013–2021
5.3. Current Market Size (US$ Mn) and Volume (‘000 Units) Forecast By Printing Type, 2022–2028
5.3.1. Single Sided
5.3.2. Dual Sided
5.4. Market Attractiveness Analysis By Printing Type
6. Global Card Printer Ribbons Market Analysis 2013–2021 and Forecast 2022–2028, By End Use
6.1. Introduction / Key Findings
6.2. Historical Market Size (US$ Mn) and Volume (‘000 Units) Trend Analysis By End Use, 2013–2021
6.3. Current Market Size (US$ Mn) and Volume (‘000 Units) Forecast By End Use, 2022–2028
6.3.1. Banking
6.3.2. Government
6.3.3. Information Technology
6.3.4. Retail
6.3.5. Healthcare
6.3.6. Others
6.4. Market Attractiveness Analysis By End Use
7. Global Card Printer Ribbons Market Analysis 2013–2021 and Forecast 2022–2028 By Region
7.1. Introduction / Key Findings
7.2. Historical Market Size (US$ Mn) and Volume (‘000 Units) Analysis By Region, 2012 – 2016
7.3. Current Market Size (US$ Mn) and Volume (‘000 Units) Forecast By Region, 2021 - 2027
7.3.1. North America
7.3.2. Latin America
7.3.3. Eastern Europe
7.3.4. Western Europe
7.3.5. South East Asia & Pacific
7.3.6. Middle East & Africa
7.3.7. China
7.3.8. India
7.3.9. Japan
7.4. Market Attractiveness Analysis By Region
8. North America Card Printer Ribbons Market Analysis 2013–2021 and Forecast 2022–2028
8.1. Introduction
8.2. Historical Market Size (US$ Mn) and Volume (‘000 Units) Trend Analysis By Country, 2012-2016
8.2.1. By Country
8.2.2. By Product Type
8.2.3. By Printing Type
8.2.4. By End Use
8.3. Current Market Size (US$ Mn) and Volume (‘000 Units) Forecast By Country, 2021-2027
8.3.1. U.S.
8.3.2. Canada
8.4. Current Market Size (US$ Mn) and Volume (‘000 Units) Forecast By Product Type, 2022–2028
8.4.1. Color
8.4.2. Monochrome
8.5. Current Market Size (US$ Mn) and Volume (‘000 Units) Forecast By Printing Type, 2022–2028
8.5.1. Single Sided
8.5.2. Dual Sided
8.6. Current Market Size (US$ Mn) and Volume (‘000 Units) Forecast By End Use, 2022–2028
8.6.1. Banking
8.6.2. Government
8.6.3. Information Technology
8.6.4. Retail
8.6.5. Healthcare
8.6.6. Others
8.7. Drivers and Restraints: Impact Analysis
8.8. Market Attractiveness Analysis
8.8.1. By Country
8.8.2. By Product Type
8.8.3. By Printing Type
8.8.4. By End Use
8.9. Market Presence
9. Latin America Card Printer Ribbons Market Analysis 2013–2021 and Forecast 2022–2028
9.1. Introduction
9.2. Historical Market Size (US$ Mn) and Volume (‘000 Units) Trend Analysis By Country, 2012-2016
9.2.1. By Country
9.2.2. By Product Type
9.2.3. By Printing Type
9.2.4. By End Use
9.3. Current Market Size (US$ Mn) and Volume (‘000 Units) Forecast By Country, 2021-2027
9.3.1. Mexico
9.3.2. Brazil
9.3.3. Rest of Latin America
9.4. Current Market Size (US$ Mn) and Volume (‘000 Units) Forecast By Product Type, 2022–2028
9.4.1. Color
9.4.2. Monochrome
9.5. Current Market Size (US$ Mn) and Volume (‘000 Units) Forecast By Printing Type, 2022–2028
9.5.1. Single Sided
9.5.2. Dual Sided
9.6. Current Market Size (US$ Mn) and Volume (‘000 Units) Forecast By End Use, 2022–2028
9.6.1. Banking
9.6.2. Government
9.6.3. Information Technology
9.6.4. Retail
9.6.5. Healthcare
9.6.6. Others
9.7. Drivers and Restraints: Impact Analysis
9.8. Market Attractiveness Analysis
9.8.1. By Country
9.8.2. By Product Type
9.8.3. By Printing Type
9.8.4. By End Use
9.9. Market Presence
10. Eastern Europe Card Printer Ribbons Market Analysis 2013–2021 and Forecast 2022–2028
10.1. Introduction
10.2. Historical Market Size (US$ Mn) and Volume (‘000 Units) Trend Analysis By Country, 2012-2016
10.2.1. By Country
10.2.2. By Product Type
10.2.3. By Printing Type
10.2.4. By End Use
10.3. Current Market Size (US$ Mn) and Volume (‘000 Units) Forecast By Country, 2021-2027
10.3.1. Russia
10.3.2. Poland
10.3.3. Rest of Eastern Europe
10.4. Current Market Size (US$ Mn) and Volume (‘000 Units) Forecast By Product Type, 2022–2028
10.4.1. Color
10.4.2. Monochrome
10.5. Current Market Size (US$ Mn) and Volume (‘000 Units) Forecast By Printing Type, 2022–2028
10.5.1. Single Sided
10.5.2. Dual Sided
10.6. Current Market Size (US$ Mn) and Volume (‘000 Units) Forecast By End Use, 2022–2028
10.6.1. Banking
10.6.2. Government
10.6.3. Information Technology
10.6.4. Retail
10.6.5. Healthcare
10.6.6. Others
10.7. Drivers and Restraints: Impact Analysis
10.8. Market Attractiveness Analysis
10.8.1. By Country
10.8.2. By Product Type
10.8.3. By Printing Type
10.8.4. By End Use
10.9. Market Presence
11. Western Europe Card Printer Ribbons Market Analysis 2013–2021 and Forecast 2022–2028
11.1. Introduction
11.2. Historical Market Size (US$ Mn) and Volume (‘000 Units) Trend Analysis By Country, 2012-2016
11.2.1. By Country
11.2.2. By Product Type
11.2.3. By Printing Type
11.2.4. By End Use
11.3. Current Market Size (US$ Mn) and Volume (‘000 Units) Forecast By Country, 2021-2027
11.3.1. Germany
11.3.2. Italy
11.3.3. France
11.3.4. U.K.
11.3.5. Spain
11.3.6. BENELUX
11.3.7. Rest of Western Europe
11.4. Current Market Size (US$ Mn) and Volume (‘000 Units) Forecast By Product Type, 2022–2028
11.4.1. Color
11.4.2. Monochrome
11.5. Current Market Size (US$ Mn) and Volume (‘000 Units) Forecast By Printing Type, 2022–2028
11.5.1. Single Sided
11.5.2. Dual Sided
11.6. Current Market Size (US$ Mn) and Volume (‘000 Units) Forecast By End Use, 2022–2028
11.6.1. Banking
11.6.2. Government
11.6.3. Information Technology
11.6.4. Retail
11.6.5. Healthcare
11.6.6. Others
11.7. Drivers and Restraints: Impact Analysis
11.8. Market Attractiveness Analysis
11.8.1. By Country
11.8.2. By Product Type
11.8.3. By Printing Type
11.8.4. By End Use
11.9. Market Presence
12. South East Asia & Pacific Card Printer Ribbons Market Analysis 2013–2021 and Forecast 2022–2028
12.1. Introduction
12.2. Historical Market Size (US$ Mn) and Volume (‘000 Units) Trend Analysis By Country, 2012-2016
12.2.1. By Country
12.2.2. By Product Type
12.2.3. By Printing Type
12.2.4. By End Use
12.3. Current Market Size (US$ Mn) and Volume (‘000 Units) Forecast By Country, 2021-2027
12.3.1. ASEAN
12.3.2. South Korea
12.3.3. Oceania
12.3.4. Rest of South East Asia & Pacific
12.4. Current Market Size (US$ Mn) and Volume (‘000 Units) Forecast By Product Type, 2022–2028
12.4.1. Color
12.4.2. Monochrome
12.5. Current Market Size (US$ Mn) and Volume (‘000 Units) Forecast By Printing Type, 2022–2028
12.5.1. Single Sided
12.5.2. Dual Sided
12.6. Current Market Size (US$ Mn) and Volume (‘000 Units) Forecast By End Use, 2022–2028
12.6.1. Banking
12.6.2. Government
12.6.3. Information Technology
12.6.4. Retail
12.6.5. Healthcare
12.6.6. Others
12.7. Drivers and Restraints: Impact Analysis
12.8. Market Attractiveness Analysis
12.8.1. By Country
12.8.2. By Product Type
12.8.3. By Printing Type
12.8.4. By End Use
12.9. Market Presence
13. Middle East & Africa Card Printer Ribbons Market Analysis 2013–2021 and Forecast 2022–2028
13.1. Introduction
13.2. Historical Market Size (US$ Mn) and Volume (‘000 Units) Trend Analysis By Country, 2012-2016
13.2.1. By Country
13.2.2. By Product Type
13.2.3. By Printing Type
13.2.4. By End Use
13.3. Current Market Size (US$ Mn) and Volume (‘000 Units) Forecast By Country, 2021-2027
13.3.1. GCC Countries
13.3.2. South Africa
13.3.3. Turkey
13.3.4. Rest of Middle East & Africa
13.4. Current Market Size (US$ Mn) and Volume (‘000 Units) Forecast By Product Type, 2022–2028
13.4.1. Color
13.4.2. Monochrome
13.5. Current Market Size (US$ Mn) and Volume (‘000 Units) Forecast By Printing Type, 2022–2028
13.5.1. Single Sided
13.5.2. Dual Sided
13.6. Current Market Size (US$ Mn) and Volume (‘000 Units) Forecast By End Use, 2022–2028
13.6.1. Banking
13.6.2. Government
13.6.3. Information Technology
13.6.4. Retail
13.6.5. Healthcare
13.6.6. Others
13.7. Drivers and Restraints: Impact Analysis
13.8. Market Attractiveness Analysis
13.8.1. By Country
13.8.2. By Product Type
13.8.3. By Printing Type
13.8.4. By End Use
13.9. Market Presence
14. China Card Printer Ribbons Market Analysis 2013–2021 and Forecast 2022–2028
14.1. Introduction
14.2. Historical Market Size (US$ Mn) and Volume (‘000 Units) Trend Analysis By Country, 2012-2016
14.2.1. By Product Type
14.2.2. By Printing Type
14.2.3. By End Use
14.3. Current Market Size (US$ Mn) and Volume (‘000 Units) Forecast By Product Type, 2022–2028
14.3.1. Color
14.3.2. Monochrome
14.4. Current Market Size (US$ Mn) and Volume (‘000 Units) Forecast By Printing Type, 2022–2028
14.4.1. Single Sided
14.4.2. Dual Sided
14.5. Current Market Size (US$ Mn) and Volume (‘000 Units) Forecast By End Use, 2022–2028
14.5.1. Banking
14.5.2. Government
14.5.3. Information Technology
14.5.4. Retail
14.5.5. Healthcare
14.5.6. Others
14.6. Drivers and Restraints: Impact Analysis
14.7. Market Attractiveness Analysis
14.7.1. By Product Type
14.7.2. By Printing Type
14.7.3. By End Use
14.8. Market Presence
15. India Card Printer Ribbons Market Analysis 2013–2021 and Forecast 2022–2028
15.1. Introduction
15.2. Historical Market Size (US$ Mn) and Volume (‘000 Units) Trend Analysis By Country, 2012-2016
15.2.1. By Product Type
15.2.2. By Printing Type
15.2.3. By End Use
15.3. Current Market Size (US$ Mn) and Volume (‘000 Units) Forecast By Product Type, 2022–2028
15.3.1. Color
15.3.2. Monochrome
15.4. Current Market Size (US$ Mn) and Volume (‘000 Units) Forecast By Printing Type, 2022–2028
15.4.1. Single Sided
15.4.2. Dual Sided
15.5. Current Market Size (US$ Mn) and Volume (‘000 Units) Forecast By End Use, 2022–2028
15.5.1. Banking
15.5.2. Government
15.5.3. Information Technology
15.5.4. Retail
15.5.5. Healthcare
15.5.6. Others
15.6. Drivers and Restraints: Impact Analysis
15.7. Market Attractiveness Analysis
15.7.1. By Product Type
15.7.2. By Printing Type
15.7.3. By End Use
15.8. Market Presence
16. Japan Card Printer Ribbons Market Analysis 2013–2021 and Forecast 2022–2028
16.1. Introduction
16.2. Historical Market Size (US$ Mn) and Volume (‘000 Units) Trend Analysis By Country, 2012-2016
16.2.1. By Product Type
16.2.2. By Printing Type
16.2.3. By End Use
16.3. Current Market Size (US$ Mn) and Volume (‘000 Units) Forecast By Product Type, 2022–2028
16.3.1. Color
16.3.2. Monochrome
16.4. Current Market Size (US$ Mn) and Volume (‘000 Units) Forecast By Printing Type, 2022–2028
16.4.1. Single Sided
16.4.2. Dual Sided
16.5. Current Market Size (US$ Mn) and Volume (‘000 Units) Forecast By End Use, 2022–2028
16.5.1. Banking
16.5.2. Government
16.5.3. Information Technology
16.5.4. Retail
16.5.5. Healthcare
16.5.6. Others
16.6. Drivers and Restraints: Impact Analysis
16.7. Market Attractiveness Analysis
16.7.1. By Product Type
16.7.2. By Printing Type
16.7.3. By End Use
16.8. Market Presence
17. Competition Landscape
17.1. Market Structure
17.2. Competition Intensity Mapping By Market Taxonomy
17.3. Competition Dashboard
17.4. Company Profiles (Details – Overview, Financials, Recent Developments, Strategy)
17.4.1. Zebra Technologies Corporation
17.4.2. Evolis S.A.
17.4.3. ASSA ABLOY AB
17.4.4. Dai Nippon Printing Co., Ltd.
17.4.5. HiTi Digital, Inc.
17.4.6. Matica Technologies AG
17.4.7. Entrust Datacard Corporation
17.4.8. IDP Corp., Ltd.
17.4.9. ICard Solutions (India) Private Limited
17.4.10. Kanematsu USA Inc.
17.4.11. Magicard Ltd.
17.4.12. AlphaCard
17.4.13. NBS Technologies Inc.
17.4.14. Best Barcode System Private Limited
17.4.15. Pointman Technologies Inc.
18. Assumptions and Acronyms
19. Research Methodology
Let us know your requirement to get
100% FREE customization
List of Tables
Table 1: Global Card Printer Ribbons Market Volume ('000 Units) and Value (US$ Mn) Forecast by Product Type, 2013 – 2028
Table 2: Global Card Printer Ribbons Market Volume ('000 Units) and Value (US$ Mn) Forecast by Printing Type, 2013 – 2028
Table 3: Global Card Printer Ribbons Market Volume ('000 Units) and Value (US$ Mn) Forecast by End-Use, 2013 – 2028
Table 4: Global Card Printer Ribbons Market Volume ('000 Units) Forecast by Region 2013–2028
Table 5: Global Card Printer Ribbons Market Size (US$ Mn) Forecast by Region 2013–2028
Table 6: North America Card Printer Ribbons Market Volume ('000 Units) and Value (US$ Mn) Forecast by Country, 2013 – 2028
Table 7: North America Card Printer Ribbons Market Volume ('000 Units) and Value (US$ Mn) Forecast by Product Type, 2013 – 2028
Table 8: North America Card Printer Ribbons Market Volume ('000 Units) and Value (US$ Mn) Forecast by Printing Type, 2013 – 2028
Table 9: North America Card Printer Ribbons Market Volume ('000 Units) and Value (US$ Mn) Forecast by End-Use, 2013 – 2028
Table 10: Latin America Card Printer Ribbons Market Volume ('000 Units) and Value (US$ Mn) Forecast by Country, 2013 – 2028
Table 11: Latin America Card Printer Ribbons Market Volume ('000 Units) and Value (US$ Mn) Forecast by Product Type, 2013 – 2028
Table 12: Latin America Card Printer Ribbons Market Volume ('000 Units) and Value (US$ Mn) Forecast by Printing Type, 2013 – 2028
Table 13: Latin America Card Printer Ribbons Market Volume ('000 Units) and Value (US$ Mn) Forecast by End-Use, 2013 – 2028
Table 14: Eastern Europe Card Printer Ribbons Market Volume ('000 Units) and Value (US$ Mn) Forecast by Country, 2013 – 2028
Table 15: Eastern Europe Card Printer Ribbons Market Volume ('000 Units) and Value (US$ Mn) Forecast by Product Type, 2013 – 2028
Table 16: Eastern Europe Card Printer Ribbons Market Volume ('000 Units) and Value (US$ Mn) Forecast by Printing Type, 2013 – 2028
Table 17: Eastern Europe Card Printer Ribbons Market Volume ('000 Units) and Value (US$ Mn) Forecast by End-Use, 2013 – 2028
Table 18: Western Europe Card Printer Ribbons Market Volume ('000 Units) and Value (US$ Mn) Forecast by Country, 2013 – 2028
Table 19: Western Europe Card Printer Ribbons Market Volume ('000 Units) and Value (US$ Mn) Forecast by Product Type, 2013 – 2028
Table 20: Western Europe Card Printer Ribbons Market Volume ('000 Units) and Value (US$ Mn) Forecast by Printing Type, 2013 – 2028
Table 21: Western Europe Card Printer Ribbons Market Volume ('000 Units) and Value (US$ Mn) Forecast by End-Use, 2013 – 2028
Table 22: SEA & Pacific Card Printer Ribbons Market Volume ('000 Units) and Value (US$ Mn) Forecast by Country, 2013 – 2028
Table 23: SEA & Pacific Card Printer Ribbons Market Volume ('000 Units) and Value (US$ Mn) Forecast by Product Type, 2013 – 2028
Table 24: SEA & Pacific Card Printer Ribbons Market Volume ('000 Units) and Value (US$ Mn) Forecast by Printing Type, 2013 – 2028
Table 25: SEA & Pacific Card Printer Ribbons Market Volume ('000 Units) and Value (US$ Mn) Forecast by End-Use, 2013 – 2028
Table 26: MEA Card Printer Ribbons Market Volume ('000 Units) and Value (US$ Mn) Forecast by Country, 2013 – 2028
Table 27: MEA Card Printer Ribbons Market Volume ('000 Units) and Value (US$ Mn) Forecast by Product Type, 2013 – 2028
Table 28: MEA Card Printer Ribbons Market Volume ('000 Units) and Value (US$ Mn) Forecast by Printing Type, 2013 – 2028
Table 29: MEA Card Printer Ribbons Market Volume ('000 Units) and Value (US$ Mn) Forecast by End-Use, 2013 – 2028
Table 30: China Card Printer Ribbons Market Volume ('000 Units) and Value (US$ Mn) Forecast by Product Type, 2013 – 2028
Table 31: China Card Printer Ribbons Market Volume ('000 Units) and Value (US$ Mn) Forecast by Printing Type, 2013 – 2028
Table 32: China Card Printer Ribbons Market Volume ('000 Units) and Value (US$ Mn) Forecast by End-Use, 2013 – 2028
Table 33: India Card Printer Ribbons Market Volume ('000 Units) and Value (US$ Mn) Forecast by Product Type, 2013 – 2028
Table 34: India Card Printer Ribbons Market Volume ('000 Units) and Value (US$ Mn) Forecast by Printing Type, 2013 – 2028
Table 35: India Card Printer Ribbons Market Volume ('000 Units) and Value (US$ Mn) Forecast by End-Use, 2013 – 2028
Table 36: Japan Card Printer Ribbons Market Volume ('000 Units) and Value (US$ Mn) Forecast by Product Type, 2013 – 2028
Table 37: Japan Card Printer Ribbons Market Volume ('000 Units) and Value (US$ Mn) Forecast by Printing Type, 2013 – 2028
Table 38: Japan Card Printer Ribbons Market Volume ('000 Units) and Value (US$ Mn) Forecast by End-Use, 2013 – 2028
Find your sweet spots for generating winning opportunities in this market.
Talk to AnalystList of Charts
Figure 1: Global Card Printer Ribbons Market Size (US$ Mn) and Y-o-Y Growth, 2013–2028
Figure 2: Global Card Printer Ribbons Market: Absolute $ Opportunity (US$ Mn), 2013–2028
Figure 3: Global Card Printer Ribbons Market Volume ('000 Units), 2013–2028
Figure 4: Global Macro-Economic Factors Annual Growth Percentage, 2021 – 2028
Figure 5: Global Card Printer Ribbons Market Share and BPS Analysis by Product Type – 2022 and 2028
Figure 6: Global Card Printer Ribbons Market, Y-o-Y Growth Projections by Product Type, 2021 – 2028
Figure 7: Global Card Printer Ribbons Market Absolute $ Opportunity (US$ Mn) by Color, 2013 – 2028
Figure 8: Global Card Printer Ribbons Market Absolute $ Opportunity (US$ Mn) by Monochrome, 2013 – 2028
Figure 9: Global Card Printer Ribbons Market Attractiveness Analysis by Product Type, 2021 – 2028
Figure 10: Global Card Printer Ribbons Market Share and BPS Analysis by Printing Type – 2022 and 2028
Figure 11: Global Card Printer Ribbons Market, Y-o-Y Growth Projections by Printing Type, 2022 – 2028
Figure 12: Global Card Printer Ribbons Market Absolute $ Opportunity (US$ Mn) by Single Sided, 2013 – 2028
Figure 13: Global Card Printer Ribbons Market Absolute $ Opportunity (US$ Mn) by Dual Sided, 2013 – 2028
Figure 14: Global Card Printer Ribbons Market Attractiveness Analysis by Printing Type, 2022 – 2028
Figure 15: Global Card Printer Ribbons Market Share and BPS Analysis by End-Use – 2022 and 2028
Figure 16: Global Card Printer Ribbons Market, Y-o-Y Growth Projections by End-Use, 2022 – 2028
Figure 17: Global Card Printer Ribbons Market Absolute $ Opportunity (US$ Mn) by Banking, 2013 – 2028
Figure 18: Global Card Printer Ribbons Market Absolute $ Opportunity (US$ Mn) by Government, 2013 – 2028
Figure 19: Global Card Printer Ribbons Market Absolute $ Opportunity (US$ Mn) by Information Technology, 2013 – 2028
Figure 20: Global Card Printer Ribbons Market Absolute $ Opportunity (US$ Mn) by Retail, 2013 – 2028
Figure 21: Global Card Printer Ribbons Market Absolute $ Opportunity (US$ Mn) by Healthcare, 2013 – 2028
Figure 22: Global Card Printer Ribbons Market Absolute $ Opportunity (US$ Mn) by Others, 2013 – 2028
Figure 23: Global Card Printer Ribbons Market Attractiveness Analysis by End-Use, 2022 – 2028
Figure 24: Global Card Printer Ribbons Market Share and BPS Analysis by Region, 2022 and 2028
Figure 25: Global Card Printer Ribbons Market, Y-o-Y Growth Projections by Region, 2021–2028
Figure 26: North America Card Printer Ribbons Market Absolute $ Opportunity (US$ Mn), 2013–2028
Figure 27: Latin America Card Printer Ribbons Market Absolute $ Opportunity (US$ Mn), 2013–2028
Figure 28: Western Europe Card Printer Ribbons Market Absolute $ Opportunity (US$ Mn), 2013–2028
Figure 29: Eastern Europe Card Printer Ribbons Market Absolute $ Opportunity (US$ Mn), 2013–2028
Figure 30: South East Asia & Pacific Card Printer Ribbons Market Absolute $ Opportunity (US$ Mn), 2013–2028
Figure 31: MEA Card Printer Ribbons Market Absolute $ Opportunity (US$ Mn), 2013–2028
Figure 32: China Card Printer Ribbons Market Absolute $ Opportunity (US$ Mn), 2013–2028
Figure 33: India Card Printer Ribbons Market Absolute $ Opportunity (US$ Mn), 2013–2028
Figure 34: Japan Card Printer Ribbons Market Absolute $ Opportunity (US$ Mn), 2014–2028
Figure 35: Global Card Printer Ribbons Market Attractiveness Analysis by Region, 2022-2028
Figure 36: North America Card Printer Ribbons Market Share by Product Type, 2022
Figure 37: North America Card Printer Ribbons Market Share by End-Use, 2022
Figure 38: North America Card Printer Ribbons Market Share by Printing Type, 2022
Figure 39: North America Card Printer Ribbons Market Share by Country, 2022
Figure 40: North America Card Printer Ribbons Market Share and BPS Analysis by Country – 2022 and 2028
Figure 41: North America Card Printer Ribbons Market Y-o-Y Growth Projection by Country, 2021 – 2028
Figure 42: North America Card Printer Ribbons Market Attractiveness Analysis by Country, 2022-2028
Figure 43: U.S. Card Printer Ribbons Market Absolute $ Opportunity (US$ Mn), 2013–2028
Figure 44: Canada Card Printer Ribbons Market Absolute $ Opportunity (US$ Mn), 2013–2028
Figure 45: North America Card Printer Ribbons Market Share and BPS Analysis by Product Type – 2022 and 2028
Figure 46: North America Card Printer Ribbons Market Attractiveness Analysis by Product Type, 2022-2028
Figure 47: North America Market Absolute $ Opportunity (US$ Mn) by Color Segment, 2013–2028
Figure 48: North America Market Absolute $ Opportunity (US$ Mn) by Monochrome Segment, 2013–2028
Figure 49: North America Card Printer Ribbons Market Share and BPS Analysis by Printing Type – 2022 and 2028
Figure 50: North America Card Printer Ribbons Market Attractiveness Analysis by Printing Type, 2022-2028
Figure 51: North America Market Absolute $ Opportunity (US$ Mn) by Single Sided Segment, 2013–2028
Figure 52: North America Market Absolute $ Opportunity (US$ Mn) by Dual Sided Segment, 2013–2028
Figure 53: North America Card Printer Ribbons Market Share and BPS Analysis by End-Use – 2022 and 2028
Figure 54: North America Card Printer Ribbons Market Attractiveness Analysis by End-Use, 2022-2028
Figure 55: North America Card Printer Ribbons Market Absolute $ Opportunity (US$ Mn) by Banking, 2013 – 2028
Figure 56: North America Card Printer Ribbons Market Absolute $ Opportunity (US$ Mn) by Government, 2013 – 2028
Figure 57: North America Card Printer Ribbons Market Absolute $ Opportunity (US$ Mn) by Information Technology, 2013 – 2028
Figure 58: North America Card Printer Ribbons Market Absolute $ Opportunity (US$ Mn) by Retail, 2013 – 2028
Figure 59: North America Card Printer Ribbons Market Absolute $ Opportunity (US$ Mn) by Healthcare, 2013 – 2028
Figure 60: North America Card Printer Ribbons Market Absolute $ Opportunity (US$ Mn) by Others, 2013 – 2028
Figure 61: Latin America Card Printer Ribbons Market Share by Product Type, 2022
Figure 62: Latin America Card Printer Ribbons Market Share by End-Use, 2022
Figure 63: Latin America Card Printer Ribbons Market Share by Printing Type, 2022
Figure 64: Latin America Card Printer Ribbons Market Share by Country, 2022
Figure 65: Latin America Card Printer Ribbons Market Share and BPS Analysis by Country – 2022 and 2028
Figure 66: Latin America Card Printer Ribbons Market Y-o-Y Growth Projection by Country, 2021 – 2028
Figure 67: Latin America Card Printer Ribbons Market Attractiveness Analysis by Country, 2022-2028
Figure 68: Brazil Card Printer Ribbons Market Absolute $ Opportunity (US$ Mn), 2013–2028
Figure 69: Mexico Card Printer Ribbons Market Absolute $ Opportunity (US$ Mn), 2013–2028
Figure 70: Rest of Latin America Card Printer Ribbons Market Absolute $ Opportunity (US$ Mn), 2013–2028
Figure 71: Latin America Card Printer Ribbons Market Share and BPS Analysis by Product Type – 2022 and 2028
Figure 72: Latin America Card Printer Ribbons Market Attractiveness Analysis by Product Type, 2022-2028
Figure 73: Latin America Market Absolute $ Opportunity (US$ Mn) by Color Segment, 2013–2028
Figure 74: Latin America Market Absolute $ Opportunity (US$ Mn) by Monochrome Segment, 2013–2028
Figure 75: Latin America Card Printer Ribbons Market Share and BPS Analysis by Printing Type – 2022 and 2028
Figure 76: Latin America Card Printer Ribbons Market Attractiveness Analysis by Printing Type, 2022-2028
Figure 77: Latin America Market Absolute $ Opportunity (US$ Mn) by Single Sided Segment, 2013–2028
Figure 78: Latin America Market Absolute $ Opportunity (US$ Mn) by Dual Sided Segment, 2013–2028
Figure 79: Latin America Card Printer Ribbons Market Share and BPS Analysis by End-Use – 2022 and 2028
Figure 80: Latin America Card Printer Ribbons Market Attractiveness Analysis by End-Use, 2022-2028
Figure 81: Latin America Card Printer Ribbons Market Absolute $ Opportunity (US$ Mn) by Banking, 2013 – 2028
Figure 82: Latin America Card Printer Ribbons Market Absolute $ Opportunity (US$ Mn) by Government, 2013 – 2028
Figure 83: Latin America Card Printer Ribbons Market Absolute $ Opportunity (US$ Mn) by Information Technology, 2013 – 2028
Figure 84: Latin America Card Printer Ribbons Market Absolute $ Opportunity (US$ Mn) by Retail, 2013 – 2028
Figure 85: Latin America Card Printer Ribbons Market Absolute $ Opportunity (US$ Mn) by Healthcare, 2013 – 2028
Figure 86: Latin America Card Printer Ribbons Market Absolute $ Opportunity (US$ Mn) by Others, 2013 – 2028
Figure 87: Eastern Europe Card Printer Ribbons Market Share by Product Type, 2022
Figure 88: Eastern Europe Card Printer Ribbons Market Share by End-Use, 2022
Figure 89: Eastern Europe Card Printer Ribbons Market Share by Printing Type, 2022
Figure 90: Eastern Europe Card Printer Ribbons Market Share by Country, 2022
Figure 91: Eastern Europe Card Printer Ribbons Market Share and BPS Analysis by Country – 2022 and 2028
Figure 92: Eastern Europe Card Printer Ribbons Market Y-o-Y Growth Projection by Country, 2021 – 2028
Figure 93: Eastern Europe Card Printer Ribbons Market Attractiveness Analysis by Country, 2022-2028
Figure 94: Russia Card Printer Ribbons Market Absolute $ Opportunity (US$ Mn), 2013–2028
Figure 95: Poland Card Printer Ribbons Market Absolute $ Opportunity (US$ Mn), 2013–2028
Figure 96: Rest of Eastern Europe Card Printer Ribbons Market Absolute $ Opportunity (US$ Mn), 2013–2028
Figure 97: Eastern Europe Card Printer Ribbons Market Share and BPS Analysis by Product Type – 2022 and 2028
Figure 98: Eastern Europe Card Printer Ribbons Market Attractiveness Analysis by Product Type, 2022-2028
Figure 99: Eastern Europe Market Absolute $ Opportunity (US$ Mn) by Color Segment, 2013–2028
Figure 100: Eastern Europe Market Absolute $ Opportunity (US$ Mn) by Monochrome Segment, 2013–2028
Figure 101: Eastern Europe Card Printer Ribbons Market Share and BPS Analysis by Printing Type – 2022 and 2028
Figure 102: Eastern Europe Card Printer Ribbons Market Attractiveness Analysis by Printing Type, 2022-2028
Figure 103: Eastern Europe Market Absolute $ Opportunity (US$ Mn) by Single Sided Segment, 2013–2028
Figure 104: Eastern Europe Market Absolute $ Opportunity (US$ Mn) by Dual Sided Segment, 2013–2028
Figure 105: Eastern Europe Card Printer Ribbons Market Share and BPS Analysis by End-Use – 2022 and 2028
Figure 106: Eastern Europe Card Printer Ribbons Market Attractiveness Analysis by End-Use, 2022-2028
Figure 107: Eastern Europe Card Printer Ribbons Market Absolute $ Opportunity (US$ Mn) by Banking, 2013 – 2028
Figure 108: Eastern Europe Card Printer Ribbons Market Absolute $ Opportunity (US$ Mn) by Government, 2013 – 2028
Figure 109: Eastern Europe Card Printer Ribbons Market Absolute $ Opportunity (US$ Mn) by Information Technology, 2013 – 2028
Figure 110: Eastern Europe Card Printer Ribbons Market Absolute $ Opportunity (US$ Mn) by Retail, 2013 – 2028
Figure 111: Eastern Europe Card Printer Ribbons Market Absolute $ Opportunity (US$ Mn) by Healthcare, 2013 – 2028
Figure 112: Eastern Europe Card Printer Ribbons Market Absolute $ Opportunity (US$ Mn) by Others, 2013 – 2028
Figure 113: Western Europe Card Printer Ribbons Market Share by Product Type, 2022
Figure 114: Western Europe Card Printer Ribbons Market Share by End-Use, 2022
Figure 115: Western Europe Card Printer Ribbons Market Share by Printing Type, 2022
Figure 116: Western Europe Card Printer Ribbons Market Share by Country, 2022
Figure 117: Western Europe Card Printer Ribbons Market Share and BPS Analysis by Country – 2022 and 2028
Figure 118: Western Europe Card Printer Ribbons Market Y-o-Y Growth Projection by Country, 2021 – 2028
Figure 119: Western Europe Card Printer Ribbons Market Attractiveness Analysis by Country, 2022-2028
Figure 120: Germany Card Printer Ribbons Market Absolute $ Opportunity (US$ Mn), 2013–2028
Figure 121: Italy Card Printer Ribbons Market Absolute $ Opportunity (US$ Mn), 2013–2028
Figure 122: France Card Printer Ribbons Market Absolute $ Opportunity (US$ Mn), 2013–2028
Figure 123: U.K. Card Printer Ribbons Market Absolute $ Opportunity (US$ Mn), 2013–2028
Figure 124: Spain Card Printer Ribbons Market Absolute $ Opportunity (US$ Mn), 2013–2028
Figure 125: BENELUX Card Printer Ribbons Market Absolute $ Opportunity (US$ Mn), 2013–2028
Figure 126: Rest of Western Europe Card Printer Ribbons Market Absolute $ Opportunity (US$ Mn), 2013–2028
Figure 127: Western Europe Card Printer Ribbons Market Share and BPS Analysis by Product Type – 2022 and 2028
Figure 128: Western Europe Card Printer Ribbons Market Attractiveness Analysis by Product Type, 2022-2028
Figure 129: Western Europe Market Absolute $ Opportunity (US$ Mn) by Color Segment, 2013–2028
Figure 130: Western Europe Market Absolute $ Opportunity (US$ Mn) by Monochrome Segment, 2013–2028
Figure 131: Western Europe Card Printer Ribbons Market Share and BPS Analysis by Printing Type – 2022 and 2028
Figure 132: Western Europe Card Printer Ribbons Market Attractiveness Analysis by Printing Type, 2022-2028
Figure 133: Western Europe Market Absolute $ Opportunity (US$ Mn) by Single Sided Segment, 2013–2028
Figure 134: Western Europe Market Absolute $ Opportunity (US$ Mn) by Dual Sided Segment, 2013–2028
Figure 135: Western Europe Card Printer Ribbons Market Share and BPS Analysis by End-Use – 2022 and 2028
Figure 136: Western Europe Card Printer Ribbons Market Attractiveness Analysis by End-Use, 2022-2028
Figure 137: Western Europe Card Printer Ribbons Market Absolute $ Opportunity (US$ Mn) by Banking, 2013 – 2028
Figure 138: Western Europe Card Printer Ribbons Market Absolute $ Opportunity (US$ Mn) by Government, 2013 – 2028
Figure 139: Western Europe Card Printer Ribbons Market Absolute $ Opportunity (US$ Mn) by Information Technology, 2013 – 2028
Figure 140: Western Europe Card Printer Ribbons Market Absolute $ Opportunity (US$ Mn) by Retail, 2013 – 2028
Figure 141: Western Europe Card Printer Ribbons Market Absolute $ Opportunity (US$ Mn) by Healthcare, 2013 – 2028
Figure 142: Western Europe Card Printer Ribbons Market Absolute $ Opportunity (US$ Mn) by Others, 2013 – 2028
Figure 143: SEA & Pacific Card Printer Ribbons Market Share by Product Type, 2022
Figure 144: SEA & Pacific Card Printer Ribbons Market Share by End-Use, 2022
Figure 145: SEA & Pacific Card Printer Ribbons Market Share by Printing Type, 2022
Figure 146: SEA & Pacific Card Printer Ribbons Market Share by Country, 2022
Figure 147: SEA & Pacific Card Printer Ribbons Market Share and BPS Analysis by Country – 2022 and 2028
Figure 148: SEA & Pacific Card Printer Ribbons Market Y-o-Y Growth Projection by Country, 2021 – 2028
Figure 149: SEA & Pacific Card Printer Ribbons Market Attractiveness Analysis by Country, 2022-2028
Figure 150: ASEAN Card Printer Ribbons Market Absolute $ Opportunity (US$ Mn), 2013–2028
Figure 151: South Korea Card Printer Ribbons Market Absolute $ Opportunity (US$ Mn), 2013–2028
Figure 152: Oceania Card Printer Ribbons Market Absolute $ Opportunity (US$ Mn), 2013–2028
Figure 153: Rest of SEA & Pacific Card Printer Ribbons Market Absolute $ Opportunity (US$ Mn), 2013–2028
Figure 154: SEA & Pacific Card Printer Ribbons Market Share and BPS Analysis by Product Type – 2022 and 2028
Figure 155: SEA & Pacific Card Printer Ribbons Market Attractiveness Analysis by Product Type, 2022-2028
Figure 156: SEA & Pacific Market Absolute $ Opportunity (US$ Mn) by Color Segment, 2013–2028
Figure 157: SEA & Pacific Market Absolute $ Opportunity (US$ Mn) by Monochrome Segment, 2013–2028
Figure 158: SEA & Pacific Card Printer Ribbons Market Share and BPS Analysis by Printing Type – 2022 and 2028
Figure 159: SEA & Pacific Card Printer Ribbons Market Attractiveness Analysis by Printing Type, 2022-2028
Figure 160: SEA & Pacific Market Absolute $ Opportunity (US$ Mn) by Single Sided Segment, 2013–2028
Figure 161: SEA & Pacific Market Absolute $ Opportunity (US$ Mn) by Dual Sided Segment, 2013–2028
Figure 162: SEA & Pacific Card Printer Ribbons Market Share and BPS Analysis by End-Use – 2022 and 2028
Figure 163: SEA & Pacific Card Printer Ribbons Market Attractiveness Analysis by End-Use, 2022-2028
Figure 164: SEA & Pacific Card Printer Ribbons Market Absolute $ Opportunity (US$ Mn) by Banking, 2013 – 2028
Figure 165: SEA & Pacific Card Printer Ribbons Market Absolute $ Opportunity (US$ Mn) by Government, 2013 – 2028
Figure 166: SEA & Pacific Card Printer Ribbons Market Absolute $ Opportunity (US$ Mn) by Information Technology, 2013 – 2028
Figure 167: SEA & Pacific Card Printer Ribbons Market Absolute $ Opportunity (US$ Mn) by Retail, 2013 – 2028
Figure 168: SEA & Pacific Card Printer Ribbons Market Absolute $ Opportunity (US$ Mn) by Healthcare, 2013 – 2028
Figure 169: SEA & Pacific Card Printer Ribbons Market Absolute $ Opportunity (US$ Mn) by Others, 2013 – 2028
Figure 170: MEA Card Printer Ribbons Market Share by Product Type, 2022
Figure 171: MEA Card Printer Ribbons Market Share by End-Use, 2022
Figure 172: MEA Card Printer Ribbons Market Share by Printing Type, 2022
Figure 173: MEA Card Printer Ribbons Market Share by Country, 2022
Figure 174: MEA Card Printer Ribbons Market Share and BPS Analysis by Country – 2022 and 2028
Figure 175: MEA Card Printer Ribbons Market Y-o-Y Growth Projection by Country, 2021 – 2028
Figure 176: MEA Card Printer Ribbons Market Attractiveness Analysis by Country, 2022-2028
Figure 177: GCC Countries Card Printer Ribbons Market Absolute $ Opportunity (US$ Mn), 2013–2028
Figure 178: South Africa Card Printer Ribbons Market Absolute $ Opportunity (US$ Mn), 2013–2028
Figure 179: Turkey Card Printer Ribbons Market Absolute $ Opportunity (US$ Mn), 2013–2028
Figure 180: Rest of MEA Card Printer Ribbons Market Absolute $ Opportunity (US$ Mn), 2013–2028
Figure 181: MEA Card Printer Ribbons Market Share and BPS Analysis by Product Type – 2022 and 2028
Figure 182: MEA Card Printer Ribbons Market Attractiveness Analysis by Product Type, 2022-2028
Figure 183: MEA Market Absolute $ Opportunity (US$ Mn) by Color Segment, 2013–2028
Figure 184: MEA Market Absolute $ Opportunity (US$ Mn) by Monochrome Segment, 2013–2028
Figure 185: MEA Card Printer Ribbons Market Share and BPS Analysis by Printing Type – 2022 and 2028
Figure 186: MEA Card Printer Ribbons Market Attractiveness Analysis by Printing Type, 2022-2028
Figure 187: MEA Market Absolute $ Opportunity (US$ Mn) by Single Sided Segment, 2013–2028
Figure 188: MEA Market Absolute $ Opportunity (US$ Mn) by Dual Sided Segment, 2013–2028
Figure 189: MEA Card Printer Ribbons Market Share and BPS Analysis by End-Use – 2022 and 2028
Figure 190: MEA Card Printer Ribbons Market Attractiveness Analysis by End-Use, 2022-2028
Figure 191: MEA Card Printer Ribbons Market Absolute $ Opportunity (US$ Mn) by Banking, 2013 – 2028
Figure 192: MEA Card Printer Ribbons Market Absolute $ Opportunity (US$ Mn) by Government, 2013 – 2028
Figure 193: MEA Card Printer Ribbons Market Absolute $ Opportunity (US$ Mn) by Information Technology, 2013 – 2028
Figure 194: MEA Card Printer Ribbons Market Absolute $ Opportunity (US$ Mn) by Retail, 2013 – 2028
Figure 195: MEA Card Printer Ribbons Market Absolute $ Opportunity (US$ Mn) by Healthcare, 2013 – 2028
Figure 196: MEA Card Printer Ribbons Market Absolute $ Opportunity (US$ Mn) by Others, 2013 – 2028
Figure 197: China Card Printer Ribbons Market Share by Product Type, 2022
Figure 198: China Card Printer Ribbons Market Share by End-Use, 2022
Figure 199: China Card Printer Ribbons Market Share by Printing Type, 2022
Figure 200: China Card Printer Ribbons Market Share and BPS Analysis by Product Type – 2022 and 2028
Figure 201: China Card Printer Ribbons Market Attractiveness Analysis by Product Type, 2022-2028
Figure 202: China Market Absolute $ Opportunity (US$ Mn) by Color Segment, 2013–2028
Figure 203: China Market Absolute $ Opportunity (US$ Mn) by Monochrome Segment, 2013–2028
Figure 204: China Card Printer Ribbons Market Share and BPS Analysis by Printing Type – 2022 and 2028
Figure 205: China Card Printer Ribbons Market Attractiveness Analysis by Printing Type, 2022-2028
Figure 206: China Market Absolute $ Opportunity (US$ Mn) by Single Sided Segment, 2013–2028
Figure 207: China Market Absolute $ Opportunity (US$ Mn) by Dual Sided Segment, 2013–2028
Figure 208: China Card Printer Ribbons Market Share and BPS Analysis by End-Use – 2022 and 2028
Figure 209: China Card Printer Ribbons Market Attractiveness Analysis by End-Use, 2022-2028
Figure 210: China Card Printer Ribbons Market Absolute $ Opportunity (US$ Mn) by Banking, 2013 – 2028
Figure 211: China Card Printer Ribbons Market Absolute $ Opportunity (US$ Mn) by Government, 2013 – 2028
Figure 212: China Card Printer Ribbons Market Absolute $ Opportunity (US$ Mn) by Information Technology, 2013 – 2028
Figure 213: China Card Printer Ribbons Market Absolute $ Opportunity (US$ Mn) by Retail, 2013 – 2028
Figure 214: China Card Printer Ribbons Market Absolute $ Opportunity (US$ Mn) by Healthcare, 2013 – 2028
Figure 215: China Card Printer Ribbons Market Absolute $ Opportunity (US$ Mn) by Others, 2013 – 2028
Figure 216: India Card Printer Ribbons Market Share by Product Type, 2022
Figure 217: India Card Printer Ribbons Market Share by End-Use, 2022
Figure 218: India Card Printer Ribbons Market Share by Printing Type, 2022
Figure 219: India Card Printer Ribbons Market Share and BPS Analysis by Product Type – 2022 and 2028
Figure 220: India Card Printer Ribbons Market Attractiveness Analysis by Product Type, 2022-2028
Figure 221: India Market Absolute $ Opportunity (US$ Mn) by Color Segment, 2013–2028
Figure 222: India Market Absolute $ Opportunity (US$ Mn) by Monochrome Segment, 2013–2028
Figure 223: India Card Printer Ribbons Market Share and BPS Analysis by Printing Type – 2022 and 2028
Figure 224: India Card Printer Ribbons Market Attractiveness Analysis by Printing Type, 2022-2028
Figure 225: India Market Absolute $ Opportunity (US$ Mn) by Single Sided Segment, 2013–2028
Figure 226: India Market Absolute $ Opportunity (US$ Mn) by Dual Sided Segment, 2013–2028
Figure 227: India Card Printer Ribbons Market Share and BPS Analysis by End-Use – 2022 and 2028
Figure 228: India Card Printer Ribbons Market Attractiveness Analysis by End-Use, 2022-2028
Figure 229: India Card Printer Ribbons Market Absolute $ Opportunity (US$ Mn) by Banking, 2013 – 2028
Figure 230: India Card Printer Ribbons Market Absolute $ Opportunity (US$ Mn) by Government, 2013 – 2028
Figure 231: India Card Printer Ribbons Market Absolute $ Opportunity (US$ Mn) by Information Technology, 2013 – 2028
Figure 232: India Card Printer Ribbons Market Absolute $ Opportunity (US$ Mn) by Retail, 2013 – 2028
Figure 233: India Card Printer Ribbons Market Absolute $ Opportunity (US$ Mn) by Healthcare, 2013 – 2028
Figure 234: India Card Printer Ribbons Market Absolute $ Opportunity (US$ Mn) by Others, 2013 – 2028
Figure 235: Japan Card Printer Ribbons Market Share by Product Type, 2022
Figure 236: Japan Card Printer Ribbons Market Share by End-Use, 2022
Figure 237: Japan Card Printer Ribbons Market Share by Printing Type, 2022
Figure 238: Japan Card Printer Ribbons Market Share and BPS Analysis by Product Type – 2022 and 2028
Figure 239: Japan Card Printer Ribbons Market Attractiveness Analysis by Product Type, 2022-2028
Figure 240: Japan Market Absolute $ Opportunity (US$ Mn) by Color Segment, 2013–2028
Figure 241: Japan Market Absolute $ Opportunity (US$ Mn) by Monochrome Segment, 2013–2028
Figure 242: Japan Card Printer Ribbons Market Share and BPS Analysis by Printing Type – 2022 and 2028
Figure 243: Japan Card Printer Ribbons Market Attractiveness Analysis by Printing Type, 2022-2028
Figure 244: Japan Market Absolute $ Opportunity (US$ Mn) by Single Sided Segment, 2013–2028
Figure 245: Japan Market Absolute $ Opportunity (US$ Mn) by Dual Sided Segment, 2013–2028
Figure 246: Japan Card Printer Ribbons Market Share and BPS Analysis by End-Use – 2022 and 2028
Figure 247: Japan Card Printer Ribbons Market Attractiveness Analysis by End-Use, 2022-2028
Figure 248: Japan Card Printer Ribbons Market Absolute $ Opportunity (US$ Mn) by Banking, 2013 – 2028
Figure 249: Japan Card Printer Ribbons Market Absolute $ Opportunity (US$ Mn) by Government, 2013 – 2028
Figure 250: Japan Card Printer Ribbons Market Absolute $ Opportunity (US$ Mn) by Information Technology, 2013 – 2028
Figure 251: Japan Card Printer Ribbons Market Absolute $ Opportunity (US$ Mn) by Retail, 2013 – 2028
Figure 252: Japan Card Printer Ribbons Market Absolute $ Opportunity (US$ Mn) by Healthcare, 2013 – 2028
Figure 253: Japan Card Printer Ribbons Market Absolute $ Opportunity (US$ Mn) by Others, 2013 – 2028
Figure 254: Global Card Printer Market Share Analysis, 2016
Need specific information?
Request CustomizationExplore Industrial Automation Insights
View Reports