Cardiac Rhythm Remote Monitoring Devices Market Size and Share Forecast Outlook 2025 to 2035

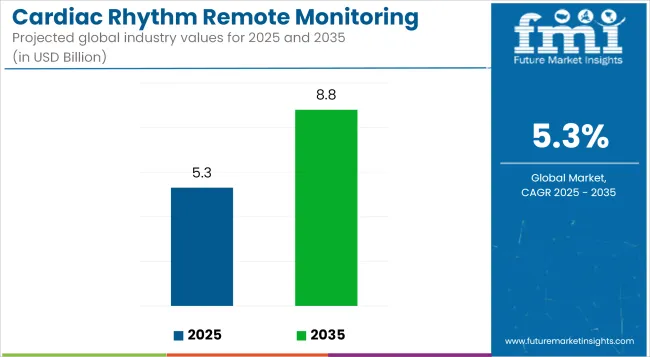
The Cardiac Rhythm Remote Monitoring Devices Market is anticipated to be valued at USD 5.3 billion in 2025 and is expected to reach USD 8.8 billion by 2035, registering a CAGR of 5.3%.
Quick Stats for Cardiac Rhythm Remote Monitoring Devices Market

  • Industry Value (2025): USD 5.3 billion
  • Forecast Value (2035): USD 8.8 billion
  • Forecast CAGR: 5.3%
  • Leading Segment in 2035: Implantable Cardioverter Defibrillators (ICDs)
  • Key Growth Region: North America, Asia-Pacific
  • Top Key Players: Medtronic, Abbott, Boston Scientific, BIOTRONIK, GE Healthcare, Philips Healthcare

Cardiac Rhythm Remote Monitoring Devices Market Industry Value Analysis

Metric Value
Industry Size (2025E) USD 5.3 billion
Industry Value (2035F) USD 8.8 billion
CAGR (2025 to 2035) 5.3%

The Cardiac Rhythm Remote Monitoring Devices market is witnessing a transformative shift, propelled by the integration of AI-driven diagnostics, cloud-based platforms, and the growing emphasis on outpatient care. Healthcare providers are increasingly adopting these devices to facilitate early detection of arrhythmias, reduce hospital readmissions, and enhance patient outcomes.

The transition from traditional in-clinic monitoring to remote, real-time surveillance is driven by the need for continuous cardiac data analytics and interoperability with electronic health records. This evolution is further supported by the rising prevalence of cardiovascular diseases and the demand for cost-effective, patient-centric solutions.

The market's growth trajectory is underpinned by technological advancements, such as wearable and implantable devices capable of long-term monitoring, and the expansion of telehealth services. These factors collectively position the market for sustained growth, as stakeholders prioritize innovations that enhance diagnostic accuracy and patient engagement.

Prominent players in the Cardiac Rhythm Remote Monitoring Devices market include Medtronic, Boston Scientific, Abbott, BIOTRONIK, and iRhythm Technologies. These companies are at the forefront of developing advanced monitoring solutions that combine hardware innovations with sophisticated software analytics.

In April 2025, LifeSignals launched the UbiqVue 2AYe Holter System, a single-use, wearable biosensor that records continuous 2-channel ECG and symptom data over a five-day monitoring period. "UbiqVue Holter is the first Holter system purpose‑built for the digital age, by stripping away workflow complexity, cost barriers, and other operational hurdles, it turns our vision of anytime, anywhere wireless patient monitoring from hospital beds to living rooms into a practical reality for population health delivery.” said Surendar Magar, co‑founder and CEO of LifeSignals.
Analyzing Cardiac Rhythm Remote Monitoring Devices Market by Top Investment Segments

ICDs Lead the Market Due to Rising Cardiac Arrest Cases and Long-Term Monitoring Needs

Cardiac Rhythm Remote Monitoring Devices Market Analysis By Product Type

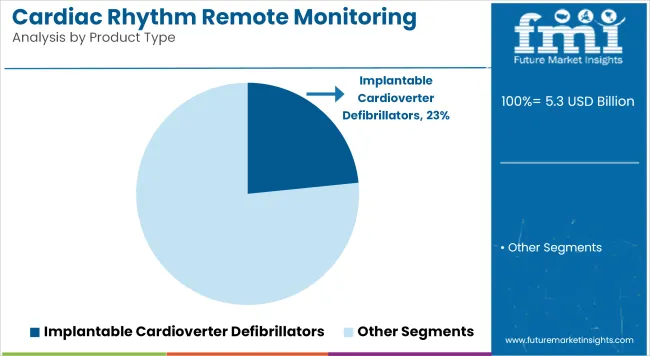
Implantable Cardioverter Defibrillators (ICDs) are estimated to account for 23.4% of the revenue share in 2025, making them the largest contributor by product type. This dominance is attributed to the increasing global burden of sudden cardiac arrest and life-threatening arrhythmias.

ICDs have been preferred for their proven ability to detect and correct abnormal rhythms instantly, improving survival outcomes in high-risk patients. Adoption has been further supported by strong guideline recommendations from cardiac societies in North America and Europe.

Additionally, ICDs are often equipped with remote monitoring capabilities, which allow for early detection of device- or condition-related complications. Reimbursement policies and government-funded programs in developed regions have also expanded patient access. These factors collectively have positioned ICDs as an indispensable component in modern rhythm management protocols.
Portable Devices Lead the Market Due to Advancements in Wearable Monitoring and Home-Based Care

Cardiac Rhythm Remote Monitoring Devices Market Analysis By Modality

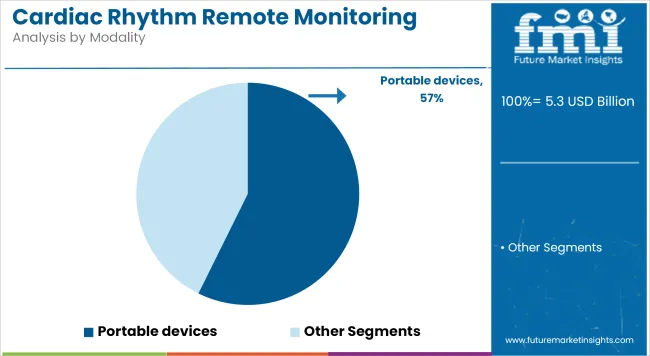
In 2025, portable devices are projected to hold a 57.3% revenue share, dominating the market by modality. Their widespread adoption has been driven by the demand for real-time monitoring in ambulatory and homecare settings.

These devices have been equipped with wireless technologies, enabling continuous ECG data transmission to healthcare providers. As a result, earlier diagnosis and management of arrhythmias have been made possible outside hospital environments. Increasing preference for wearable cardiac patches, mobile telemetry systems, and smartphone-linked monitors has also contributed to growth.

Furthermore, the COVID-19 pandemic accelerated the shift toward remote care models, reinforcing the utility of portable rhythm monitoring solutions. Improved patient compliance, comfort, and diagnostic accuracy have helped portable devices maintain their leading market position.
Hospitals Dominate the Market Due to High Procedure Volume and Integrated Monitoring Infrastructure

Cardiac Rhythm Remote Monitoring Devices Market Analysis By End User

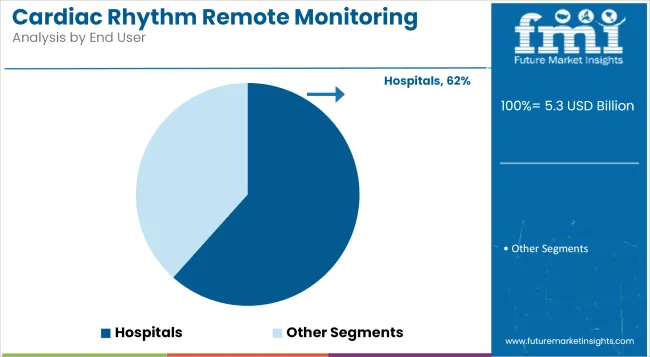
Hospitals are projected to command a 61.6% share of the market by end user in 2025, making them the leading delivery channel for cardiac rhythm remote monitoring devices. This trend has been shaped by the high volume of implantable device procedures performed in hospital settings, including ICD and CRT placements.

Hospitals have also been favored due to their ability to offer continuous telemetry and post-procedural monitoring through advanced infrastructure. Comprehensive access to electrophysiologists and multidisciplinary care teams further enhances device management and outcome tracking.

Moreover, partnerships with remote monitoring service providers have enabled hospitals to extend follow-up care beyond discharge. Reimbursement advantages and inclusion in clinical trials have also positioned hospitals as the preferred point of care for cardiac rhythm monitoring solutions.

Challenges and Opportunities

Challenges

Fragmented Data Integration and Interoperability Slowing Clinical Adoption Impeding Market Expansion

A core challenge limiting growth in the cardiac rhythm remote monitoring devices market is the lack of standardized data integration frameworks across healthcare systems. While advanced monitoring devices generate valuable rhythm intelligence, their interoperability with diverse electronic medical records (EMRs) remains inconsistent.

Hospitals and outpatient clinics often face integration delays due to mismatched data formats and proprietary software ecosystems, leading to underutilization of collected telemetry. This disconnect not only affects real-time clinical decision-making but also hinders scalable deployment across multi-site healthcare networks.

Additionally, smaller providers struggle to invest in IT infrastructure upgrades required to support continuous cardiac monitoring workflows. These barriers suppress the full clinical and economic utility of remote monitoring, particularly in mid-sized practices and resource-limited regions.

Until a unified data-sharing protocol becomes widespread, device manufacturers will face elongated onboarding cycles, reduced device usage rates, and missed opportunities for real-time, AI-supported rhythm management-stalling overall market acceleration despite rising demand.

Opportunities

Integration with Virtual Cardiology Networks and AI-Backed Diagnostic Services

The rising prevalence of decentralized cardiology care is opening new opportunities in the cardiac rhythm remote monitoring devices market. Virtual cardiology networks consisting of telecardiology hubs, app-based follow-ups, and cloud-connected diagnostics are emerging as high-utility distribution channels for remote monitoring systems.

These setups prioritize devices capable of continuous rhythm surveillance, automatic arrhythmia classification, and real-time data transfer to centralized dashboards. Particularly in regions like North America and Southeast Asia, private cardiac care platforms are actively onboarding AI-integrated monitoring tools to enable diagnostic-as-a-service models. These models not only increase access to rhythm analysis in under-served areas but also allow device vendors to monetize insights, not just hardware.

There’s also rising potential for subscription-based partnerships, where manufacturers bundle devices with predictive analytics, maintenance, and user support. As virtual-first cardiac care expands, these integrated solutions present high-value, scalable opportunities for vendors to go beyond transactional sales and position themselves as clinical data partners.
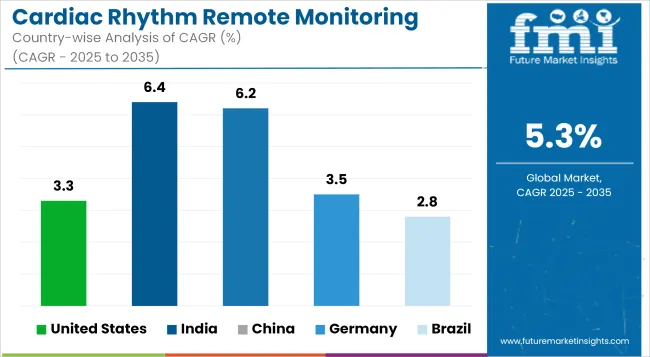
Country Wise Analysis

Cardiac Rhythm Remote Monitoring Devices Market Cagr Analysis By Country

United States

Market Outlook

The United States remains the most commercially mature market for cardiac rhythm remote monitoring devices, fueled by the nation’s aggressive adoption of digital cardiology services and chronic disease management platforms. Clinics, hospitals, and cardiology groups are prioritizing remote rhythm detection tools that integrate seamlessly into EMR systems and clinical dashboards.

AI-enhanced arrhythmia detection and real-time patient alerts are being used to improve care coordination and reduce rehospitalization rates. In addition, device providers are pushing innovations in wearable sensor comfort, wireless data syncing, and long-battery-life models. The rise of decentralized care, telecardiology, and at-home monitoring kits reflects the demand for more flexible patient engagement models.

Market Growth Factors

  • High Disease Burden: Atrial Natriuretic and other arrhythmias remain a major public health concern in aging USA populations, with increasing prevalence of heart disease.
  • Reimbursement-Driven Adoption: The expansion of coverage by both Medicare and private payers is a significant driver of RPM device adoption.
  • Clinical Workflow Integration: Widespread adoption of interoperable systems accelerates device utilization throughout hospitals and outpatient clinics.
  • AI-Powered Diagnostics: Increasing application of predictive analytics and artificial intelligence (AI) algorithms for rhythm detection for more accurate diagnosis and timely intervention.
  • Emergence of Direct-to-ConsumerModels: The workload of wearable ECGs and mobile-based monitoring solutions for preventive cardiology and fitness applications.
  • Increasing Focus on Preventative Care: The rising focus on proactive cardio health management, driven by early detection via wearable ECG devices, sustains demand.

Market Forecast

Country CAGR (2025 to 2035)
United States 3.3%

India

Market Outlook

India’s cardiac rhythm remote monitoring devices market is in a fast-growth phase, driven by the urbanization of healthcare and the expansion of private cardiology networks. The country is seeing rising demand for affordable, scalable monitoring solutions suited for high-volume cardiac outpatient loads.

Local manufacturers are developing cost-effective devices with simplified mobile connectivity and cloud backup to address infrastructure gaps. Meanwhile, telehealth adoption in tier-1 and tier-2 cities is enabling physicians to remotely track arrhythmias in post-operative and chronic care patients. The emphasis is on portable, user-friendly wearables that deliver uninterrupted rhythm data at a low operational cost.

Market Growth Factors

  • Urban Expansion of Cardiac Clinics: Rising outpatient loads in private heart hospitals and diagnostic centers fuel demand for continuous monitoring devices.
  • Affordable Device Development: Local firms offering low-cost, scalable monitors cater to middle-class and underserved populations.
  • Telehealth Synergy: The increasing integration of telecardiology and remote patient monitoring with mobile health apps enables wider access to heart health monitoring.
  • Rising Heart Disease Incidence: Cardiovascular diseases are becoming more prevalent, particularly in the younger population, driving the demand for early detection devices.
  • Mobile-First Monitoring: Devices optimized for app-based data review, offering a seamless experience for patients and healthcare providers.
  • Shift Toward Home Care: Growth in home healthcare and outpatient cardiac care is fueling the need for portable and remote monitoring solutions.

Market Forecast

Country CAGR (2025 to 2035)
India 6.4%

China

Market Outlook

China’s cardiac rhythm remote monitoring devices market is evolving quickly, backed by aggressive digital health infrastructure development and growing cardiovascular disease prevalence. Government incentives for AI-enabled medical devices are accelerating the introduction of smart ECG patches and handheld monitors.

Urban health tech startups and large hospital networks are experimenting with cloud-connected platforms that deliver continuous cardiac telemetry. Increasing demand from secondary cities has opened new channels for domestic device makers, who are focusing on producing affordable wearables optimized for local language apps and national data servers. The market is being shaped by a blend of public health strategies and consumer-driven demand for proactive cardiac diagnostics.

Market Growth Factors

  • Policy Support for Digital Health: The Chinese government’s focus on digital health innovation and AI integration drives the development of advanced cardiac monitoring solutions.
  • Urban Health Tech Adoption: Smart clinics and telemedicine platforms are increasingly adopting remote monitoring devices to meet growing patient demand for accessible heart care.
  • Expanding Middle-Class Demand: Rising disposable income and a focus on health and wellness are driving the need for early diagnosis and preventive monitoring devices.
  • Local Manufacturing Scale: Domestic manufacturers, bolstered by government incentives, are producing affordable, high-quality devices for both domestic and export markets.
  • Tier-2 & Tier-3 Penetration: Increased healthcare access in smaller cities and rural areas is pushing the demand for portable, cost-effective monitoring solutions.
  • Population Aging: The growing elderly population in China is fueling the demand for continuous cardiac monitoring to manage age-related heart conditions.

Market Forecast

Country CAGR (2025 to 2035)
China 6.2%

Germany

Market Outlook

Germany represents a highly structured and quality-sensitive market for cardiac rhythm remote monitoring devices, with strong clinical emphasis on diagnostic precision and compliance with EU health tech regulations. Hospitals and specialist cardiology centers increasingly rely on CE-certified continuous rhythm monitoring tools integrated with hospital information systems (HIS).

The shift toward home-based cardiac care, especially for elderly patients, is boosting demand for devices with remote data transmission and clinician alert features. Germany’s centralized reimbursement policies further encourage providers to adopt long-term monitoring systems for high-risk cardiovascular patients as part of post-discharge care pathways.

Market Growth Factors

  • High Regulatory Standards: Preference for CE-compliant, clinically validated devices that meet strict European health regulations.
  • Hospital-to-Home Care Shift: The move towards remote patient management and home-based cardiac care is creating a significant demand for long-term monitoring systems.
  • Advanced HIS Integration: Seamless integration with national health information systems enhances clinical adoption and ensures compliance with treatment protocols.
  • Aging Demographics: Germany’s aging population is increasingly requiring long-term cardiac monitoring for chronic conditions, especially arrhythmias.
  • Evidence-Based Care: Germany's clinical environment demands that all devices undergo rigorous clinical validation, increasing trust in remote monitoring technology.
  • Reimbursement Expansion: Insurance providers are increasingly covering remote monitoring services, making these devices more accessible and incentivizing adoption.

Market Forecast

Country CAGR (2025 to 2035)
Germany 3.5%

Brazil

Market Outlook

Brazil is emerging as a potential key point in the Latin America cardiac rhythm remote monitoring devices market driven by private sector expansion and increasing emphasis on remote cardiac diagnostic. Mobile-connected ECG Monitor Adoption Trend Cardiologists working at private clinics and diagnostic centers have adopted mobile-connected ECG monitors at a higher pace.

More patients at risk of arrhythmias are now being monitored at home, alleviating the burden of hospital admissions and enhancing the delivery of chronic care. Access is being extended, particularly in urban and semi-urban areas, through local distributors working alongside international brands to provide user-friendly, wearable monitoring solutions.

Market Growth Factors

  • Private Health Sector Growth: Expansion of the private healthcare sector, which is increasingly offering remote cardiac monitoring services, drives demand for these devices.
  • Portable Device Demand: There is rising demand for portable ECG monitors that offer easy-to-use, at-home monitoring, particularly in outpatient and post-discharge care settings.
  • Telecardiology Integration: The integration of remote diagnostics with telecardiology platforms is enhancing patient access and reducing hospital visits.
  • Distributor Networks: Strong local partnerships with international device manufacturers improve accessibility and increase market penetration.
  • Health Access Expansion: Initiatives that promote healthcare in underserved regions, especially through telemedicine, are helping improve cardiac care delivery.
  • Chronic Disease Prevalence: Growing rates of heart disease, especially in middle-aged populations, are pushing for widespread adoption of continuous monitoring solutions.

Market Forecast

Country CAGR (2025 to 2035)
Brazil 2.8%

Competitive Outlook

The global Cardiac Rhythm Remote Monitoring Devices Market is witnessing robust growth, driven by rising incidences of cardiovascular diseases, technological advancements in wearable and implantable devices, and increasing emphasis on remote patient management.

Major companies are focusing on innovation, AI-driven analytics, and integration with digital health platforms to gain competitive advantage. North America leads in market share, while Asia-Pacific shows high growth potential due to expanding healthcare infrastructure and adoption of remote monitoring technologies.

Companies

  • Medtronic Plc.
  • Abbott
  • Boston Scientific Corporation
  • GE Healthcare
  • Biotronik
  • Livanova Plc.
  • MEDICO S.p.A
  • Koninklijke Philips N.V
  • Hill-Rom Holdings
  • BioTelemetry Inc.
  • CardioDiagnostics
  • iRhythm Technologies

Key Segments 

By Product Type:

The market is segmented into Implantable Cardioverter Defibrillator (ICD) Devices, Implantable Defibrillator, External Defibrillator, Manual External Defibrillator, Automated External Defibrillator, Cardiac Resynchronization Therapy (CRT) Devices, Implantable Cardiac Monitors (ICMs), and Implanted Hemodynamic Monitor.

By Modality:

The market is segmented into Portable Devices and Non-Portable Devices.

By End User:

The market is segmented into Long-Term Care Centers, Specialized Clinics, and Hospitals.

By Region:

The Cardiac Rhythm Remote Monitoring Devices Market is analyzed across North America, Latin America, Western Europe, Eastern Europe, East Asia, South Asia & Pacific, and the Middle East & Africa.

Table of Content

  1. Executive Summary
  2. Industry Introduction, including Taxonomy and Market Definition
  3. Market Trends and Success Factors, including Macro-Economic Factors, Market Dynamics, and Recent Industry Developments
  4. Global Market Demand (Value in USD) and Volume (Absolute Units) Analysis 2020 to 2024 and Forecast 2025 to 2035, including Historical Analysis and Future Projections
  5. Global Market - Pricing Analysis
  6. Global Market Analysis 2020 to 2024 and Forecast 2025 to 2035
    • By Product
    • By Modality
    • By End User
    • By Region
  7. Global Market Analysis 2020 to 2024 and Forecast 2025 to 2035, By Product
    • Implantable Cardioverter Defibrillator (ICD) Devices
    • Implantable Defibrillator, External Defibrillator
    • Manual External Defibrillator
    • Automated External Defibrillator
    • Cardiac Resynchronization Therapy (CRT) Devices
    • Implantable Cardiac Monitors (ICMs)
    • Implanted Hemodynamic Monitor
  8. Global Market Analysis 2020 to 2024 and Forecast 2025 to 2035, By Modality
    • Portable Devices
    • Non-portable Devices
  9. Global Market Analysis 2020 to 2024 and Forecast 2025 to 2035, By End User
    • Long-term Care Centers
    • Specialized Clinics
    • Hospitals
  10. Global Market Analysis 2020 to 2024 and Forecast 2025 to 2035, By Region
    • North America
    • Latin America
    • Western Europe
    • Eastern Europe
    • South Asia & Pacific
    • East Asia
    • Middle East & Africa
  11. North America Sales Analysis 2020 to 2024 and Forecast 2025 to 2035, by Key Segments and Countries
  12. Latin America Sales Analysis 2020 to 2024 and Forecast 2025 to 2035, by Key Segments and Countries
  13. Western Europe Sales Analysis 2020 to 2024 and Forecast 2025 to 2035, by Key Segments and Countries
  14. Eastern Europe Sales Analysis 2020 to 2024 and Forecast 2025 to 2035, by Key Segments and Countries
  15. South Asia & Pacific Sales Analysis 2020 to 2024 and Forecast 2025 to 2035, by Key Segments and Countries
  16. East Asia Sales Analysis 2020 to 2024 and Forecast 2025 to 2035, by Key Segments and Countries
  17. Middle East and Africa Sales Analysis 2020 to 2024 and Forecast 2025 to 2035, by Key Segments and Countries
  18. Sales Forecast 2025 to 2035 By Product, By Modality and by End User for 30 Countries
  19. Competition Outlook, including Market Structure Analysis, Company Share Analysis by Key Players, and Competition Dashboard
  20. Company Profile
    • Medtronic
    • Abbott
    • Boston Scientific
    • BIOTRONIK
    • GE Healthcare
    • Philips Healthcare
    • AliveCor
    • iRhythm Technologies
    • Hillrom (Baxter)
    • Vectorius Medical Technologies
    • Bardy Diagnostics
    • MicroPort CRM

List of Tables

  • Table 1: Global Market Value (USD Million) Forecast by Region, 2020 to 2035
  • Table 2: Global Market Volume (Units) Forecast by Region, 2020 to 2035
  • Table 3: Global Market Value (USD Million) Forecast by Product Type, 2020 to 2035
  • Table 4: Global Market Volume (Units) Forecast by Product Type, 2020 to 2035
  • Table 5: Global Market Value (USD Million) Forecast by Modality, 2020 to 2035
  • Table 6: Global Market Volume (Units) Forecast by Modality, 2020 to 2035
  • Table 7: Global Market Value (USD Million) Forecast by End User, 2020 to 2035
  • Table 8: Global Market Volume (Units) Forecast by End User, 2020 to 2035
  • Table 9: North America Market Value (USD Million) Forecast by Country, 2020 to 2035
  • Table 10: North America Market Volume (Units) Forecast by Country, 2020 to 2035
  • Table 11: North America Market Value (USD Million) Forecast by Product Type, 2020 to 2035
  • Table 12: North America Market Volume (Units) Forecast by Product Type, 2020 to 2035
  • Table 13: North America Market Value (USD Million) Forecast by Modality, 2020 to 2035
  • Table 14: North America Market Volume (Units) Forecast by Modality, 2020 to 2035
  • Table 15: North America Market Value (USD Million) Forecast by End User, 2020 to 2035
  • Table 16: North America Market Volume (Units) Forecast by End User, 2020 to 2035
  • Table 17: Latin America Market Value (USD Million) Forecast by Country, 2020 to 2035
  • Table 18: Latin America Market Volume (Units) Forecast by Country, 2020 to 2035
  • Table 19: Latin America Market Value (USD Million) Forecast by Product Type, 2020 to 2035
  • Table 20: Latin America Market Volume (Units) Forecast by Product Type, 2020 to 2035
  • Table 21: Latin America Market Value (USD Million) Forecast by Modality, 2020 to 2035
  • Table 22: Latin America Market Volume (Units) Forecast by Modality, 2020 to 2035
  • Table 23: Latin America Market Value (USD Million) Forecast by End User, 2020 to 2035
  • Table 24: Latin America Market Volume (Units) Forecast by End User, 2020 to 2035
  • Table 25: Western Europe Market Value (USD Million) Forecast by Country, 2020 to 2035
  • Table 26: Western Europe Market Volume (Units) Forecast by Country, 2020 to 2035
  • Table 27: Western Europe Market Value (USD Million) Forecast by Product Type, 2020 to 2035
  • Table 28: Western Europe Market Volume (Units) Forecast by Product Type, 2020 to 2035
  • Table 29: Western Europe Market Value (USD Million) Forecast by Modality, 2020 to 2035
  • Table 30: Western Europe Market Volume (Units) Forecast by Modality, 2020 to 2035
  • Table 31: Western Europe Market Value (USD Million) Forecast by End User, 2020 to 2035
  • Table 32: Western Europe Market Volume (Units) Forecast by End User, 2020 to 2035
  • Table 33: Eastern Europe Market Value (USD Million) Forecast by Country, 2020 to 2035
  • Table 34: Eastern Europe Market Volume (Units) Forecast by Country, 2020 to 2035
  • Table 35: Eastern Europe Market Value (USD Million) Forecast by Product Type, 2020 to 2035
  • Table 36: Eastern Europe Market Volume (Units) Forecast by Product Type, 2020 to 2035
  • Table 37: Eastern Europe Market Value (USD Million) Forecast by Modality, 2020 to 2035
  • Table 38: Eastern Europe Market Volume (Units) Forecast by Modality, 2020 to 2035
  • Table 39: Eastern Europe Market Value (USD Million) Forecast by End User, 2020 to 2035
  • Table 40: Eastern Europe Market Volume (Units) Forecast by End User, 2020 to 2035
  • Table 41: South Asia and Pacific Market Value (USD Million) Forecast by Country, 2020 to 2035
  • Table 42: South Asia and Pacific Market Volume (Units) Forecast by Country, 2020 to 2035
  • Table 43: South Asia and Pacific Market Value (USD Million) Forecast by Product Type, 2020 to 2035
  • Table 44: South Asia and Pacific Market Volume (Units) Forecast by Product Type, 2020 to 2035
  • Table 45: South Asia and Pacific Market Value (USD Million) Forecast by Modality, 2020 to 2035
  • Table 46: South Asia and Pacific Market Volume (Units) Forecast by Modality, 2020 to 2035
  • Table 47: South Asia and Pacific Market Value (USD Million) Forecast by End User, 2020 to 2035
  • Table 48: South Asia and Pacific Market Volume (Units) Forecast by End User, 2020 to 2035
  • Table 49: East Asia Market Value (USD Million) Forecast by Country, 2020 to 2035
  • Table 50: East Asia Market Volume (Units) Forecast by Country, 2020 to 2035
  • Table 51: East Asia Market Value (USD Million) Forecast by Product Type, 2020 to 2035
  • Table 52: East Asia Market Volume (Units) Forecast by Product Type, 2020 to 2035
  • Table 53: East Asia Market Value (USD Million) Forecast by Modality, 2020 to 2035
  • Table 54: East Asia Market Volume (Units) Forecast by Modality, 2020 to 2035
  • Table 55: East Asia Market Value (USD Million) Forecast by End User, 2020 to 2035
  • Table 56: East Asia Market Volume (Units) Forecast by End User, 2020 to 2035
  • Table 57: Middle East and Africa Market Value (USD Million) Forecast by Country, 2020 to 2035
  • Table 58: Middle East and Africa Market Volume (Units) Forecast by Country, 2020 to 2035
  • Table 59: Middle East and Africa Market Value (USD Million) Forecast by Product Type, 2020 to 2035
  • Table 60: Middle East and Africa Market Volume (Units) Forecast by Product Type, 2020 to 2035
  • Table 61: Middle East and Africa Market Value (USD Million) Forecast by Modality, 2020 to 2035
  • Table 62: Middle East and Africa Market Volume (Units) Forecast by Modality, 2020 to 2035
  • Table 63: Middle East and Africa Market Value (USD Million) Forecast by End User, 2020 to 2035
  • Table 64: Middle East and Africa Market Volume (Units) Forecast by End User, 2020 to 2035

List of Figures

  • Figure 1: Global Market Value (USD Million) by Product Type, 2025 to 2035
  • Figure 2: Global Market Value (USD Million) by Modality, 2025 to 2035
  • Figure 3: Global Market Value (USD Million) by End User, 2025 to 2035
  • Figure 4: Global Market Value (USD Million) by Region, 2025 to 2035
  • Figure 5: Global Market Value (USD Million) Analysis by Region, 2020 to 2035
  • Figure 6: Global Market Volume (Units) Analysis by Region, 2020 to 2035
  • Figure 7: Global Market Value Share (%) and BPS Analysis by Region, 2025 to 2035
  • Figure 8: Global Market Y-o-Y Growth (%) Projections by Region, 2025 to 2035
  • Figure 9: Global Market Value (USD Million) Analysis by Product Type, 2020 to 2035
  • Figure 10: Global Market Volume (Units) Analysis by Product Type, 2020 to 2035
  • Figure 11: Global Market Value Share (%) and BPS Analysis by Product Type, 2025 to 2035
  • Figure 12: Global Market Y-o-Y Growth (%) Projections by Product Type, 2025 to 2035
  • Figure 13: Global Market Value (USD Million) Analysis by Modality, 2020 to 2035
  • Figure 14: Global Market Volume (Units) Analysis by Modality, 2020 to 2035
  • Figure 15: Global Market Value Share (%) and BPS Analysis by Modality, 2025 to 2035
  • Figure 16: Global Market Y-o-Y Growth (%) Projections by Modality, 2025 to 2035
  • Figure 17: Global Market Value (USD Million) Analysis by End User, 2020 to 2035
  • Figure 18: Global Market Volume (Units) Analysis by End User, 2020 to 2035
  • Figure 19: Global Market Value Share (%) and BPS Analysis by End User, 2025 to 2035
  • Figure 20: Global Market Y-o-Y Growth (%) Projections by End User, 2025 to 2035
  • Figure 21: Global Market Attractiveness by Product Type, 2025 to 2035
  • Figure 22: Global Market Attractiveness by Modality, 2025 to 2035
  • Figure 23: Global Market Attractiveness by End User, 2025 to 2035
  • Figure 24: Global Market Attractiveness by Region, 2025 to 2035
  • Figure 25: North America Market Value (USD Million) by Product Type, 2025 to 2035
  • Figure 26: North America Market Value (USD Million) by Modality, 2025 to 2035
  • Figure 27: North America Market Value (USD Million) by End User, 2025 to 2035
  • Figure 28: North America Market Value (USD Million) by Country, 2025 to 2035
  • Figure 29: North America Market Value (USD Million) Analysis by Country, 2020 to 2035
  • Figure 30: North America Market Volume (Units) Analysis by Country, 2020 to 2035
  • Figure 31: North America Market Value Share (%) and BPS Analysis by Country, 2025 to 2035
  • Figure 32: North America Market Y-o-Y Growth (%) Projections by Country, 2025 to 2035
  • Figure 33: North America Market Value (USD Million) Analysis by Product Type, 2020 to 2035
  • Figure 34: North America Market Volume (Units) Analysis by Product Type, 2020 to 2035
  • Figure 35: North America Market Value Share (%) and BPS Analysis by Product Type, 2025 to 2035
  • Figure 36: North America Market Y-o-Y Growth (%) Projections by Product Type, 2025 to 2035
  • Figure 37: North America Market Value (USD Million) Analysis by Modality, 2020 to 2035
  • Figure 38: North America Market Volume (Units) Analysis by Modality, 2020 to 2035
  • Figure 39: North America Market Value Share (%) and BPS Analysis by Modality, 2025 to 2035
  • Figure 40: North America Market Y-o-Y Growth (%) Projections by Modality, 2025 to 2035
  • Figure 41: North America Market Value (USD Million) Analysis by End User, 2020 to 2035
  • Figure 42: North America Market Volume (Units) Analysis by End User, 2020 to 2035
  • Figure 43: North America Market Value Share (%) and BPS Analysis by End User, 2025 to 2035
  • Figure 44: North America Market Y-o-Y Growth (%) Projections by End User, 2025 to 2035
  • Figure 45: North America Market Attractiveness by Product Type, 2025 to 2035
  • Figure 46: North America Market Attractiveness by Modality, 2025 to 2035
  • Figure 47: North America Market Attractiveness by End User, 2025 to 2035
  • Figure 48: North America Market Attractiveness by Country, 2025 to 2035
  • Figure 49: Latin America Market Value (USD Million) by Product Type, 2025 to 2035
  • Figure 50: Latin America Market Value (USD Million) by Modality, 2025 to 2035
  • Figure 51: Latin America Market Value (USD Million) by End User, 2025 to 2035
  • Figure 52: Latin America Market Value (USD Million) by Country, 2025 to 2035
  • Figure 53: Latin America Market Value (USD Million) Analysis by Country, 2020 to 2035
  • Figure 54: Latin America Market Volume (Units) Analysis by Country, 2020 to 2035
  • Figure 55: Latin America Market Value Share (%) and BPS Analysis by Country, 2025 to 2035
  • Figure 56: Latin America Market Y-o-Y Growth (%) Projections by Country, 2025 to 2035
  • Figure 57: Latin America Market Value (USD Million) Analysis by Product Type, 2020 to 2035
  • Figure 58: Latin America Market Volume (Units) Analysis by Product Type, 2020 to 2035
  • Figure 59: Latin America Market Value Share (%) and BPS Analysis by Product Type, 2025 to 2035
  • Figure 60: Latin America Market Y-o-Y Growth (%) Projections by Product Type, 2025 to 2035
  • Figure 61: Latin America Market Value (USD Million) Analysis by Modality, 2020 to 2035
  • Figure 62: Latin America Market Volume (Units) Analysis by Modality, 2020 to 2035
  • Figure 63: Latin America Market Value Share (%) and BPS Analysis by Modality, 2025 to 2035
  • Figure 64: Latin America Market Y-o-Y Growth (%) Projections by Modality, 2025 to 2035
  • Figure 65: Latin America Market Value (USD Million) Analysis by End User, 2020 to 2035
  • Figure 66: Latin America Market Volume (Units) Analysis by End User, 2020 to 2035
  • Figure 67: Latin America Market Value Share (%) and BPS Analysis by End User, 2025 to 2035
  • Figure 68: Latin America Market Y-o-Y Growth (%) Projections by End User, 2025 to 2035
  • Figure 69: Latin America Market Attractiveness by Product Type, 2025 to 2035
  • Figure 70: Latin America Market Attractiveness by Modality, 2025 to 2035
  • Figure 71: Latin America Market Attractiveness by End User, 2025 to 2035
  • Figure 72: Latin America Market Attractiveness by Country, 2025 to 2035
  • Figure 73: Western Europe Market Value (USD Million) by Product Type, 2025 to 2035
  • Figure 74: Western Europe Market Value (USD Million) by Modality, 2025 to 2035
  • Figure 75: Western Europe Market Value (USD Million) by End User, 2025 to 2035
  • Figure 76: Western Europe Market Value (USD Million) by Country, 2025 to 2035
  • Figure 77: Western Europe Market Value (USD Million) Analysis by Country, 2020 to 2035
  • Figure 78: Western Europe Market Volume (Units) Analysis by Country, 2020 to 2035
  • Figure 79: Western Europe Market Value Share (%) and BPS Analysis by Country, 2025 to 2035
  • Figure 80: Western Europe Market Y-o-Y Growth (%) Projections by Country, 2025 to 2035
  • Figure 81: Western Europe Market Value (USD Million) Analysis by Product Type, 2020 to 2035
  • Figure 82: Western Europe Market Volume (Units) Analysis by Product Type, 2020 to 2035
  • Figure 83: Western Europe Market Value Share (%) and BPS Analysis by Product Type, 2025 to 2035
  • Figure 84: Western Europe Market Y-o-Y Growth (%) Projections by Product Type, 2025 to 2035
  • Figure 85: Western Europe Market Value (USD Million) Analysis by Modality, 2020 to 2035
  • Figure 86: Western Europe Market Volume (Units) Analysis by Modality, 2020 to 2035
  • Figure 87: Western Europe Market Value Share (%) and BPS Analysis by Modality, 2025 to 2035
  • Figure 88: Western Europe Market Y-o-Y Growth (%) Projections by Modality, 2025 to 2035
  • Figure 89: Western Europe Market Value (USD Million) Analysis by End User, 2020 to 2035
  • Figure 90: Western Europe Market Volume (Units) Analysis by End User, 2020 to 2035
  • Figure 91: Western Europe Market Value Share (%) and BPS Analysis by End User, 2025 to 2035
  • Figure 92: Western Europe Market Y-o-Y Growth (%) Projections by End User, 2025 to 2035
  • Figure 93: Western Europe Market Attractiveness by Product Type, 2025 to 2035
  • Figure 94: Western Europe Market Attractiveness by Modality, 2025 to 2035
  • Figure 95: Western Europe Market Attractiveness by End User, 2025 to 2035
  • Figure 96: Western Europe Market Attractiveness by Country, 2025 to 2035
  • Figure 97: Eastern Europe Market Value (USD Million) by Product Type, 2025 to 2035
  • Figure 98: Eastern Europe Market Value (USD Million) by Modality, 2025 to 2035
  • Figure 99: Eastern Europe Market Value (USD Million) by End User, 2025 to 2035
  • Figure 100: Eastern Europe Market Value (USD Million) by Country, 2025 to 2035
  • Figure 101: Eastern Europe Market Value (USD Million) Analysis by Country, 2020 to 2035
  • Figure 102: Eastern Europe Market Volume (Units) Analysis by Country, 2020 to 2035
  • Figure 103: Eastern Europe Market Value Share (%) and BPS Analysis by Country, 2025 to 2035
  • Figure 104: Eastern Europe Market Y-o-Y Growth (%) Projections by Country, 2025 to 2035
  • Figure 105: Eastern Europe Market Value (USD Million) Analysis by Product Type, 2020 to 2035
  • Figure 106: Eastern Europe Market Volume (Units) Analysis by Product Type, 2020 to 2035
  • Figure 107: Eastern Europe Market Value Share (%) and BPS Analysis by Product Type, 2025 to 2035
  • Figure 108: Eastern Europe Market Y-o-Y Growth (%) Projections by Product Type, 2025 to 2035
  • Figure 109: Eastern Europe Market Value (USD Million) Analysis by Modality, 2020 to 2035
  • Figure 110: Eastern Europe Market Volume (Units) Analysis by Modality, 2020 to 2035
  • Figure 111: Eastern Europe Market Value Share (%) and BPS Analysis by Modality, 2025 to 2035
  • Figure 112: Eastern Europe Market Y-o-Y Growth (%) Projections by Modality, 2025 to 2035
  • Figure 113: Eastern Europe Market Value (USD Million) Analysis by End User, 2020 to 2035
  • Figure 114: Eastern Europe Market Volume (Units) Analysis by End User, 2020 to 2035
  • Figure 115: Eastern Europe Market Value Share (%) and BPS Analysis by End User, 2025 to 2035
  • Figure 116: Eastern Europe Market Y-o-Y Growth (%) Projections by End User, 2025 to 2035
  • Figure 117: Eastern Europe Market Attractiveness by Product Type, 2025 to 2035
  • Figure 118: Eastern Europe Market Attractiveness by Modality, 2025 to 2035
  • Figure 119: Eastern Europe Market Attractiveness by End User, 2025 to 2035
  • Figure 120: Eastern Europe Market Attractiveness by Country, 2025 to 2035
  • Figure 121: South Asia and Pacific Market Value (USD Million) by Product Type, 2025 to 2035
  • Figure 122: South Asia and Pacific Market Value (USD Million) by Modality, 2025 to 2035
  • Figure 123: South Asia and Pacific Market Value (USD Million) by End User, 2025 to 2035
  • Figure 124: South Asia and Pacific Market Value (USD Million) by Country, 2025 to 2035
  • Figure 125: South Asia and Pacific Market Value (USD Million) Analysis by Country, 2020 to 2035
  • Figure 126: South Asia and Pacific Market Volume (Units) Analysis by Country, 2020 to 2035
  • Figure 127: South Asia and Pacific Market Value Share (%) and BPS Analysis by Country, 2025 to 2035
  • Figure 128: South Asia and Pacific Market Y-o-Y Growth (%) Projections by Country, 2025 to 2035
  • Figure 129: South Asia and Pacific Market Value (USD Million) Analysis by Product Type, 2020 to 2035
  • Figure 130: South Asia and Pacific Market Volume (Units) Analysis by Product Type, 2020 to 2035
  • Figure 131: South Asia and Pacific Market Value Share (%) and BPS Analysis by Product Type, 2025 to 2035
  • Figure 132: South Asia and Pacific Market Y-o-Y Growth (%) Projections by Product Type, 2025 to 2035
  • Figure 133: South Asia and Pacific Market Value (USD Million) Analysis by Modality, 2020 to 2035
  • Figure 134: South Asia and Pacific Market Volume (Units) Analysis by Modality, 2020 to 2035
  • Figure 135: South Asia and Pacific Market Value Share (%) and BPS Analysis by Modality, 2025 to 2035
  • Figure 136: South Asia and Pacific Market Y-o-Y Growth (%) Projections by Modality, 2025 to 2035
  • Figure 137: South Asia and Pacific Market Value (USD Million) Analysis by End User, 2020 to 2035
  • Figure 138: South Asia and Pacific Market Volume (Units) Analysis by End User, 2020 to 2035
  • Figure 139: South Asia and Pacific Market Value Share (%) and BPS Analysis by End User, 2025 to 2035
  • Figure 140: South Asia and Pacific Market Y-o-Y Growth (%) Projections by End User, 2025 to 2035
  • Figure 141: South Asia and Pacific Market Attractiveness by Product Type, 2025 to 2035
  • Figure 142: South Asia and Pacific Market Attractiveness by Modality, 2025 to 2035
  • Figure 143: South Asia and Pacific Market Attractiveness by End User, 2025 to 2035
  • Figure 144: South Asia and Pacific Market Attractiveness by Country, 2025 to 2035
  • Figure 145: East Asia Market Value (USD Million) by Product Type, 2025 to 2035
  • Figure 146: East Asia Market Value (USD Million) by Modality, 2025 to 2035
  • Figure 147: East Asia Market Value (USD Million) by End User, 2025 to 2035
  • Figure 148: East Asia Market Value (USD Million) by Country, 2025 to 2035
  • Figure 149: East Asia Market Value (USD Million) Analysis by Country, 2020 to 2035
  • Figure 150: East Asia Market Volume (Units) Analysis by Country, 2020 to 2035
  • Figure 151: East Asia Market Value Share (%) and BPS Analysis by Country, 2025 to 2035
  • Figure 152: East Asia Market Y-o-Y Growth (%) Projections by Country, 2025 to 2035
  • Figure 153: East Asia Market Value (USD Million) Analysis by Product Type, 2020 to 2035
  • Figure 154: East Asia Market Volume (Units) Analysis by Product Type, 2020 to 2035
  • Figure 155: East Asia Market Value Share (%) and BPS Analysis by Product Type, 2025 to 2035
  • Figure 156: East Asia Market Y-o-Y Growth (%) Projections by Product Type, 2025 to 2035
  • Figure 157: East Asia Market Value (USD Million) Analysis by Modality, 2020 to 2035
  • Figure 158: East Asia Market Volume (Units) Analysis by Modality, 2020 to 2035
  • Figure 159: East Asia Market Value Share (%) and BPS Analysis by Modality, 2025 to 2035
  • Figure 160: East Asia Market Y-o-Y Growth (%) Projections by Modality, 2025 to 2035
  • Figure 161: East Asia Market Value (USD Million) Analysis by End User, 2020 to 2035
  • Figure 162: East Asia Market Volume (Units) Analysis by End User, 2020 to 2035
  • Figure 163: East Asia Market Value Share (%) and BPS Analysis by End User, 2025 to 2035
  • Figure 164: East Asia Market Y-o-Y Growth (%) Projections by End User, 2025 to 2035
  • Figure 165: East Asia Market Attractiveness by Product Type, 2025 to 2035
  • Figure 166: East Asia Market Attractiveness by Modality, 2025 to 2035
  • Figure 167: East Asia Market Attractiveness by End User, 2025 to 2035
  • Figure 168: East Asia Market Attractiveness by Country, 2025 to 2035
  • Figure 169: Middle East and Africa Market Value (USD Million) by Product Type, 2025 to 2035
  • Figure 170: Middle East and Africa Market Value (USD Million) by Modality, 2025 to 2035
  • Figure 171: Middle East and Africa Market Value (USD Million) by End User, 2025 to 2035
  • Figure 172: Middle East and Africa Market Value (USD Million) by Country, 2025 to 2035
  • Figure 173: Middle East and Africa Market Value (USD Million) Analysis by Country, 2020 to 2035
  • Figure 174: Middle East and Africa Market Volume (Units) Analysis by Country, 2020 to 2035
  • Figure 175: Middle East and Africa Market Value Share (%) and BPS Analysis by Country, 2025 to 2035
  • Figure 176: Middle East and Africa Market Y-o-Y Growth (%) Projections by Country, 2025 to 2035
  • Figure 177: Middle East and Africa Market Value (USD Million) Analysis by Product Type, 2020 to 2035
  • Figure 178: Middle East and Africa Market Volume (Units) Analysis by Product Type, 2020 to 2035
  • Figure 179: Middle East and Africa Market Value Share (%) and BPS Analysis by Product Type, 2025 to 2035
  • Figure 180: Middle East and Africa Market Y-o-Y Growth (%) Projections by Product Type, 2025 to 2035
  • Figure 181: Middle East and Africa Market Value (USD Million) Analysis by Modality, 2020 to 2035
  • Figure 182: Middle East and Africa Market Volume (Units) Analysis by Modality, 2020 to 2035
  • Figure 183: Middle East and Africa Market Value Share (%) and BPS Analysis by Modality, 2025 to 2035
  • Figure 184: Middle East and Africa Market Y-o-Y Growth (%) Projections by Modality, 2025 to 2035
  • Figure 185: Middle East and Africa Market Value (USD Million) Analysis by End User, 2020 to 2035
  • Figure 186: Middle East and Africa Market Volume (Units) Analysis by End User, 2020 to 2035
  • Figure 187: Middle East and Africa Market Value Share (%) and BPS Analysis by End User, 2025 to 2035
  • Figure 188: Middle East and Africa Market Y-o-Y Growth (%) Projections by End User, 2025 to 2035
  • Figure 189: Middle East and Africa Market Attractiveness by Product Type, 2025 to 2035
  • Figure 190: Middle East and Africa Market Attractiveness by Modality, 2025 to 2035
  • Figure 191: Middle East and Africa Market Attractiveness by End User, 2025 to 2035
  • Figure 192: Middle East and Africa Market Attractiveness by Country, 2025 to 2035

Frequently Asked Questions

What was the overall size of the Cardiac Rhythm Remote Monitoring Devices Market in 2025?

The overall market size for cardiac rhythm remote monitoring devices market was USD 5.3 billion in 2025.

How big is the Cardiac Rhythm Remote Monitoring Devices Market expected in 2035?

The cardiac rhythm remote monitoring devices market is expected to reach USD 8.8 billion in 2035.

What will drive the demand for Cardiac Rhythm Remote Monitoring Devices Market during the forecast period?

Integration of AI-powered analytics into remote monitoring platforms is enhancing diagnostic precision, making these devices essential tools in modern cardiology workflows.

List the top 5 Key players of the Cardiac Rhythm Remote Monitoring Devices Market?

The top key players that drives the development of cardiac rhythm remote monitoring devices market are Medtronic, Abbott, Boston Scientific, BIOTRONIK and GE Healthcare.

Which segment in product is expected to lead in Cardiac Rhythm Remote Monitoring Devices Market?

Implantable cardioverter defibrillator (ICD) devices is expected to command significant share over the assessment period.

Explore Similar Insights

Future Market Insights

Cardiac Rhythm Remote Monitoring Devices Market