The Cardiac Rehabilitation market is experiencing steady growth driven by the increasing prevalence of cardiovascular diseases and the rising awareness of preventive and post-treatment care. The future outlook for this market is shaped by technological advancements in monitoring devices, digital health solutions, and telemedicine platforms that enhance patient engagement and adherence to rehabilitation programs. Growing investments in healthcare infrastructure and the expansion of outpatient cardiac care services are supporting market growth.
Additionally, the aging population and lifestyle-related risk factors such as hypertension, obesity, and sedentary habits are driving demand for structured cardiac rehabilitation programs. Government initiatives and clinical guidelines emphasizing the importance of continuous cardiac care post-surgery or after cardiac events are further strengthening market adoption.
The integration of remote monitoring and personalized rehabilitation plans is expected to enhance the quality of care while reducing hospital readmissions With the increasing focus on data-driven health interventions and preventive cardiology, the Cardiac Rehabilitation market is poised for sustained expansion across both developed and emerging regions.

| Metric | Value |
|---|---|
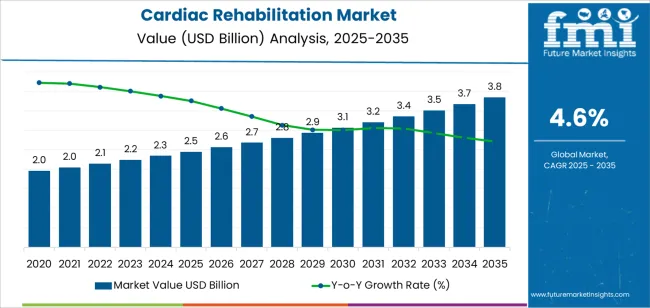
| Cardiac Rehabilitation Market Estimated Value in (2025 E) | USD 2.5 billion |
| Cardiac Rehabilitation Market Forecast Value in (2035 F) | USD 3.8 billion |
| Forecast CAGR (2025 to 2035) | 4.6% |
The market is segmented by Product and region. By Product, the market is divided into Blood Pressure Monitors, Ellipticals, Stabilization Balls, Stationary Balls, Treadmills, Heart Rate Monitors, Rovers, and Others. Regionally, the market is classified into North America, Latin America, Western Europe, Eastern Europe, Balkan & Baltic Countries, Russia & Belarus, Central Asia, East Asia, South Asia & Pacific, and the Middle East & Africa.

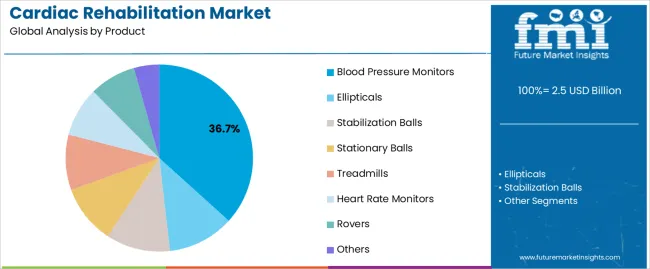
The blood pressure monitors product segment is projected to hold 36.70% of the Cardiac Rehabilitation market revenue share in 2025, establishing it as the leading product type. This dominance has been driven by the critical role these devices play in monitoring cardiovascular health and enabling timely intervention. The segment has benefited from advancements in digital monitoring technology, including automated, wireless, and wearable devices that allow continuous and remote patient tracking.
High demand for home-based rehabilitation solutions and telehealth integration has reinforced the adoption of blood pressure monitors, as they facilitate real-time data sharing with healthcare providers. The growing emphasis on preventive cardiology and early detection of complications has further supported the segment’s growth.
Additionally, the ease of use, portability, and accuracy of modern blood pressure monitors have made them indispensable in both clinical and home settings The integration of smart features such as data logging, alerts, and connectivity with mobile health applications is expected to continue driving the segment’s market dominance and revenue contribution.
The table below offers a comparative analysis of the Compound Annual Growth Rate (CAGR) fluctuations for the global cardiac rehabilitation market between the base year (2025) and the current year (2025) over six months.
This examination uncovers significant changes in market performance and highlights trends in revenue generation, giving stakeholders valuable insights into the market’s growth trajectory throughout the year. The first half (H1) encompasses January through June, while the second half (H2) covers July through December.
In the first half (H1) of the decade from 2025 to 2035, the business is predicted to surge at a CAGR of 5.5%, followed by a slightly lower growth rate of 5.2% in the second half (H2) of the same decade.
| Particular | Value CAGR |
|---|---|
| H1 | 5.5% (2025 to 2035) |
| H2 | 5.2% (2025 to 2035) |
| H1 | 4.6% (2025 to 2035) |
| H2 | 4.2% (2025 to 2035) |
Moving into the subsequent period, from H1 2025 to H2 2035, the CAGR is projected to decrease slightly to 4.6% in the first half and remain relatively moderate at 4.2% in the second half. In the first half (H1) the market witnessed a decrease of 90 BPS while in the second half (H2), the market witnessed a decrease of 100 BPS.
The rising Incidence of Cardiovascular Diseases (CVD) drives the Cardiac Rehabilitation Market
CVD has consistently topped the list of the most common causes of death worldwide the millions who suffer from heart attacks and strokes continue to clamor for effective rehabilitative services. This rise can be attributed to several factors, including changes in lifestyle, an aging population, and the presence of risk factors such as obesity, hypertension, and diabetes in preponderance.
The increasing realization regarding the importance of cardiac rehabilitation in better recovery has also acted as a market expansion driver. Rehabilitation programs play a role in guiding patients to regain their physical health and in managing symptoms and avoidance of further cardiovascular events. This is achieved through personalized exercise regimens, nutritional guidance, and lifestyle modification education and constitutes vital long-term health management.
In addition, there is a realization of the economic burden that CVD entails on societies in the healthcare systems. Investment by healthcare providers in the field of cardiac rehabilitation leads to the lowering of readmissions to hospitals, which are cost burdens and thus the best allocation of resources.
Such realization has led to various governments and organizational efforts in the inclusion of these rehabilitation services in the mainstream of comprehensive care for CVD patients. Therefore, the growing incidence of CVD acts as one of the major drivers for the growth of this cardiac rehabilitation market.
Innovations in Mobile Applications, Wearable Technologies, and Telehealth Solutions Fueled the Market Growth
Mobile applications, wearable technologies, and telehealth solutions have vastly enhanced the delivery of individual cardiac rehabilitation at the fingertips of patients, engaging them in their recovery. These technological advances have improved most of the barriers that traditionally impede patient participation in rehabilitation programs: accessibility, convenience, and lack of personalization.
It is particularly in the field of mobile apps that new, strong tools have come about to improve adherence to cardiac rehabilitation. Studies have shown that simply providing patients with app-based rehabilitation an option besides the traditional programs involving in-person visits significantly increases participation rates.
Such apps make possible all manner of functions personalized to the needs of the individual: guided exercise, reminding one of medication intake, real-time feedback about progress, and many more. Wearable devices, activity trackers, and heart rate monitors help to further personalize rehabilitation plans by making them with objective data on the performance of patients.
Adoption of Telehealth have been instrumental to a great extent in scaling up access to cardiac rehabilitation among geriatric and rural populations facing barriers to attending in-person sessions in many healthcare facilities. Remote-monitoring and virtual tele-consultations have provided an avenue for patients to participate in rehabilitation session with comfort of their own homes, reducing the burden of travel and scheduling conflicts.
These technological innovations have moreover facilitated the delivery of more comprehensive and effective rehabilitation programs by healthcare providers. With the help of mobile apps and wearable devices, providers may track progress closely, recognize deficiencies, and make effective changes in the rehabilitation plan. These are innovations that, certainly, will further fuel growth in the cardiac rehabilitation market as they continue to evolve and diffuse.
Government Initiative and Awareness Campaign Have Bolstered the Cardiac Rehabilitation Market Expansion
Cardiovascular disease burden is increasing throughout the world this has led to increased demand for effective rehabilitation services. Thus governments of many countries are investing to foster the growth of cardiac rehabilitation services.
A rise in the adoption of cardiac rehabilitation will drastically bring down the readmission of patients and thus aid in reducing the healthcare cost. CDC and the Centers for Medicare & Medicaid Services have introduced Million Heart 2035 a Nationwide Initiative. The initiative aims to prevent over 1 million heart attacks over 5 years.
The top 3 areas that are recognized include, reducing tobacco use, as it contributes to the cardiovascular disease. Physical activity is being promoted to improve the cardiac capacity and improved the overall cardiac health. People are expected to be mindful of their environment and avoid being exposed to air pollution.
Also, the program aims to manage the proper use of aspirin and other anticoagulant. Monitoring the blood pressure and cholesterol level. Simultaneously the adoption of cardiac rehabilitation among patients is increased among the patients having a history of heart attack or other complications.
Large part of the population is unable to maintain good health due to their schedule, lifestyle, and surrounding environment. This challenge is realized by Million Hearts 2035, which is working to reduce this gap.
Government support, either through funding, awareness campaigns, or policy initiatives for cardiac rehabilitation services, results in better outcomes in heart health and a reduced burden of cardiovascular diseases. Such long-term commitment contributed to the adoption of cardiac rehabilitation.
High Equipment Cost challenges the market growth of Cardiac Rehabilitation
It is envisaged that exorbitant prices for advanced cardiac rehabilitation equipment will no doubt forestall healthcare facilities from effortlessly offering cardiac rehabilitation services. With the surging incidences of cardiovascular diseases, driving up demands for cardiac rehabilitation, the financial burden in terms of acquiring or maintaining sophisticated devices for rehabilitation is increased.
Healthcare facilities, particularly those in lower-income regions or smaller practices, may struggle to afford the latest equipment. To stay within the budget, facilities will resort to less efficient or outdated equipment. Patients will not receive quality rehabilitation services since there may not be access to the best facilities for them to recover after cardiac events.
The costs associated with rehabilitation equipment are not only about the price of purchase. The facility has to consider other expenditures: continuous maintenance, training of personnel, and operation costs that drain budgets further. Such financial burdens discourage healthcare providers from investing hugely in a comprehensive cardiac rehabilitation program, consequently impacting market growth.
The cardiac rehabilitation industry recorded a CAGR of 4.6% between 2020 and 2025. According to the industry, cardiac rehabilitation generated USD 2,240.4 million in 2025, up from USD 1,845.9 million in 2020.
Traditionally cardiac rehabilitation programs were conducted as in-person sessions. This involved trained professionals guiding the patients for exercise, education, and lifestyle modification. However, these programs were not accessible to all eligible patients. The main reasons contributing to this were geographical barriers, high costs, and a shortage of trained professionals.
The trend these days is more towards innovative and accessible rehabilitation solutions. Cardiac rehabilitation delivery has been drastically changed by the adoption of technology in terms of telehealth and mobile applications, specifically with developments allowing remote monitoring and virtual consultations for easier recovery from the comfort of one's home.
It not only overcomes distance and time barriers, but it serves a broader demography of people who have some sort of impairment in movement or live in rural areas.
Looking ahead, such a highly individualized approach to the rehabilitation process will be a market looking forward to using data analytics and wearable technologies to further personalize the programs for patients. The increased establishment of ICRs, as a program focusing on higher frequency and intensity of care, has also coincided with this evolution toward more universal and holistic methods of rehabilitation.
This has been huge in the cardiac rehabilitation landscape for a shift away from traditional methods to a much more innovative and technology-driven solution, with huge improvements in accessibility and outcomes for patients.
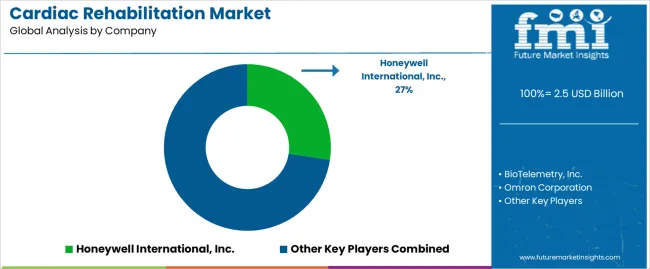
Companies in the Tier 1 sector account for 60.9% of the global market, ranking them as the dominant players in the industry. Tier 1 players offer a wide range of products related to cardiac rehabilitation culture, have an established industry presence, offer continuous innovation, and have a significant influence in the field.
Having financial resources enables them to enhance their research and development efforts and expand into new markets. A strong brand recognition and a loyal customer base provide them with a competitive advantage. Prominent companies within Tier 1 include Honeywell International, Inc., Omron Corporation, and GE Healthcare.
Tier 2 players dominate the industry with a 28.9% market share. Tier 2 firms have a strong focus on a specific technology and a substantial presence in the industry, but they have less influence than Tier 1 firms.
The players are more competitive when it comes to pricing and target niche markets. New products and services will also be introduced into the industry by Tier 2 companies. Tier 2 companies include Smiths Group, BioTelemetry, Inc., and Core Health & Fitness, LLC among others.
Compared to Tiers 1 and 2, Tier 3 companies have smaller revenue spouts and less influence. Those in Tier 3 have smaller workforce and limited presence across the globe. Prominent players in the tier 3 category are Brunswick Corporation and Halma plc.
The section below covers the industry analysis of the cardiac rehabilitation market for different countries. Market demand analysis on key countries in several regions of the globe, including North America, Latin America, East Asia, South Asia, Western Europe, Eastern Europe, and Middle East and Africa (MEA), is provided.
The United States is anticipated to remain at the forefront in North America, with a value share of 78.6% through 2035. In Asia Pacific, India is projected to witness a CAGR of 4.6% by 2035.
| Countries | Value CAGR (2025 to 2035) |
|---|---|
| Canada | 3.5% |
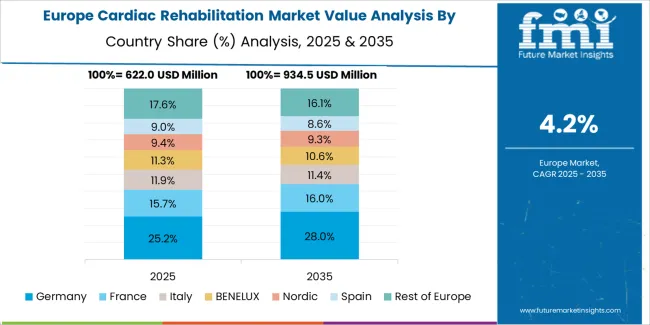
| Germany | 2.0% |
| France | 3.3% |
| Italy | 3.0% |
| China | 6.5% |
| India | 4.6% |
| Japan | 2.7% |
The USA cardiac rehabilitation industry is expected to grow at 7.5% CAGR from 2025 to 2035. The United States has a high prevalence of cardiovascular diseases such as heart attacks. The country's Medicare provides positive reimbursement for cardiac rehabilitation programs.
Acceptance of advanced technologies, for instance, AI and IoT-enabled cardiac rehabilitation devices, are expected to contribute significantly. Other prominent factors which will influence this growth in the cardiac rehabilitation market are initiatives towards prevention of cardiac arrest and strokes by the USA government.
The USA market consists of major technology providers, including GE Healthcare, Koninklijke Philips N.V., Omron Corporation, Core Health & Fitness, LLC, and Technogym. Product innovations and the launch of new products have been the mainstay business strategy of these companies to meet the growing demand for cardiac rehabilitation solutions in the USA market.
Rising number of cases with lifestyle disorders, technological transformation in the CVD space are some factors that is instrumental towards the demand for cardiac rehabilitation systems in the United States. Further, several benefits associated with cardiac rehabilitation tools, such as real-time monitoring of heart rate and blood pressure, boost sales. All these factors are expected to simultaneously push the market growth in the United States.

Germany is characterized by an increasing aging population, which is more susceptible to cardiovascular diseases. As the number of elderly individuals rises, the demand for effective rehabilitation programs to support recovery from heart-related conditions also increases.
The German system of health care has traditionally been very strong in preventive care and rehabilitation. Government initiatives in promoting cardiovascular health are very good, and a number of healthcare providers have adopted comprehensive cardiac rehabilitation programs that find a place within the framework of this healthcare system.
That means appropriate backup is given to the patients after cardiac events. This, to a large extent, is very critical in terms of long-term health outcomes.
Germany has a very well-established infrastructure in health care and includes many specialized facilities with the possibility of conducting cardiac rehabilitation. Cardiac rehabilitation in Germany presupposes teamwork by a rehabilitation specialist together with highly specialized doctors: cardiologists, physiotherapists, massage therapists, and exercise therapy instructors.
Each program is individually tailored and constantly updated according to the condition of the cardiovascular and musculoskeletal systems, initial exercise tolerance, and the progress achieved in training. For patients with coronary artery disease, the intensity of exercise should always be below the ischemic threshold.
This infrastructure eases the delivery of quality care with specifications for each patient's needs. Medical technology in this country is also developing and inputs into the effectiveness of these rehabilitation programs. Some of these innovations include telemedicine and remote monitoring tools that help manage patients individually and provide better engagement, whereby truly Germany, by undertaking comprehensive rehabilitation services, is a leader in cardiac rehabilitation.
A CAGR of 6.5% is predicted for the forecast period. There is a rise in cardiovascular diseases related to lifestyle changes and an aging population in China, and through the increase in heart problems, there is a demand for rehabilitation programs to rehabilitate cardiac patients so that they maintain a healthier lives.
The major role in the support of developing cardiac rehabilitation in China is played by government initiatives in the country. Active government support towards the Healthcare reform in China with a prominent emphasis on preventive health care and the expanding services in the field of rehabilitation. Investments in health infrastructure have also led to an increase in number of facilities that are able to offer cardiac rehabilitation across important cities.
In addition, cardiac health and its rehabilitation are slowly gaining more attention in the Chinese mentality. Public campaigns and education have provided awareness to the populace of the accrued benefits of rehabilitation programs, therefore increasing enrollment.
Further aiding this trend has been the emerging millennials concerned about health, widely adopting fitness technology such as heart rate monitors and smartwatches in monitoring and managing their health. With increasing cardiovascular diseases, supportive government policies, and increased awareness, as well as technological developments, the large cardiac rehabilitation market is expected to grow in China.
A description of the leading segments in the industry is provided in this section. The blood pressure monitor segment held 36.7% of the value share in 2025.
| Product | Blood Pressure Monitor |
|---|---|
| Value Share (2025) | 36.7% |
Increasing prevalence of cardiovascular disorders & growing case of hypertension, driven by lifestyles disorders, unhealthy diet, lack of physical exercise have led to advancing aging among young adults, which have prompted the need for continuous monitoring of blood pressure and in turn rising demand. Blood pressure monitors also act as a pivotal device for patients recovering from cardiac disorders to frequently monitor their blood pressure levels.
This has resulted in an increasing shift to home health monitoring recently, as it is easier for most patients to maintain self-monitoring for reassurance and early management of their health, especially in those with hypertension or who are at risk for cardiovascular disease. Technical advances in the development of user-friendly, reliable, and accurate ambulatory and home blood pressure monitors have further facilitated this trend.
The supremacy of blood pressure monitors in this sector could, therefore, be said to emanate from the increasing prevalence of cardiovascular diseases and the shift towards home monitoring, coupled with the continued innovation of new products that meet the needs of patients and thus pose them as tools that could play very key roles in cardiac rehabilitation strategies.

Companies operating in the cardiac rehabilitation sector industry collaborate with another market player to take advantage of their research capability and achieve breakthrough discoveries. It provides a competitive advantage to both companies. These collaborations are also focused on synergistically utilizing the already existing technology of the Partner Company and improving its market reach.
Introducing novel products in the market is a common strategy adopted by the companies. Below mentioned are a few examples of recent developments that took place in the cardiac rehabilitation industry.
Recent Industry Developments in the Cardiac Rehabilitation Market
In terms of product, the industry is segmented into ellipticals, stabilization balls, stationary balls, treadmills, heart rate monitors, blood pressure monitors, rovers, and others.
Key countries of North America, Latin America, Western Europe, Eastern Europe, South Asia, East Asia, the Middle East, and Africa have been covered in the report.
The global cardiac rehabilitation market is estimated to be valued at USD 2.5 billion in 2025.
The market size for the cardiac rehabilitation market is projected to reach USD 3.8 billion by 2035.
The cardiac rehabilitation market is expected to grow at a 4.6% CAGR between 2025 and 2035.
The key product types in cardiac rehabilitation market are blood pressure monitors, ellipticals, stabilization balls, stationary balls, treadmills, heart rate monitors, rovers and others.
In terms of , segment to command 0.0% share in the cardiac rehabilitation market in 2025.


Full Research Suite comprises of:
Market outlook & trends analysis
Interviews & case studies
Strategic recommendations
Vendor profiles & capabilities analysis
5-year forecasts
8 regions and 60+ country-level data splits
Market segment data splits
12 months of continuous data updates
DELIVERED AS:
PDF EXCEL ONLINE
Cardiac Monitoring And Cardiac Rhythm Management Devices Market Size and Share Forecast Outlook 2025 to 2035
Cardiac Rhythm Management Devices Market Size and Share Forecast Outlook 2025 to 2035
Cardiac Valvulotome Market Size and Share Forecast Outlook 2025 to 2035
Cardiac Ambulatory Monitoring Market Size and Share Forecast Outlook 2025 to 2035
Cardiac Rhythm Remote Monitoring Devices Market Size and Share Forecast Outlook 2025 to 2035
Cardiac Ultrasound Systems Market - Trends & Forecast 2025 to 2035
Cardiac Assist Devices Market Growth – Trends & Forecast 2025 to 2035
Cardiac Biomarker Diagnostic Test Kits Market Analysis – Trends & Forecast 2025 to 2035
Cardiac Surgery Devices Market Analysis – Trends & Forecast 2024-2034
Cardiac Rhythm Management Market Insights - Trends & Forecast 2024 to 2034
Cardiac Reader System Market Growth – Trends & Forecast 2019 to 2027
Cardiac Medical Device Market
Intracardiac Echocardiography Market Insights - Growth & Forecast 2025 to 2035
Intracardiac Imaging Market Trends – Industry Growth & Forecast 2024-2034
Mobile Cardiac Telemetry System Market Size and Share Forecast Outlook 2025 to 2035
MRI-Guided Cardiac Ablation Market Size and Share Forecast Outlook 2025 to 2035
Continuous Cardiac Monitoring Devices Market Size and Share Forecast Outlook 2025 to 2035
Companion Animal Cardiac Drugs Market Size and Share Forecast Outlook 2025 to 2035
Telerehabilitation Market
Home Rehabilitation Service Market Trends – Growth & Industry Outlook 2024-2034

Thank you!
You will receive an email from our Business Development Manager. Please be sure to check your SPAM/JUNK folder too.
Chat With
MaRIA