Veterinary Rehabilitation Services Market Analysis Size and Share Forecast Outlook 2023 to 2033

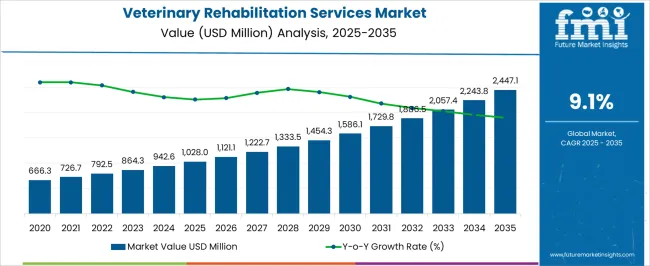
The global veterinary rehabilitation services market size was valued at USD 792.5 Million in 2022 and it is anticipated to achieve a market valuation of USD 882 Million in 2023. It is further estimated to reach a market valuation of USD 2.1 Billion by the end of the forecast period while exhibiting a CAGR of 9.06%.

The rising number of companion animals & pet humanization trends, increasing prevalence of musculoskeletal & orthopedic disorders among animals, and growing awareness among pet owners regarding physical rehabilitation as non-invasive & drug-free treatment are some of the key factors fueling this market. In addition, with the growing number of people valuing wildlife conservation, the count of volunteer rehabilitators who rescue and protect wounded/injured wildlife animals is also rising.

For instance, according to a study published in March 2022, by the National Library of Medicine, millions of native animals are rescued, rehabilitated, and protected by wildlife rehabilitators each year globally.

The COVID-19 pandemic negatively impacted the veterinary rehabilitation services market, especially during the year 2020. This negative impact was majorly due to lockdowns in various countries which resulted in the closure and denied access to veterinary care. This circumstance has created hurdles among pet owners in accessing veterinary rehabilitation services for their beloved companions due to the cancellation and enforced closure of rehab centers. Moreover, wildlife rehabilitation centers have faced severe challenges during the pandemic with disease contamination risks within the facilities and among native habitats. This concern led the wildlife rehab centers to have interrupted veterinary visits or reduced personnel by around 85% in specific cases.

According to a survey article published in July 2021 by the National Library of Medicine, the sudden outbreak of COVID-19 has adversely impacted the main income sources of Latin American wildlife rehabilitation centers in 2020. As most rehabilitation expenses were covered by regular tourist visitations, funds, and donations, the pandemic reduced routine rehabilitation services to a greater extent.

However, the services fairly recovered in 2021 due to the ease of COVID-19 restrictions. For instance, the Noah’s Ark Animal Rehabilitation Center & Sanctuary, Inc. reported that their rehabilitation expenses increased from USD 1,841 in 2020 to USD 9,962 in 2021 owing to the resumption of services. On the other hand, the pandemic has sparked the public’s interest in pet ownership, and hence several countries have witnessed high dog & cat adoption rates in 2020 and 2021.

Furthermore, the growing adoption of pet insurance with rehabilitation services coverage, post-pandemic return to normality with the resumption of veterinary rehab services, growth in the number of vet rehab centers, and increased pet healthcare expenditure are some of the other factors augmenting growth in the veterinary rehabilitation services market. According to the American Pet Products Association (APPA), the pet care expenditure in the USA raised to reach 123.6 billion in 2021 from USD 90.5 billion in 2018.

Hence, the increasing annual pet healthcare expenditure is one of the major driving factors in the market growth. Moreover, the increasing popularity of veterinary rehab has reflected the devotion of pet owners who have proven their willingness to invest more time and money in their pets’ healthcare. Considering the perceived applications and benefits of rehab, the sector is expected to grow at a fast pace in veterinary medicine.

Report Attribute Details
Expected Market Value (2023) USD 882 Million
Anticipated Forecast Value (2033) USD 2.1 Billion
Projected Growth Rate (2023 to 2033) 9.06%

2018 to 2022 Veterinary Rehabilitation Services Market Outlook Compared to Forecast from 2023 to 2033

The Veterinary rehabilitation services market was valued at around USD 510 Million in 2019 while possessing a CAGR of 9.9% during the historical period. The rising pet population increased expenditure on companion animals, and growth in veterinary infrastructure are propelling the growth of this market.

These factors are providing thrust for the expansion of the veterinary rehabilitation market. Considering these factors, the Global veterinary rehabilitation services market will reach a market valuation of USD 2.1 Billion with a remarkable CAGR of 9.06% during the forecast period.

Key Drivers Boosting the Veterinary Rehabilitation Services Market

Pet humanization fuelling the market growth of veterinary rehab services

The increasing number of companion animals & pet humanization trends, the rising prevalence of musculoskeletal & orthopedic disorders among animals, and rising awareness among pet owners regarding physical rehabilitation as non-invasive & drug-free treatment are some of the key factors driving this market.

In addition, with the growing number of people valuing wildlife conservation, the count of volunteer rehabilitators who rescue and protect wounded/injured wildlife animals is also increasing. For instance, according to a study published in March 2022, by the National Library of Medicine, millions of native animals are rescued, rehabilitated, and protected by wildlife rehabilitators each year globally.

Key Challenges Facing the Veterinary Rehabilitation Services Market

Expensive veterinary rehab services to restrain the market expansion

The high cost of veterinary rehab services and the shortage of skilled personnel are anticipated to hinder the growth of the global veterinary rehabilitation services market. The cost of diagnostic imaging equipment and veterinary drugs is high, which has led to the high cost of veterinary services.

Lack of awareness in developing or under-developed economies is anticipated to hamper the growth of the global veterinary rehabilitation services market. For instance, cats and dogs are the two most common household companion animals that can be a direct or indirect source of zoonotic infections. These factors will pose challenges to market growth.
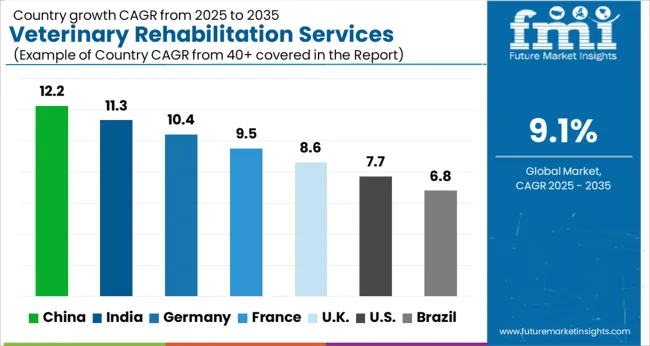
Top Regional Insights in the Veterinary Rehabilitation Services Industry

Increasing Veterinary Expenditure fueling the market growth in North America

North America dominated the veterinary rehabilitation services market and accounted for a revenue share of over 35.1% in 2022. The high share of the region is due to the significant presence of veterinary rehabilitation centers, increasing awareness among pet owners regarding physical rehab services, rising therapy availability, and increasing pet ownership & veterinary expenditure.

The growing number of veterinary hospitals with trained and licensed veterinarians who also offer rehabilitation services is another factor boosting the market growth. According to the American Veterinary Medical Association, over 110,000 registered veterinarians were estimated in the USA in 2020, majorly offering services to small animal patients. According to APPA many of these registered veterinarians are currently certified to provide rehabilitation for companion animals.
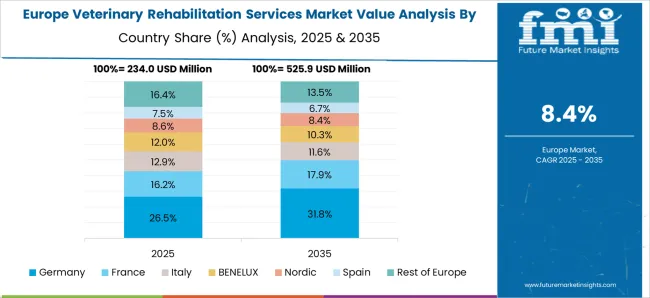
The increasing prevalence of shelter homes driving the market in Europe

Europe region holds the second-largest share of the market. This is due to the rising number of wildlife rehabilitation centers and shelter homes in European countries. The growth is also fueled by the rising per capita income and the treatment of pets as a family member.

Rising disposable income leading to market expansion in Asia Pacific

The Asia Pacific region is expected to grow fast with a market share of 13% in 2023. This is attributable to the increasing disposable income & veterinary services expenditure in key markets and growing awareness about pet rehab services in developing countries. The growing demand for proper and timely rehabilitation for companions to relieve their painful conditions, and pet humanization in developing countries like India is further boosting the growth of the market.

Asia-Pacific is predicted to remain veterinary pain management's fastest-growing market due to increased government measures to promote awareness, a rise in medical tourism, growing research activities in the region, a rising pet population, and growing demand for better healthcare in the region.

Veterinary Rehabilitation Services Market Analysis by Therapy Type and End Use

Rising pet healthcare expenditure fueling the growth of the companion animal segment

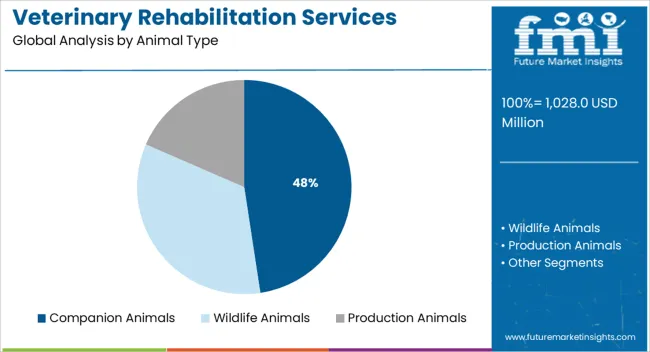
The companion animal segment is anticipated to dominate the market and account for the largest revenue share of around 70% by 2033. Increasing pet ownership rates especially in developed regions, rising pet healthcare services expenditure, growing incidence of chronic orthopedic conditions and widely arising physical rehabilitation requirements are among the factors responsible for the largest share of the segment.

In addition, the growing population rate of dogs in every region further propels the market’s growth. According to the AKC (American Kennel Club), the number of USA households owning dogs reached 69 million (54%) in 2021 which increased from 50% in 2018. Similarly, in Europe, nearly 90 million households (46%) own at least one pet, according to FEDIAF European Pet Food Industry in 2021. In addition, the COVID-19 pandemic has encouraged most people in the world to adopt pets for psychological comfort.

By Therapy Type, the Therapeutic Exercises Segment is generating the Highest Revenue

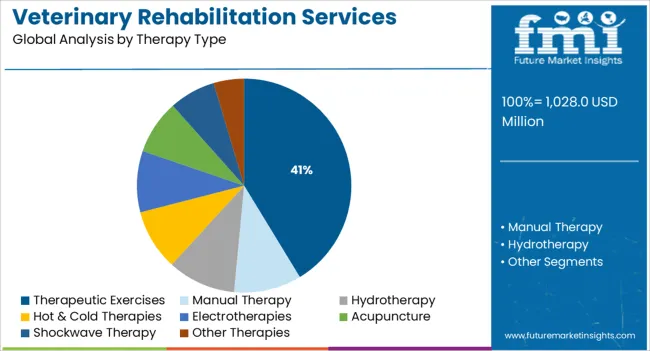
The therapeutic exercises segment dominated the market and accounted for the largest revenue share of over 20.3% in 2021. Therapeutic or guided exercises are one of the most frequently used physical rehabilitation therapy for companion animals such as dogs. Veterinary therapeutic exercise programs comprise balance therapies, weight shifting, weight loss therapies, and several other exercises using grounded treadmills, cavalletti rails, balance discs, and peanut balls among others.

These exercises improve the body mobility, strength, flexibility, and endurance of animals that have chronic conditions such as arthritis, or those recovering from debilitating musculoskeletal or orthopedic surgery. In addition, for animal patients with neurological conditions, physical rehab exercises catalyze their healing process and speed up the return to normal physic, and promote overall energy and health.

Post-surgery segment dominates the market by Indication of Type

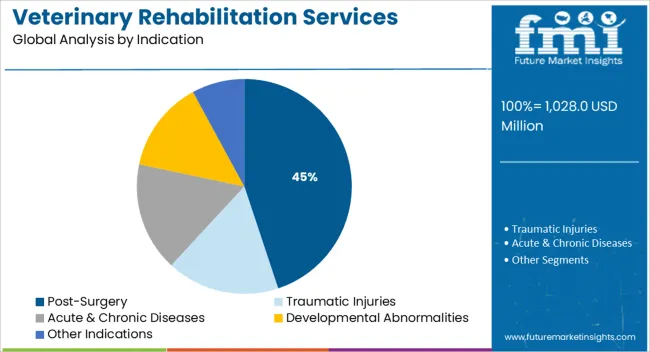
The post-surgery segment dominated the market and accounted for the largest market share of 31% in 2022. This substantial share is due to the growing number of orthopedic surgeries performed for dogs and cats, with the increasing number of veterinarians directing pets toward rehabilitation centers after surgery.

Orthopedic surgeries for companion animals are one of the common procedures that veterinarians perform to treat musculoskeletal issues. Post-operative patients are more likely to consider rehabilitation to reduce inflammation & pain and to improve the healing rate. Physical rehabilitation therapy after surgery has become more common in the veterinary field with newer advancements, which further contributes to segmental growth.

Veterinary Rehab Centers lead the segment with the Highest Market Share

The veterinary rehab centers and hospitals segment dominated the market and accounted for the largest market share of over 45.8% in 2022. This is due to a growing number of veterinary rehab hospitals and centers globally with advanced infrastructures. These centers are very critical for veterinary rehabilitation services as they provide professional therapies with certified veterinary rehabilitators.

The increasing number of veterinary rehab professionals is another factor driving the segment growth in the market. According to the American Animal Hospital Association (AAHA), currently, many veterinary technicians and normal veterinarians are certified to rehabilitate animal patients in veterinary general hospitals. These affirmative factors are contributing to the segmental growth over the forecast period.
Start-up Scenario in the Veterinary Rehabilitation Services Market

  • Founded in 2012, Eupraxia Pharmaceuticals is a Canada-based pharmaceutical company that has a proprietary drug delivery platform. The technology encapsulates pharmaceutical microparticles in a customizable polymer shell that can extend drug release from days to months. The company works on existing drugs and uses its injectable drug delivery platform for targeted therapies. It also has preclinical and development phase candidates for chronic pain, anesthesia, diabetic macular edema, and infections. The company's lead product candidate, EP-104IAR (phase I clinical trial) is a sustained-release product of the anti-inflammatory, fluticasone propionate for pain relief for patients with osteoarthritis. It also has a phase 1 candidate for veterinary health. In 2016, the company has entered into a license agreement with Auritec under which Eupraxia licensed the Plexis platform technology and intellectual property rights from Auritec for the sustained delivery of corticosteroids. It received funding of USD 473K from NRC, SVB, Stadnyk&partners.
  • Founded in 2018, Wiggles is a Pune, India-based startup that provides an extensive range of veterinary care products and services. The company provides pet-focused supplements, foods, medicines, and ayurvedic and herbal care products. In addition to selling its products online, the company also provides vet on-call and grooming services. This company was able to accumulate funding of USD 9 million.

Competitive Outlook of the Veterinary Rehabilitation Services Market

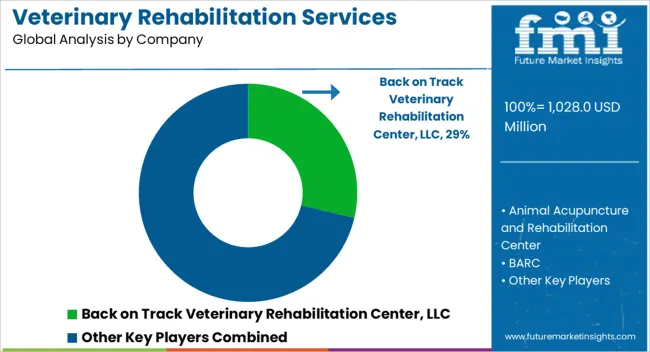
The global veterinary rehabilitation services market is consolidated with few large and medium-sized players accounting for most of the market revenue. Major players are deploying various strategies, entering into mergers and acquisitions, strategic agreements and contracts, developing testing, and introducing more effective veterinary rehabilitation services solutions. Some of the major company profiles included in the global veterinary rehabilitation services market report are-

Back on Track Veterinary Rehabilitation Center LLC, Animal Acupuncture and Rehabilitation Center, BARC, Treasure Coast Animal Rehab & Fitness, Animal Rehab Center of Michigan, Blue Springs Animal Rehabilitation Center, Essex Animal Hospital, Triangle Veterinary Referral Hospital, Butterwick animal rehab clinic Ltd, Animal Rehab and Conditioning Center.

  • In April 2022, the FDA approved Vatinoxan hydrochlorides and Medetomidine injections for dogs undergoing specific clinical examinations and procedures and minor surgical operations. Medetomidine is a synthetic drug used as a surgical anesthetic and an analgesic. Vatinoxan brings down the adverse cardiovascular effects of medetomidine by maintaining the heart rate in the normal range, thus improving the cardiovascular function and the safety profile of medetomidine while the dog is sedated. Zenalpha is aimed to provide sedation and relief of pain that lasts for the duration of the sedation to dogs for clinical examinations or procedures which require the dog to remain still, calm or quiet.
  • In January 2022, the USA FDA provided approval to Elanco Animal Health's Zorbium which is a (buprenorphine transdermal solution). Due to this approval, veterinarians now have another alternative for managing postoperative pain in cats, owing to this approval. Zorbium is the first and foremost transdermal buprenorphine animal drug targeted to control and relieve pain in cats post-surgery. Buprenorphine is classified as an opioid pain medication that acts on pain receptors in the central nervous system. A single treatment relieves the cat's suffering for four days.
  • In January 2022, the FDA approved Solensia (frunevetmab injection), which is the first-ever drug to alleviate pain linked with arthritis in cats. It is the first monoclonal antibody (mAb) which is a new animal drug actively approved by the FDA for extensive usage in any animal species. Frunevetmab which is the active ingredient in Solensia is designed to recognize and attach to a protein called nerve growth factor (NGF), which is involved in regulating the pain to a great extent. When frunevetmab binds to NGF, it restricts the pain signal from reaching the brain.

Scope of the Veterinary Rehabilitation Services Market Report

Report Attribute Details
Market Value in 2022 USD 792.5 million
Market Value in 2033 USD 2.1 billion
Growth Rate CAGR of 9.06% from 2023 to 2033
Base Year for Estimation 2022
Historical Data 2018 to 2022
Forecast Period 2023 to 2033
Quantitative Units Revenue in USD Million and Billion and CAGR from 2023 to 2033
Report Coverage Revenue Forecast, Volume Forecast, Company Ranking, Competitive Landscape, Growth Factors, Challenges, Trends, and Pricing Analysis
Segments Covered Animal Type, Therapy Type, Indication, End-Use, Region
Regions Covered North America; Latin America; Europe; East Asia; South Asia; Oceania; Middle East and Africa(MEA)
Key Countries Profiled USA, Canada, Brazil, Mexico, Germany, United Kingdom, France, Spain, Italy, India, Malaysia, Singapore, Thailand, Australia, New Zealand, China, Japan, South Korea, GCC countries, Malaysia, Singapore, Thailand, South Africa, Israel
Key Companies Profiled Back on Track Veterinary Rehabilitation Center, LLC; Animal Acupuncture and Rehabilitation Center; BARC; Treasure Coast Animal Rehab & Fitness; Animal Rehab Center of Michigan; Blue Springs Animal Rehabilitation Center; Essex Animal Hospital; Triangle Veterinary Referral Hospital; Butterwick Animal Rehab Clinic Ltd; Animal Rehab and Conditioning Center
Customization Available Upon Request

Top Investment Segments in the Veterinary Rehabilitation Services Market Industry Survey

By Animal Type:

  • Companion Animals
  • Wildlife Animals
  • Production Animals

By Therapy Type:

  • Therapeutic Exercises
  • Manual Therapy
  • Hydrotherapy
  • Hot & Cold Therapies
  • Electrotherapies
  • Acupuncture
  • Shockwave Therapy
  • Other Therapies

By Indication:

  • Post-Surgery
  • Traumatic Injuries
  • Acute & Chronic Diseases
  • Developmental Abnormalities
  • Other Indications

By End Use:

  • Veterinary Rehab Centers & Hospitals
  • Rescue & Shelter Homes
  • Rehab Sanctuary
  • Others

By Region:

  • North America
  • Europe
  • East Asia
  • South Asia
  • Oceania
  • Latin America
  • Middle East and Africa (MEA)

Table of Content

  • 1. Executive Summary
  • 2. Market Overview
  • 3. Market Background
  • 4. Global Market Analysis 2018 to 2022 and Forecast, 2023 to 2033
  • 5. Global Market Analysis 2018 to 2022 and Forecast 2023 to 2033, By Animal Type
    • 5.1. Companion Animals
    • 5.2. Production Animals
    • 5.3. Wildlife Animals
  • 6. Global Market Analysis 2018 to 2022 and Forecast 2023 to 2033, By Therapy Type
    • 6.1. Therapeutic Exercises
    • 6.2. Manual Therapy
    • 6.3. Hydrotherapy
    • 6.4. Hot & Cold Therapies
    • 6.5. Electro Therapies
    • 6.6. Acupuncture
    • 6.7. Shockwave Therapy
    • 6.8. Other Therapies
  • 7. Global Market Analysis 2018 to 2022 and Forecast 2023 to 2033, By Indication
    • 7.1. Post-Surgery
    • 7.2. Traumatic Injuries
    • 7.3. Acute & Chronic Diseases
    • 7.4. Developmental Abnormality
    • 7.5. Other Indications
  • 8. Global Market Analysis 2018 to 2022 and Forecast 2023 to 2033, By End-use
    • 8.1. Veterinary Rehab Centers & Hospitals
    • 8.2. Rescue & Shelter Homes
    • 8.3. Rehab Sanctuary
    • 8.4. Others
  • 9. Global Market Analysis 2018 to 2022 and Forecast 2023 to 2033, By Region
    • 9.1. North America
    • 9.2. Latin America
    • 9.3. Europe
    • 9.4. South Asia
    • 9.5. East Asia
    • 9.6. Oceania
    • 9.7. Middle East and Africa (MEA)
  • 10. North America Market Analysis 2018 to 2022 and Forecast 2023 to 2033, By Country
  • 11. Latin America Market Analysis 2018 to 2022 and Forecast 2023 to 2033, By Country
  • 12. Europe Market Analysis 2018 to 2022 and Forecast 2023 to 2033, By Country
  • 13. South Asia Market Analysis 2018 to 2022 and Forecast 2023 to 2033, By Country
  • 14. East Asia Market Analysis 2018 to 2022 and Forecast 2023 to 2033, By Country
  • 15. Oceania Market Analysis 2018 to 2022 and Forecast 2023 to 2033, By Country
  • 16. MEA Market Analysis 2018 to 2022 and Forecast 2023 to 2033, By Country
  • 17. Key Countries Market Analysis
  • 18. Market Structure Analysis
  • 19. Competition Analysis
    • 19.1. Back on Track Veterinary Rehabilitation Center, LLC
    • 19.2. Animal Acupuncture and Rehabilitation Center
    • 19.3. BARC
    • 19.4. Treasure Coast Animal Rehab & Fitness
    • 19.5. Animal Rehab Center of Michigan
    • 19.6. Blue Springs Animal Rehabilitation Center
    • 19.7. Essex Animal Hospital
    • 19.8. Triangle Veterinary Referral Hospital
    • 19.9. Butterwick Animal Rehab Clinic Ltd
    • 19.10. Animal Rehab and Conditioning Center
  • 20. Assumptions & Acronyms Used
  • 21. Research Methodology

List of Tables

Table 1: Global Market Value (US$ Million) Forecast by Region, 2018 to 2033

Table 2: Global Market Value (US$ Million) Forecast by Animal Type, 2018 to 2033

Table 3: Global Market Value (US$ Million) Forecast by Therapy Type, 2018 to 2033

Table 4: Global Market Value (US$ Million) Forecast by Indication, 2018 to 2033

Table 5: Global Market Value (US$ Million) Forecast by End-use, 2018 to 2033

Table 6: North America Market Value (US$ Million) Forecast by Country, 2018 to 2033

Table 7: North America Market Value (US$ Million) Forecast by Animal Type, 2018 to 2033

Table 8: North America Market Value (US$ Million) Forecast by Therapy Type, 2018 to 2033

Table 9: North America Market Value (US$ Million) Forecast by Indication, 2018 to 2033

Table 10: North America Market Value (US$ Million) Forecast by End-use, 2018 to 2033

Table 11: Latin America Market Value (US$ Million) Forecast by Country, 2018 to 2033

Table 12: Latin America Market Value (US$ Million) Forecast by Animal Type, 2018 to 2033

Table 13: Latin America Market Value (US$ Million) Forecast by Therapy Type, 2018 to 2033

Table 14: Latin America Market Value (US$ Million) Forecast by Indication, 2018 to 2033

Table 15: Latin America Market Value (US$ Million) Forecast by End-use, 2018 to 2033

Table 16: Europe Market Value (US$ Million) Forecast by Country, 2018 to 2033

Table 17: Europe Market Value (US$ Million) Forecast by Animal Type, 2018 to 2033

Table 18: Europe Market Value (US$ Million) Forecast by Therapy Type, 2018 to 2033

Table 19: Europe Market Value (US$ Million) Forecast by Indication, 2018 to 2033

Table 20: Europe Market Value (US$ Million) Forecast by End-use, 2018 to 2033

Table 21: South Asia Market Value (US$ Million) Forecast by Country, 2018 to 2033

Table 22: South Asia Market Value (US$ Million) Forecast by Animal Type, 2018 to 2033

Table 23: South Asia Market Value (US$ Million) Forecast by Therapy Type, 2018 to 2033

Table 24: South Asia Market Value (US$ Million) Forecast by Indication, 2018 to 2033

Table 25: South Asia Market Value (US$ Million) Forecast by End-use, 2018 to 2033

Table 26: East Asia Market Value (US$ Million) Forecast by Country, 2018 to 2033

Table 27: East Asia Market Value (US$ Million) Forecast by Animal Type, 2018 to 2033

Table 28: East Asia Market Value (US$ Million) Forecast by Therapy Type, 2018 to 2033

Table 29: East Asia Market Value (US$ Million) Forecast by Indication, 2018 to 2033

Table 30: East Asia Market Value (US$ Million) Forecast by End-use, 2018 to 2033

Table 31: Oceania Market Value (US$ Million) Forecast by Country, 2018 to 2033

Table 32: Oceania Market Value (US$ Million) Forecast by Animal Type, 2018 to 2033

Table 33: Oceania Market Value (US$ Million) Forecast by Therapy Type, 2018 to 2033

Table 34: Oceania Market Value (US$ Million) Forecast by Indication, 2018 to 2033

Table 35: Oceania Market Value (US$ Million) Forecast by End-use, 2018 to 2033

Table 36: MEA Market Value (US$ Million) Forecast by Country, 2018 to 2033

Table 37: MEA Market Value (US$ Million) Forecast by Animal Type, 2018 to 2033

Table 38: MEA Market Value (US$ Million) Forecast by Therapy Type, 2018 to 2033

Table 39: MEA Market Value (US$ Million) Forecast by Indication, 2018 to 2033

Table 40: MEA Market Value (US$ Million) Forecast by End-use, 2018 to 2033

List of Figures

Figure 1: Global Market Value (US$ Million) by Animal Type, 2023 to 2033

Figure 2: Global Market Value (US$ Million) by Therapy Type, 2023 to 2033

Figure 3: Global Market Value (US$ Million) by Indication, 2023 to 2033

Figure 4: Global Market Value (US$ Million) by End-use, 2023 to 2033

Figure 5: Global Market Value (US$ Million) by Region, 2023 to 2033

Figure 6: Global Market Value (US$ Million) Analysis by Region, 2018 to 2033

Figure 7: Global Market Value Share (%) and BPS Analysis by Region, 2023 to 2033

Figure 8: Global Market Y-o-Y Growth (%) Projections by Region, 2023 to 2033

Figure 9: Global Market Value (US$ Million) Analysis by Animal Type, 2018 to 2033

Figure 10: Global Market Value Share (%) and BPS Analysis by Animal Type, 2023 to 2033

Figure 11: Global Market Y-o-Y Growth (%) Projections by Animal Type, 2023 to 2033

Figure 12: Global Market Value (US$ Million) Analysis by Therapy Type, 2018 to 2033

Figure 13: Global Market Value Share (%) and BPS Analysis by Therapy Type, 2023 to 2033

Figure 14: Global Market Y-o-Y Growth (%) Projections by Therapy Type, 2023 to 2033

Figure 15: Global Market Value (US$ Million) Analysis by Indication, 2018 to 2033

Figure 16: Global Market Value Share (%) and BPS Analysis by Indication, 2023 to 2033

Figure 17: Global Market Y-o-Y Growth (%) Projections by Indication, 2023 to 2033

Figure 18: Global Market Value (US$ Million) Analysis by End-use, 2018 to 2033

Figure 19: Global Market Value Share (%) and BPS Analysis by End-use, 2023 to 2033

Figure 20: Global Market Y-o-Y Growth (%) Projections by End-use, 2023 to 2033

Figure 21: Global Market Attractiveness by Animal Type, 2023 to 2033

Figure 22: Global Market Attractiveness by Therapy Type, 2023 to 2033

Figure 23: Global Market Attractiveness by Indication, 2023 to 2033

Figure 24: Global Market Attractiveness by End-use, 2023 to 2033

Figure 25: Global Market Attractiveness by Region, 2023 to 2033

Figure 26: North America Market Value (US$ Million) by Animal Type, 2023 to 2033

Figure 27: North America Market Value (US$ Million) by Therapy Type, 2023 to 2033

Figure 28: North America Market Value (US$ Million) by Indication, 2023 to 2033

Figure 29: North America Market Value (US$ Million) by End-use, 2023 to 2033

Figure 30: North America Market Value (US$ Million) by Country, 2023 to 2033

Figure 31: North America Market Value (US$ Million) Analysis by Country, 2018 to 2033

Figure 32: North America Market Value Share (%) and BPS Analysis by Country, 2023 to 2033

Figure 33: North America Market Y-o-Y Growth (%) Projections by Country, 2023 to 2033

Figure 34: North America Market Value (US$ Million) Analysis by Animal Type, 2018 to 2033

Figure 35: North America Market Value Share (%) and BPS Analysis by Animal Type, 2023 to 2033

Figure 36: North America Market Y-o-Y Growth (%) Projections by Animal Type, 2023 to 2033

Figure 37: North America Market Value (US$ Million) Analysis by Therapy Type, 2018 to 2033

Figure 38: North America Market Value Share (%) and BPS Analysis by Therapy Type, 2023 to 2033

Figure 39: North America Market Y-o-Y Growth (%) Projections by Therapy Type, 2023 to 2033

Figure 40: North America Market Value (US$ Million) Analysis by Indication, 2018 to 2033

Figure 41: North America Market Value Share (%) and BPS Analysis by Indication, 2023 to 2033

Figure 42: North America Market Y-o-Y Growth (%) Projections by Indication, 2023 to 2033

Figure 43: North America Market Value (US$ Million) Analysis by End-use, 2018 to 2033

Figure 44: North America Market Value Share (%) and BPS Analysis by End-use, 2023 to 2033

Figure 45: North America Market Y-o-Y Growth (%) Projections by End-use, 2023 to 2033

Figure 46: North America Market Attractiveness by Animal Type, 2023 to 2033

Figure 47: North America Market Attractiveness by Therapy Type, 2023 to 2033

Figure 48: North America Market Attractiveness by Indication, 2023 to 2033

Figure 49: North America Market Attractiveness by End-use, 2023 to 2033

Figure 50: North America Market Attractiveness by Country, 2023 to 2033

Figure 51: Latin America Market Value (US$ Million) by Animal Type, 2023 to 2033

Figure 52: Latin America Market Value (US$ Million) by Therapy Type, 2023 to 2033

Figure 53: Latin America Market Value (US$ Million) by Indication, 2023 to 2033

Figure 54: Latin America Market Value (US$ Million) by End-use, 2023 to 2033

Figure 55: Latin America Market Value (US$ Million) by Country, 2023 to 2033

Figure 56: Latin America Market Value (US$ Million) Analysis by Country, 2018 to 2033

Figure 57: Latin America Market Value Share (%) and BPS Analysis by Country, 2023 to 2033

Figure 58: Latin America Market Y-o-Y Growth (%) Projections by Country, 2023 to 2033

Figure 59: Latin America Market Value (US$ Million) Analysis by Animal Type, 2018 to 2033

Figure 60: Latin America Market Value Share (%) and BPS Analysis by Animal Type, 2023 to 2033

Figure 61: Latin America Market Y-o-Y Growth (%) Projections by Animal Type, 2023 to 2033

Figure 62: Latin America Market Value (US$ Million) Analysis by Therapy Type, 2018 to 2033

Figure 63: Latin America Market Value Share (%) and BPS Analysis by Therapy Type, 2023 to 2033

Figure 64: Latin America Market Y-o-Y Growth (%) Projections by Therapy Type, 2023 to 2033

Figure 65: Latin America Market Value (US$ Million) Analysis by Indication, 2018 to 2033

Figure 66: Latin America Market Value Share (%) and BPS Analysis by Indication, 2023 to 2033

Figure 67: Latin America Market Y-o-Y Growth (%) Projections by Indication, 2023 to 2033

Figure 68: Latin America Market Value (US$ Million) Analysis by End-use, 2018 to 2033

Figure 69: Latin America Market Value Share (%) and BPS Analysis by End-use, 2023 to 2033

Figure 70: Latin America Market Y-o-Y Growth (%) Projections by End-use, 2023 to 2033

Figure 71: Latin America Market Attractiveness by Animal Type, 2023 to 2033

Figure 72: Latin America Market Attractiveness by Therapy Type, 2023 to 2033

Figure 73: Latin America Market Attractiveness by Indication, 2023 to 2033

Figure 74: Latin America Market Attractiveness by End-use, 2023 to 2033

Figure 75: Latin America Market Attractiveness by Country, 2023 to 2033

Figure 76: Europe Market Value (US$ Million) by Animal Type, 2023 to 2033

Figure 77: Europe Market Value (US$ Million) by Therapy Type, 2023 to 2033

Figure 78: Europe Market Value (US$ Million) by Indication, 2023 to 2033

Figure 79: Europe Market Value (US$ Million) by End-use, 2023 to 2033

Figure 80: Europe Market Value (US$ Million) by Country, 2023 to 2033

Figure 81: Europe Market Value (US$ Million) Analysis by Country, 2018 to 2033

Figure 82: Europe Market Value Share (%) and BPS Analysis by Country, 2023 to 2033

Figure 83: Europe Market Y-o-Y Growth (%) Projections by Country, 2023 to 2033

Figure 84: Europe Market Value (US$ Million) Analysis by Animal Type, 2018 to 2033

Figure 85: Europe Market Value Share (%) and BPS Analysis by Animal Type, 2023 to 2033

Figure 86: Europe Market Y-o-Y Growth (%) Projections by Animal Type, 2023 to 2033

Figure 87: Europe Market Value (US$ Million) Analysis by Therapy Type, 2018 to 2033

Figure 88: Europe Market Value Share (%) and BPS Analysis by Therapy Type, 2023 to 2033

Figure 89: Europe Market Y-o-Y Growth (%) Projections by Therapy Type, 2023 to 2033

Figure 90: Europe Market Value (US$ Million) Analysis by Indication, 2018 to 2033

Figure 91: Europe Market Value Share (%) and BPS Analysis by Indication, 2023 to 2033

Figure 92: Europe Market Y-o-Y Growth (%) Projections by Indication, 2023 to 2033

Figure 93: Europe Market Value (US$ Million) Analysis by End-use, 2018 to 2033

Figure 94: Europe Market Value Share (%) and BPS Analysis by End-use, 2023 to 2033

Figure 95: Europe Market Y-o-Y Growth (%) Projections by End-use, 2023 to 2033

Figure 96: Europe Market Attractiveness by Animal Type, 2023 to 2033

Figure 97: Europe Market Attractiveness by Therapy Type, 2023 to 2033

Figure 98: Europe Market Attractiveness by Indication, 2023 to 2033

Figure 99: Europe Market Attractiveness by End-use, 2023 to 2033

Figure 100: Europe Market Attractiveness by Country, 2023 to 2033

Figure 101: South Asia Market Value (US$ Million) by Animal Type, 2023 to 2033

Figure 102: South Asia Market Value (US$ Million) by Therapy Type, 2023 to 2033

Figure 103: South Asia Market Value (US$ Million) by Indication, 2023 to 2033

Figure 104: South Asia Market Value (US$ Million) by End-use, 2023 to 2033

Figure 105: South Asia Market Value (US$ Million) by Country, 2023 to 2033

Figure 106: South Asia Market Value (US$ Million) Analysis by Country, 2018 to 2033

Figure 107: South Asia Market Value Share (%) and BPS Analysis by Country, 2023 to 2033

Figure 108: South Asia Market Y-o-Y Growth (%) Projections by Country, 2023 to 2033

Figure 109: South Asia Market Value (US$ Million) Analysis by Animal Type, 2018 to 2033

Figure 110: South Asia Market Value Share (%) and BPS Analysis by Animal Type, 2023 to 2033

Figure 111: South Asia Market Y-o-Y Growth (%) Projections by Animal Type, 2023 to 2033

Figure 112: South Asia Market Value (US$ Million) Analysis by Therapy Type, 2018 to 2033

Figure 113: South Asia Market Value Share (%) and BPS Analysis by Therapy Type, 2023 to 2033

Figure 114: South Asia Market Y-o-Y Growth (%) Projections by Therapy Type, 2023 to 2033

Figure 115: South Asia Market Value (US$ Million) Analysis by Indication, 2018 to 2033

Figure 116: South Asia Market Value Share (%) and BPS Analysis by Indication, 2023 to 2033

Figure 117: South Asia Market Y-o-Y Growth (%) Projections by Indication, 2023 to 2033

Figure 118: South Asia Market Value (US$ Million) Analysis by End-use, 2018 to 2033

Figure 119: South Asia Market Value Share (%) and BPS Analysis by End-use, 2023 to 2033

Figure 120: South Asia Market Y-o-Y Growth (%) Projections by End-use, 2023 to 2033

Figure 121: South Asia Market Attractiveness by Animal Type, 2023 to 2033

Figure 122: South Asia Market Attractiveness by Therapy Type, 2023 to 2033

Figure 123: South Asia Market Attractiveness by Indication, 2023 to 2033

Figure 124: South Asia Market Attractiveness by End-use, 2023 to 2033

Figure 125: South Asia Market Attractiveness by Country, 2023 to 2033

Figure 126: East Asia Market Value (US$ Million) by Animal Type, 2023 to 2033

Figure 127: East Asia Market Value (US$ Million) by Therapy Type, 2023 to 2033

Figure 128: East Asia Market Value (US$ Million) by Indication, 2023 to 2033

Figure 129: East Asia Market Value (US$ Million) by End-use, 2023 to 2033

Figure 130: East Asia Market Value (US$ Million) by Country, 2023 to 2033

Figure 131: East Asia Market Value (US$ Million) Analysis by Country, 2018 to 2033

Figure 132: East Asia Market Value Share (%) and BPS Analysis by Country, 2023 to 2033

Figure 133: East Asia Market Y-o-Y Growth (%) Projections by Country, 2023 to 2033

Figure 134: East Asia Market Value (US$ Million) Analysis by Animal Type, 2018 to 2033

Figure 135: East Asia Market Value Share (%) and BPS Analysis by Animal Type, 2023 to 2033

Figure 136: East Asia Market Y-o-Y Growth (%) Projections by Animal Type, 2023 to 2033

Figure 137: East Asia Market Value (US$ Million) Analysis by Therapy Type, 2018 to 2033

Figure 138: East Asia Market Value Share (%) and BPS Analysis by Therapy Type, 2023 to 2033

Figure 139: East Asia Market Y-o-Y Growth (%) Projections by Therapy Type, 2023 to 2033

Figure 140: East Asia Market Value (US$ Million) Analysis by Indication, 2018 to 2033

Figure 141: East Asia Market Value Share (%) and BPS Analysis by Indication, 2023 to 2033

Figure 142: East Asia Market Y-o-Y Growth (%) Projections by Indication, 2023 to 2033

Figure 143: East Asia Market Value (US$ Million) Analysis by End-use, 2018 to 2033

Figure 144: East Asia Market Value Share (%) and BPS Analysis by End-use, 2023 to 2033

Figure 145: East Asia Market Y-o-Y Growth (%) Projections by End-use, 2023 to 2033

Figure 146: East Asia Market Attractiveness by Animal Type, 2023 to 2033

Figure 147: East Asia Market Attractiveness by Therapy Type, 2023 to 2033

Figure 148: East Asia Market Attractiveness by Indication, 2023 to 2033

Figure 149: East Asia Market Attractiveness by End-use, 2023 to 2033

Figure 150: East Asia Market Attractiveness by Country, 2023 to 2033

Figure 151: Oceania Market Value (US$ Million) by Animal Type, 2023 to 2033

Figure 152: Oceania Market Value (US$ Million) by Therapy Type, 2023 to 2033

Figure 153: Oceania Market Value (US$ Million) by Indication, 2023 to 2033

Figure 154: Oceania Market Value (US$ Million) by End-use, 2023 to 2033

Figure 155: Oceania Market Value (US$ Million) by Country, 2023 to 2033

Figure 156: Oceania Market Value (US$ Million) Analysis by Country, 2018 to 2033

Figure 157: Oceania Market Value Share (%) and BPS Analysis by Country, 2023 to 2033

Figure 158: Oceania Market Y-o-Y Growth (%) Projections by Country, 2023 to 2033

Figure 159: Oceania Market Value (US$ Million) Analysis by Animal Type, 2018 to 2033

Figure 160: Oceania Market Value Share (%) and BPS Analysis by Animal Type, 2023 to 2033

Figure 161: Oceania Market Y-o-Y Growth (%) Projections by Animal Type, 2023 to 2033

Figure 162: Oceania Market Value (US$ Million) Analysis by Therapy Type, 2018 to 2033

Figure 163: Oceania Market Value Share (%) and BPS Analysis by Therapy Type, 2023 to 2033

Figure 164: Oceania Market Y-o-Y Growth (%) Projections by Therapy Type, 2023 to 2033

Figure 165: Oceania Market Value (US$ Million) Analysis by Indication, 2018 to 2033

Figure 166: Oceania Market Value Share (%) and BPS Analysis by Indication, 2023 to 2033

Figure 167: Oceania Market Y-o-Y Growth (%) Projections by Indication, 2023 to 2033

Figure 168: Oceania Market Value (US$ Million) Analysis by End-use, 2018 to 2033

Figure 169: Oceania Market Value Share (%) and BPS Analysis by End-use, 2023 to 2033

Figure 170: Oceania Market Y-o-Y Growth (%) Projections by End-use, 2023 to 2033

Figure 171: Oceania Market Attractiveness by Animal Type, 2023 to 2033

Figure 172: Oceania Market Attractiveness by Therapy Type, 2023 to 2033

Figure 173: Oceania Market Attractiveness by Indication, 2023 to 2033

Figure 174: Oceania Market Attractiveness by End-use, 2023 to 2033

Figure 175: Oceania Market Attractiveness by Country, 2023 to 2033

Figure 176: MEA Market Value (US$ Million) by Animal Type, 2023 to 2033

Figure 177: MEA Market Value (US$ Million) by Therapy Type, 2023 to 2033

Figure 178: MEA Market Value (US$ Million) by Indication, 2023 to 2033

Figure 179: MEA Market Value (US$ Million) by End-use, 2023 to 2033

Figure 180: MEA Market Value (US$ Million) by Country, 2023 to 2033

Figure 181: MEA Market Value (US$ Million) Analysis by Country, 2018 to 2033

Figure 182: MEA Market Value Share (%) and BPS Analysis by Country, 2023 to 2033

Figure 183: MEA Market Y-o-Y Growth (%) Projections by Country, 2023 to 2033

Figure 184: MEA Market Value (US$ Million) Analysis by Animal Type, 2018 to 2033

Figure 185: MEA Market Value Share (%) and BPS Analysis by Animal Type, 2023 to 2033

Figure 186: MEA Market Y-o-Y Growth (%) Projections by Animal Type, 2023 to 2033

Figure 187: MEA Market Value (US$ Million) Analysis by Therapy Type, 2018 to 2033

Figure 188: MEA Market Value Share (%) and BPS Analysis by Therapy Type, 2023 to 2033

Figure 189: MEA Market Y-o-Y Growth (%) Projections by Therapy Type, 2023 to 2033

Figure 190: MEA Market Value (US$ Million) Analysis by Indication, 2018 to 2033

Figure 191: MEA Market Value Share (%) and BPS Analysis by Indication, 2023 to 2033

Figure 192: MEA Market Y-o-Y Growth (%) Projections by Indication, 2023 to 2033

Figure 193: MEA Market Value (US$ Million) Analysis by End-use, 2018 to 2033

Figure 194: MEA Market Value Share (%) and BPS Analysis by End-use, 2023 to 2033

Figure 195: MEA Market Y-o-Y Growth (%) Projections by End-use, 2023 to 2033

Figure 196: MEA Market Attractiveness by Animal Type, 2023 to 2033

Figure 197: MEA Market Attractiveness by Therapy Type, 2023 to 2033

Figure 198: MEA Market Attractiveness by Indication, 2023 to 2033

Figure 199: MEA Market Attractiveness by End-use, 2023 to 2033

Figure 200: MEA Market Attractiveness by Country, 2023 to 2033

Frequently Asked Questions

What is the anticipated growth rate for the Veterinary rehabilitation services market until 2033?

FMI projects the global Veterinary rehabilitation services market to expand at a 9.06% value CAGR by 2033.

What is the estimated market value of the Veterinary rehabilitation services market expected in 2023?

The global Veterinary rehabilitation services market is estimated at a market value of USD 882 million.

Which region will witness the highest CAGR growth in the Veterinary rehabilitation services market?

Asia Pacific is anticipated to witness the fastest CAGR of 13% during the forecast period.

By Animal type, which segment is going to dominate the Veterinary rehabilitation services market by 2033?

The companion animal segment is expected to dominate the application segment with a market revenue share of around 70% by 2033.

Explore Similar Insights

Future Market Insights

Veterinary Rehabilitation Services Market