Veterinary Antibiotics Market
Analysis of Veterinary Antibiotics Market by Tetracyclines, Penicillins, Macrolides, Sulphonamides, Aminoglycosides, and Other Product Types
Rising Investments in Animal Healthcare to Boost Veterinary Antibiotics Market, Read FMI's Recent Report for Deeper Market Insights from 30+ Nations
Veterinary Antibiotics Market Outlook (2023 to 2033)
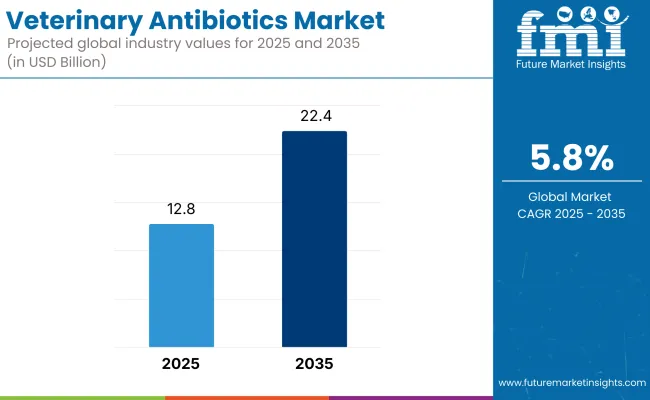
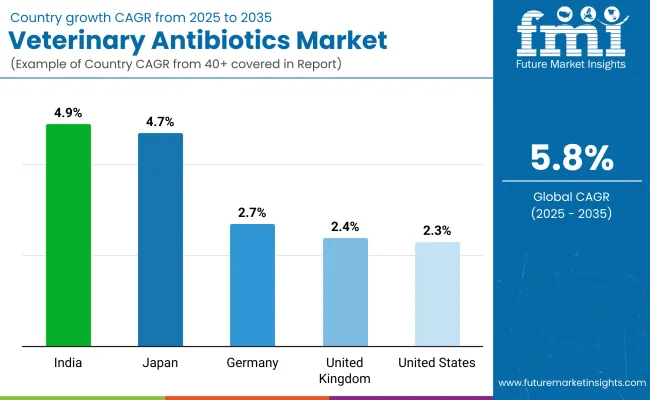
The global veterinary antibiotics market is anticipated to be worth US$ 11,453.3 million in 2023. The veterinary antibiotics market is expected to expand at a sluggish CAGR of 5.8% and reach US$ 20,154.0 million by 2033.
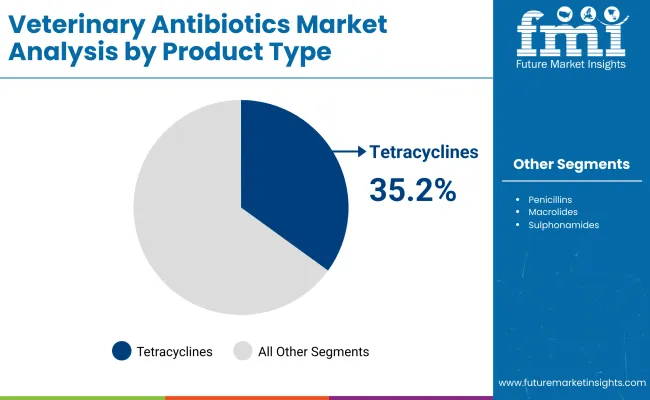
The expanding animal healthcare industry, combined with the industry's ongoing innovation, is driving growth in the veterinary antibiotics market. Tetracycline is anticipated to hold a leading market share in the global demand for veterinary antibiotics based on product type. This is due to its widespread application in animals used for food production.
Additionally, the demand for veterinary antibiotics is facilitated by people's increased knowledge of how critical providing basic medical care for their pets is. The prevalence of zoonotic diseases and the implementation of legislation intended to stop the spread of animal diseases are just a few factors that have contributed significantly to the growth of the veterinary antibiotics market.
The growth of this market is anticipated to be further propelled by rising expenditures on animal healthcare, as well as increasing demand for pet insurance. It is anticipated that in the coming years, the untapped emerging markets such as China, India, and Brazil, as well as growth in the overall companion animal population, are expected to offer significant growth opportunities to the veterinary antibiotics market players.
Attribute | Details |
---|---|
Veterinary Antibiotics Market Share (2022) |
US$ 10,911.5 million |
Veterinary Antibiotics Market Share (2023) |
US$ 11,453.3 million |
Veterinary Antibiotics Market Share (2033) |
US$ 20,154.0 million |
Veterinary Antibiotics Market Share (2023 to 2033) |
5.8% |
On the other hand, only a limited amount of new antibiotics are being developed, there is a growing resistance to antimicrobials and antibiotics, and there is an increasing focus on good husbandry and hygiene practices. All of these factors are expected to impede the growth of the veterinary antibiotics market.
Don't pay for what you don't need
Customize your report by selecting specific countries or regions and save 30%!
What Are the Key Drivers and Restraints of the Market?
Drivers:
It is anticipated that factors such as rising awareness about zoonotic disease, rising incidence of disease outbreaks in animals, and rising demand for food products derived from animals, promoting the veterinary antibiotics market share.
Moreover, the implementation of stringent regulations to prevent animal diseases, elevating the animal population, and increasing pet adoption are likely to drive the demand for veterinary antibiotics across the globe.
The sales of veterinary antibiotics are being driven upwards on a global scale by several factors, including the expanding market for pet health insurance and the rising cost of medical care.
Restraints:
In livestock, the spread of antibiotic-resistant microorganisms is a key concern. Pathogens found in food-producing animals can be transmitted to humans by direct contact between humans and animals or through the food chain and environmental exposure. An increase in people are dying as a result of antimicrobial-resistant diseases in the human population.
According to the World Health Organization, more than one-third of food-borne illness-related deaths occur in children under the age of five. Microbes, such as bacteria, are to blame for the majority of food-borne infections.
Infections caused by bacteria that are resistant to more than one class of antibiotics are becoming increasingly difficult to cure. As a result, veterinarians advise treating animals with lower concentrations of antibiotics.
As a result of these measures, antibiotic use around the world may be greatly reduced. This is expected to restrain the veterinary antibiotics market.
What are the Trends in the Veterinary Antibiotics Industry?
Opportunities:
Reduced anxiety, normalized blood pressure, fewer cardiac arrhythmias, and increased psychological well-being are all linked to the adoption of companion animals. These advantages have helped pet owners worldwide.
Since 2014, the United States dog population has grown from 77.8 million to 89.4 million, and the cat population has grown from 85.8 million to 95.6 million. The growth of allied sectors, such as animal antimicrobials and antibiotics, is anticipated to boost the need for veterinary antibiotics as pet owners' desire to invest in the health and well-being of their pets increases.
Threats:
An antimicrobial or an antibiotic is used to improve the health and productivity of livestock and companion animals. For the sake of animal health and efficacy, numerous authorities have established strict rules to approve animal pharmaceutical goods.
Veterinarian pharmaceutical products must meet rigorous standards set by these regulatory agencies before they may be approved. New veterinary pharmaceutical products, such as antimicrobials, vaccinations, parasiticides, and other pharmaceutical goods, are subject to strict regulatory criteria in countries such as Australia, Japan, and China.
Typically, it can take up to 11 years and cost 75 to 100 million dollars to have a veterinary drug approved in the United States and Europe (from product development to commercialization).
Additionally, it's understandable that the pharmaceutical industry is wary of investing in research and development of antimicrobial and antibiotic drugs to combat novel pathogens and parasite infections. This could be a huge challenge for the veterinary antibiotics market growth.
Segment Analysis
Which is the Leading Segment in the Veterinary Antibiotics Market by Product?
In 2022, 48.20% of the global veterinary antibiotics market for animals was made up of tetracyclines. Tetracyclines have many benefits, such as being the most effective against pathogenic microorganisms, being easily absorbed, having low toxicity, and being cheap compared to other antimicrobial and antibiotic products for animals.
Due to these benefits, this product segment has a large share of the veterinary antibiotics market. During the forecast period, the fluoroquinolones segment is expected to grow at a rate of 8%.
Fluoroquinolones are used more by end users as they work better at low concentrations, get into tissues quickly, and can be given in different ways.
Which Route of Administration Segment is Leading the Veterinary Antibiotics Market?
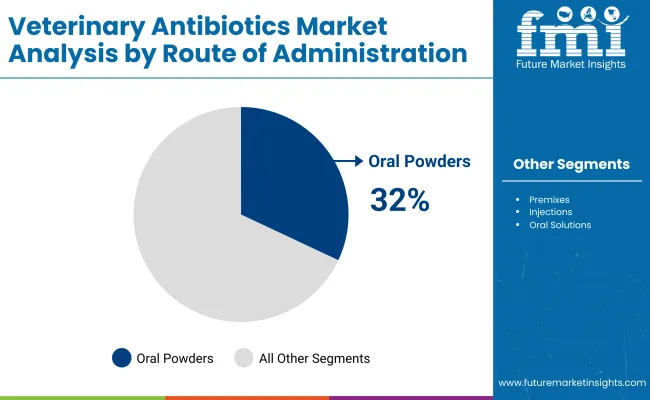
In 2022, 46.10% of the global veterinary antibiotics market came from the premixes segment. The large share of this segment can be explained by the benefits of premixes, such as making it easier to give the medicine and less likely to change shape or absorb water.
During the period of the forecast, the injections segment is expected to have a substantial CAGR, at 4.9%. This veterinary antibiotic market share is expected to grow due to the benefits, like getting drugs right away and seeing their effects quickly.
Regional Analysis
What is the North America Growth Outlook for the Veterinary Antibiotics Market?
Owing to the rising animal farming, rising expenditures on animal healthcare, and rising demand for food products derived from animals, North America held the dominant revenue share of 35.6% in the global veterinary antibiotics market in 2022. This was due to the region's growing demand for animal food products.
According to a report published by the FDA in 2014, over 80% of all antibiotics sold in the United States were purchased for application in animal husbandry. According to the same source, the overall quantity of antibiotics administered to animals used for the production of food in the United States climbed by 16.1% between 2009 and 2012, reaching a total of 14.61 million kilos annually.
How is Asia Pacific Performing in the Veterinary Antibiotics Market?
During the forecast period, the Asia Pacific region is expected to increase at a CAGR of 5.4%. The APAC market for animal-derived food is growing as a result of factors such as an expanding animal population and an increased demand for animal-derived food products.
Due to the expanding poultry, meat, and dairy consumption and increasing awareness of animal health in emerging nations like India, the Asia Pacific veterinary antibiotics market is expected to grow at a faster rate in the region.
The veterinary antibiotics market study shows that national dietary changes in India have been documented. Meat intake among the young urban population has increased significantly over the past few decades.
As a result of the rising demand for animal proteins, fish, poultry, and pigs are now routinely bred with antibiotics to boost growth. In addition, the OECD reports that China is the world's leading producer of pork, with about 31.3 kg/capita produced in 2016, ahead of chicken and beef.
Get the data you need at a Fraction of the cost
Personalize your report by choosing insights you need
and save 40%!
How are Start-ups Influencing the Veterinary Antibiotics Market?
Companies are increasingly partnering with other players to boost product innovation in the veterinary antibiotics industry. As the veterinary antibiotics industry becomes more competitive, new veterinary medications businesses are expanding into new markets and producing drugs by sharing their knowledge and expertise with other companies.
Growth in the veterinary antibiotics market is anticipated to be fueled by the rising use of pet insurance. The global pet insurance industry is virtually untouched, with exceptionally low penetration rates, giving a tremendous market opportunity for new startups to rise.
New companies are emerging in the veterinary antibiotics market and tapping the market potential.
How Key Players are Contributing to the Veterinary Antibiotics Market?
The veterinary antibiotics market is seeing an increase in collaboration between players. The primary reason is that collaborations provide companies access to a greater range of products and a more diverse technology set. Antibiotics generated as a result of this cooperation are of higher quality and manufactured faster.
Recent Developments Observed by FMI:
- The 'Nandi' Portal was introduced in June 2023 to enable online approval of new veterinary drugs and vaccines in India. Nandi is an acronym for New Drug and Immunization Device Approval. As the entire form indicates, Nandi intends to make it easier for novel veterinary medications and vaccinations to receive NOCs.
- For the Indian Pharmacopoeia (IP) 2022, the Indian Pharmacopoeia Commission (IPC) introduced seven new veterinary monographs and eight new chemical monographs with the intention of boosting both public and animal health in the nation. Carprofen pills, Pimobendan capsules, Selamectin, Tilmicosin, Tilmicosin injectable, and Triclabendazole are among the recently released veterinary monographs.
- A partnership between the Pride Veterinary Medical Community and the United States-based animal health technology business Covetous was announced in June of 2021. Covetrus is situated in the United States. With the help of this partnership, Covetrus can offer cutting-edge veterinary medicine, which in turn empowers veterinary healthcare professionals.
- Adiva GmbH and Bayer AG partnered to produce therapeutic antibodies for veterinary medicine in April 2019.
Key Players in the Global Market
- Zoetis Inc.
- Merck & Co.
- Bayer AG
- Sanofi
- Eli Lilly and Company
- Ceva Sante Animale
- Others
Scope of the Report
Attribute | Details |
---|---|
Forecast Period |
2023 to 2033 |
Historical Data Available for |
2018 to 2022 |
Market Analysis |
US$ million for Value |
Key Regions Covered |
|
Key Countries Covered |
|
Key Segments Covered |
|
Report Coverage |
Market Forecast, Company Share Analysis, Competition Intelligence, Trend Analysis, Market Dynamics and Challenges, and Strategic Growth Initiatives |
Veterinary Antibiotics Market Segmentation
By Product Type:
- Tetracyclines
- Penicillins
- Macrolides
- Sulphonamides
- Aminoglycosides
- Others
By Route of Administration:
- Premixes
- Injections
- Oral Powders
- Oral Solutions
- Others
By Animal Type:
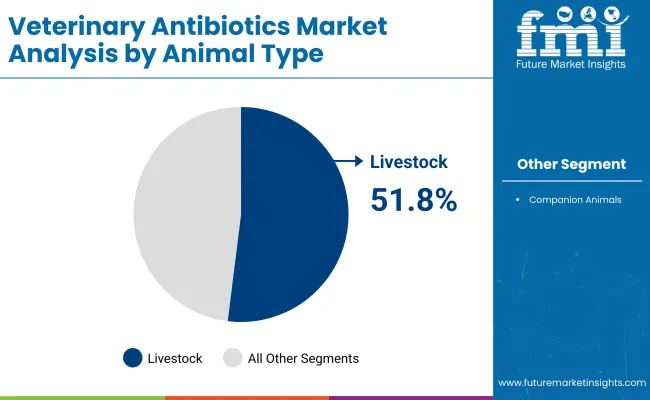
- Food-processing Animals
- Companion Animals
By Region:
- North America
- Latin America
- Europe
- Asia Pacific
- The Middle East & Africa (MEA)
Frequently Asked Questions
How Big is the Veterinary Antibiotics Market in 2023?
The market is valued at US$ 11.4 billion in 2023.
Who are the Top Market Players?
Zoetis Inc., Merck & Co., and Bayer AG are the top market players.
What is the Growth Forecast for the Market?
The market is forecast to register a CAGR of 5.8% through 2033.
Which is the Key Segment by Product?
The Tetracyclines segment is likely to remain preferred through 2033.
Which is the Top Trend in the Veterinary Antibiotics Market?
Increasing awareness about the zoonotic disease is encouraging sales.
Table of Content
1. Executive Summary 1.1. Global Market Outlook 1.2. Demand-side Trends 1.3. Supply-side Trends 1.4. Technology Roadmap Analysis 1.5. Analysis and Recommendations 2. Market Overview 2.1. Market Coverage / Taxonomy 2.2. Market Definition / Scope / Limitations 3. Market Background 3.1. Market Dynamics 3.1.1. Drivers 3.1.2. Restraints 3.1.3. Opportunity 3.1.4. Trends 3.2. Scenario Forecast 3.2.1. Demand in Optimistic Scenario 3.2.2. Demand in Likely Scenario 3.2.3. Demand in Conservative Scenario 3.3. Opportunity Map Analysis 3.4. Investment Feasibility Matrix 3.5. PESTLE and Porter’s Analysis 3.6. Regulatory Landscape 3.6.1. By Key Regions 3.6.2. By Key Countries 3.7. Regional Parent Market Outlook 4. Global Market Analysis 2018 to 2022 and Forecast, 2023 to 2033 4.1. Historical Market Size Value (US$ Million) Analysis, 2018 to 2022 4.2. Current and Future Market Size Value (US$ Million) Projections, 2023 to 2033 4.2.1. Y-o-Y Growth Trend Analysis 4.2.2. Absolute $ Opportunity Analysis 5. Global Market Analysis 2018 to 2022 and Forecast 2023 to 2033, By Product Type 5.1. Introduction / Key Findings 5.2. Historical Market Size Value (US$ Million) Analysis By Product Type, 2018 to 2022 5.3. Current and Future Market Size Value (US$ Million) Analysis and Forecast By Product Type, 2023 to 2033 5.3.1. Tetracyclines 5.3.2. Penicillins 5.3.3. Macrolides 5.3.4. Sulphonamides 5.3.5. Aminoglycosides 5.3.6. Others 5.4. Y-o-Y Growth Trend Analysis By Product Type, 2018 to 2022 5.5. Absolute $ Opportunity Analysis By Product Type, 2023 to 2033 6. Global Market Analysis 2018 to 2022 and Forecast 2023 to 2033, By Route of Administration 6.1. Introduction / Key Findings 6.2. Historical Market Size Value (US$ Million) Analysis By Route of Administration, 2018 to 2022 6.3. Current and Future Market Size Value (US$ Million) Analysis and Forecast By Route of Administration, 2023 to 2033 6.3.1. Premixes 6.3.2. Injections 6.3.3. Oral Powders 6.3.4. Oral Solutions 6.3.5. Others 6.4. Y-o-Y Growth Trend Analysis By Route of Administration, 2018 to 2022 6.5. Absolute $ Opportunity Analysis By Route of Administration, 2023 to 2033 7. Global Market Analysis 2018 to 2022 and Forecast 2023 to 2033, By Animal Type 7.1. Introduction / Key Findings 7.2. Historical Market Size Value (US$ Million) Analysis by Animal Type, 2018 to 2022 7.3. Current and Future Market Size Value (US$ Million) Analysis and Forecast by Animal Type, 2023 to 2033 7.3.1. Food-producing Animals 7.3.2. Companion Animals 7.4. Y-o-Y Growth Trend Analysis by Animal Type, 2018 to 2022 7.5. Absolute $ Opportunity Analysis by Animal Type, 2023 to 2033 8. Global Market Analysis 2018 to 2022 and Forecast 2023 to 2033, By Region 8.1. Introduction 8.2. Historical Market Size Value (US$ Million) Analysis By Region, 2018 to 2022 8.3. Current Market Size Value (US$ Million) Analysis and Forecast By Region, 2023 to 2033 8.3.1. North America 8.3.2. Latin America 8.3.3. Western Europe 8.3.4. Eastern Europe 8.3.5. South Asia and Pacific 8.3.6. East Asia 8.3.7. Middle East and Africa 8.4. Market Attractiveness Analysis By Region 9. North America Market Analysis 2018 to 2022 and Forecast 2023 to 2033, By Country 9.1. Historical Market Size Value (US$ Million) Trend Analysis By Market Taxonomy, 2018 to 2022 9.2. Market Size Value (US$ Million) Forecast By Market Taxonomy, 2023 to 2033 9.2.1. By Country 9.2.1.1. The USA 9.2.1.2. Canada 9.2.2. By Product Type 9.2.3. By Route of Administration 9.2.4. By Animal Type 9.3. Market Attractiveness Analysis 9.3.1. By Country 9.3.2. By Product Type 9.3.3. By Route of Administration 9.3.4. By Animal Type 9.4. Key Takeaways 10. Latin America Market Analysis 2018 to 2022 and Forecast 2023 to 2033, By Country 10.1. Historical Market Size Value (US$ Million) Trend Analysis By Market Taxonomy, 2018 to 2022 10.2. Market Size Value (US$ Million) Forecast By Market Taxonomy, 2023 to 2033 10.2.1. By Country 10.2.1.1. Brazil 10.2.1.2. Mexico 10.2.1.3. Rest of Latin America 10.2.2. By Product Type 10.2.3. By Route of Administration 10.2.4. By Animal Type 10.3. Market Attractiveness Analysis 10.3.1. By Country 10.3.2. By Product Type 10.3.3. By Route of Administration 10.3.4. By Animal Type 10.4. Key Takeaways 11. Western Europe Market Analysis 2018 to 2022 and Forecast 2023 to 2033, By Country 11.1. Historical Market Size Value (US$ Million) Trend Analysis By Market Taxonomy, 2018 to 2022 11.2. Market Size Value (US$ Million) Forecast By Market Taxonomy, 2023 to 2033 11.2.1. By Country 11.2.1.1. Germany 11.2.1.2. United Kingdom 11.2.1.3. France 11.2.1.4. Spain 11.2.1.5. Italy 11.2.1.6. Rest of Western Europe 11.2.2. By Product Type 11.2.3. By Route of Administration 11.2.4. By Animal Type 11.3. Market Attractiveness Analysis 11.3.1. By Country 11.3.2. By Product Type 11.3.3. By Route of Administration 11.3.4. By Animal Type 11.4. Key Takeaways 12. Eastern Europe Market Analysis 2018 to 2022 and Forecast 2023 to 2033, By Country 12.1. Historical Market Size Value (US$ Million) Trend Analysis By Market Taxonomy, 2018 to 2022 12.2. Market Size Value (US$ Million) Forecast By Market Taxonomy, 2023 to 2033 12.2.1. By Country 12.2.1.1. Poland 12.2.1.2. Russia 12.2.1.3. Czech Republic 12.2.1.4. Romania 12.2.1.5. Rest of Eastern Europe 12.2.2. By Product Type 12.2.3. By Route of Administration 12.2.4. By Animal Type 12.3. Market Attractiveness Analysis 12.3.1. By Country 12.3.2. By Product Type 12.3.3. By Route of Administration 12.3.4. By Animal Type 12.4. Key Takeaways 13. South Asia and Pacific Market Analysis 2018 to 2022 and Forecast 2023 to 2033, By Country 13.1. Historical Market Size Value (US$ Million) Trend Analysis By Market Taxonomy, 2018 to 2022 13.2. Market Size Value (US$ Million) Forecast By Market Taxonomy, 2023 to 2033 13.2.1. By Country 13.2.1.1. India 13.2.1.2. Bangladesh 13.2.1.3. Australia 13.2.1.4. New Zealand 13.2.1.5. Rest of South Asia and Pacific 13.2.2. By Product Type 13.2.3. By Route of Administration 13.2.4. By Animal Type 13.3. Market Attractiveness Analysis 13.3.1. By Country 13.3.2. By Product Type 13.3.3. By Route of Administration 13.3.4. By Animal Type 13.4. Key Takeaways 14. East Asia Market Analysis 2018 to 2022 and Forecast 2023 to 2033, By Country 14.1. Historical Market Size Value (US$ Million) Trend Analysis By Market Taxonomy, 2018 to 2022 14.2. Market Size Value (US$ Million) Forecast By Market Taxonomy, 2023 to 2033 14.2.1. By Country 14.2.1.1. China 14.2.1.2. Japan 14.2.1.3. South Korea 14.2.2. By Product Type 14.2.3. By Route of Administration 14.2.4. By Animal Type 14.3. Market Attractiveness Analysis 14.3.1. By Country 14.3.2. By Product Type 14.3.3. By Route of Administration 14.3.4. By Animal Type 14.4. Key Takeaways 15. Middle East and Africa Market Analysis 2018 to 2022 and Forecast 2023 to 2033, By Country 15.1. Historical Market Size Value (US$ Million) Trend Analysis By Market Taxonomy, 2018 to 2022 15.2. Market Size Value (US$ Million) Forecast By Market Taxonomy, 2023 to 2033 15.2.1. By Country 15.2.1.1. GCC Countries 15.2.1.2. South Africa 15.2.1.3. Israel 15.2.1.4. Rest of MEA 15.2.2. By Product Type 15.2.3. By Route of Administration 15.2.4. By Animal Type 15.3. Market Attractiveness Analysis 15.3.1. By Country 15.3.2. By Product Type 15.3.3. By Route of Administration 15.3.4. By Animal Type 15.4. Key Takeaways 16. Key Countries Market Analysis 16.1. USA 16.1.1. Pricing Analysis 16.1.2. Market Share Analysis, 2022 16.1.2.1. By Product Type 16.1.2.2. By Route of Administration 16.1.2.3. By Animal Type 16.2. Canada 16.2.1. Pricing Analysis 16.2.2. Market Share Analysis, 2022 16.2.2.1. By Product Type 16.2.2.2. By Route of Administration 16.2.2.3. By Animal Type 16.3. Brazil 16.3.1. Pricing Analysis 16.3.2. Market Share Analysis, 2022 16.3.2.1. By Product Type 16.3.2.2. By Route of Administration 16.3.2.3. By Animal Type 16.4. Mexico 16.4.1. Pricing Analysis 16.4.2. Market Share Analysis, 2022 16.4.2.1. By Product Type 16.4.2.2. By Route of Administration 16.4.2.3. By Animal Type 16.5. Germany 16.5.1. Pricing Analysis 16.5.2. Market Share Analysis, 2022 16.5.2.1. By Product Type 16.5.2.2. By Route of Administration 16.5.2.3. By Animal Type 16.6. United Kingdom 16.6.1. Pricing Analysis 16.6.2. Market Share Analysis, 2022 16.6.2.1. By Product Type 16.6.2.2. By Route of Administration 16.6.2.3. By Animal Type 16.7. France 16.7.1. Pricing Analysis 16.7.2. Market Share Analysis, 2022 16.7.2.1. By Product Type 16.7.2.2. By Route of Administration 16.7.2.3. By Animal Type 16.8. Spain 16.8.1. Pricing Analysis 16.8.2. Market Share Analysis, 2022 16.8.2.1. By Product Type 16.8.2.2. By Route of Administration 16.8.2.3. By Animal Type 16.9. Italy 16.9.1. Pricing Analysis 16.9.2. Market Share Analysis, 2022 16.9.2.1. By Product Type 16.9.2.2. By Route of Administration 16.9.2.3. By Animal Type 16.10. Poland 16.10.1. Pricing Analysis 16.10.2. Market Share Analysis, 2022 16.10.2.1. By Product Type 16.10.2.2. By Route of Administration 16.10.2.3. By Animal Type 16.11. Russia 16.11.1. Pricing Analysis 16.11.2. Market Share Analysis, 2022 16.11.2.1. By Product Type 16.11.2.2. By Route of Administration 16.11.2.3. By Animal Type 16.12. Czech Republic 16.12.1. Pricing Analysis 16.12.2. Market Share Analysis, 2022 16.12.2.1. By Product Type 16.12.2.2. By Route of Administration 16.12.2.3. By Animal Type 16.13. Romania 16.13.1. Pricing Analysis 16.13.2. Market Share Analysis, 2022 16.13.2.1. By Product Type 16.13.2.2. By Route of Administration 16.13.2.3. By Animal Type 16.14. India 16.14.1. Pricing Analysis 16.14.2. Market Share Analysis, 2022 16.14.2.1. By Product Type 16.14.2.2. By Route of Administration 16.14.2.3. By Animal Type 16.15. Bangladesh 16.15.1. Pricing Analysis 16.15.2. Market Share Analysis, 2022 16.15.2.1. By Product Type 16.15.2.2. By Route of Administration 16.15.2.3. By Animal Type 16.16. Australia 16.16.1. Pricing Analysis 16.16.2. Market Share Analysis, 2022 16.16.2.1. By Product Type 16.16.2.2. By Route of Administration 16.16.2.3. By Animal Type 16.17. New Zealand 16.17.1. Pricing Analysis 16.17.2. Market Share Analysis, 2022 16.17.2.1. By Product Type 16.17.2.2. By Route of Administration 16.17.2.3. By Animal Type 16.18. China 16.18.1. Pricing Analysis 16.18.2. Market Share Analysis, 2022 16.18.2.1. By Product Type 16.18.2.2. By Route of Administration 16.18.2.3. By Animal Type 16.19. Japan 16.19.1. Pricing Analysis 16.19.2. Market Share Analysis, 2022 16.19.2.1. By Product Type 16.19.2.2. By Route of Administration 16.19.2.3. By Animal Type 16.20. South Korea 16.20.1. Pricing Analysis 16.20.2. Market Share Analysis, 2022 16.20.2.1. By Product Type 16.20.2.2. By Route of Administration 16.20.2.3. By Animal Type 16.21. GCC Countries 16.21.1. Pricing Analysis 16.21.2. Market Share Analysis, 2022 16.21.2.1. By Product Type 16.21.2.2. By Route of Administration 16.21.2.3. By Animal Type 16.22. South Africa 16.22.1. Pricing Analysis 16.22.2. Market Share Analysis, 2022 16.22.2.1. By Product Type 16.22.2.2. By Route of Administration 16.22.2.3. By Animal Type 16.23. Israel 16.23.1. Pricing Analysis 16.23.2. Market Share Analysis, 2022 16.23.2.1. By Product Type 16.23.2.2. By Route of Administration 16.23.2.3. By Animal Type 17. Market Structure Analysis 17.1. Competition Dashboard 17.2. Competition Benchmarking 17.3. Market Share Analysis of Top Players 17.3.1. By Regional 17.3.2. By Product Type 17.3.3. By Route of Administration 17.3.4. By Animal Type 18. Competition Analysis 18.1. Competition Deep Dive 18.1.1. Zoetis, Inc. 18.1.1.1. Overview 18.1.1.2. Product Portfolio 18.1.1.3. Profitability by Market Segments 18.1.1.4. Sales Footprint 18.1.1.5. Strategy Overview 18.1.1.5.1. Marketing Strategy 18.1.2. Merck & Co. 18.1.2.1. Overview 18.1.2.2. Product Portfolio 18.1.2.3. Profitability by Market Segments 18.1.2.4. Sales Footprint 18.1.2.5. Strategy Overview 18.1.2.5.1. Marketing Strategy 18.1.3. Bayer AG 18.1.3.1. Overview 18.1.3.2. Product Portfolio 18.1.3.3. Profitability by Market Segments 18.1.3.4. Sales Footprint 18.1.3.5. Strategy Overview 18.1.3.5.1. Marketing Strategy 18.1.4. Sanofi 18.1.4.1. Overview 18.1.4.2. Product Portfolio 18.1.4.3. Profitability by Market Segments 18.1.4.4. Sales Footprint 18.1.4.5. Strategy Overview 18.1.4.5.1. Marketing Strategy 18.1.5. Eli Lilly and Company 18.1.5.1. Overview 18.1.5.2. Product Portfolio 18.1.5.3. Profitability by Market Segments 18.1.5.4. Sales Footprint 18.1.5.5. Strategy Overview 18.1.5.5.1. Marketing Strategy 18.1.6. Ceva Sante Animale 18.1.6.1. Overview 18.1.6.2. Product Portfolio 18.1.6.3. Profitability by Market Segments 18.1.6.4. Sales Footprint 18.1.6.5. Strategy Overview 18.1.6.5.1. Marketing Strategy 18.1.7. Elanco Animal Health 18.1.7.1. Overview 18.1.7.2. Product Portfolio 18.1.7.3. Profitability by Market Segments 18.1.7.4. Sales Footprint 18.1.7.5. Strategy Overview 18.1.7.5.1. Marketing Strategy 18.1.8. Virbac 18.1.8.1. Overview 18.1.8.2. Product Portfolio 18.1.8.3. Profitability by Market Segments 18.1.8.4. Sales Footprint 18.1.8.5. Strategy Overview 18.1.8.5.1. Marketing Strategy 18.1.9. HIPRA 18.1.9.1. Overview 18.1.9.2. Product Portfolio 18.1.9.3. Profitability by Market Segments 18.1.9.4. Sales Footprint 18.1.9.5. Strategy Overview 18.1.9.5.1. Marketing Strategy 18.1.10. Lutim Pharma 18.1.10.1. Overview 18.1.10.2. Product Portfolio 18.1.10.3. Profitability by Market Segments 18.1.10.4. Sales Footprint 18.1.10.5. Strategy Overview 18.1.10.5.1. Marketing Strategy 19. Assumptions & Acronyms Used 20. Research Methodology
Don't pay for what you don't need
Customize your report by selecting specific countries or regions and save 30%!
List of Tables
Table 1: Global Market Value (US$ Million) Forecast by Region, 2018 to 2033 Table 2: Global Market Value (US$ Million) Forecast by Product Type, 2018 to 2033 Table 3: Global Market Value (US$ Million) Forecast by Route of Administration, 2018 to 2033 Table 4: Global Market Value (US$ Million) Forecast by Animal Type, 2018 to 2033 Table 5: North America Market Value (US$ Million) Forecast by Country, 2018 to 2033 Table 6: North America Market Value (US$ Million) Forecast by Product Type, 2018 to 2033 Table 7: North America Market Value (US$ Million) Forecast by Route of Administration, 2018 to 2033 Table 8: North America Market Value (US$ Million) Forecast by Animal Type, 2018 to 2033 Table 9: Latin America Market Value (US$ Million) Forecast by Country, 2018 to 2033 Table 10: Latin America Market Value (US$ Million) Forecast by Product Type, 2018 to 2033 Table 11: Latin America Market Value (US$ Million) Forecast by Route of Administration, 2018 to 2033 Table 12: Latin America Market Value (US$ Million) Forecast by Animal Type, 2018 to 2033 Table 13: Western Europe Market Value (US$ Million) Forecast by Country, 2018 to 2033 Table 14: Western Europe Market Value (US$ Million) Forecast by Product Type, 2018 to 2033 Table 15: Western Europe Market Value (US$ Million) Forecast by Route of Administration, 2018 to 2033 Table 16: Western Europe Market Value (US$ Million) Forecast by Animal Type, 2018 to 2033 Table 17: Eastern Europe Market Value (US$ Million) Forecast by Country, 2018 to 2033 Table 18: Eastern Europe Market Value (US$ Million) Forecast by Product Type, 2018 to 2033 Table 19: Eastern Europe Market Value (US$ Million) Forecast by Route of Administration, 2018 to 2033 Table 20: Eastern Europe Market Value (US$ Million) Forecast by Animal Type, 2018 to 2033 Table 21: South Asia and Pacific Market Value (US$ Million) Forecast by Country, 2018 to 2033 Table 22: South Asia and Pacific Market Value (US$ Million) Forecast by Product Type, 2018 to 2033 Table 23: South Asia and Pacific Market Value (US$ Million) Forecast by Route of Administration, 2018 to 2033 Table 24: South Asia and Pacific Market Value (US$ Million) Forecast by Animal Type, 2018 to 2033 Table 25: East Asia Market Value (US$ Million) Forecast by Country, 2018 to 2033 Table 26: East Asia Market Value (US$ Million) Forecast by Product Type, 2018 to 2033 Table 27: East Asia Market Value (US$ Million) Forecast by Route of Administration, 2018 to 2033 Table 28: East Asia Market Value (US$ Million) Forecast by Animal Type, 2018 to 2033 Table 29: Middle East and Africa Market Value (US$ Million) Forecast by Country, 2018 to 2033 Table 30: Middle East and Africa Market Value (US$ Million) Forecast by Product Type, 2018 to 2033 Table 31: Middle East and Africa Market Value (US$ Million) Forecast by Route of Administration, 2018 to 2033 Table 32: Middle East and Africa Market Value (US$ Million) Forecast by Animal Type, 2018 to 2033
List of Charts
Figure 1: Global Market Value (US$ Million) by Product Type, 2023 to 2033 Figure 2: Global Market Value (US$ Million) by Route of Administration, 2023 to 2033 Figure 3: Global Market Value (US$ Million) by Animal Type, 2023 to 2033 Figure 4: Global Market Value (US$ Million) by Region, 2023 to 2033 Figure 5: Global Market Value (US$ Million) Analysis by Region, 2018 to 2033 Figure 6: Global Market Value Share (%) and BPS Analysis by Region, 2023 to 2033 Figure 7: Global Market Y-o-Y Growth (%) Projections by Region, 2023 to 2033 Figure 8: Global Market Value (US$ Million) Analysis by Product Type, 2018 to 2033 Figure 9: Global Market Value Share (%) and BPS Analysis by Product Type, 2023 to 2033 Figure 10: Global Market Y-o-Y Growth (%) Projections by Product Type, 2023 to 2033 Figure 11: Global Market Value (US$ Million) Analysis by Route of Administration, 2018 to 2033 Figure 12: Global Market Value Share (%) and BPS Analysis by Route of Administration, 2023 to 2033 Figure 13: Global Market Y-o-Y Growth (%) Projections by Route of Administration, 2023 to 2033 Figure 14: Global Market Value (US$ Million) Analysis by Animal Type, 2018 to 2033 Figure 15: Global Market Value Share (%) and BPS Analysis by Animal Type, 2023 to 2033 Figure 16: Global Market Y-o-Y Growth (%) Projections by Animal Type, 2023 to 2033 Figure 17: Global Market Attractiveness by Product Type, 2023 to 2033 Figure 18: Global Market Attractiveness by Route of Administration, 2023 to 2033 Figure 19: Global Market Attractiveness by Animal Type, 2023 to 2033 Figure 20: Global Market Attractiveness by Region, 2023 to 2033 Figure 21: North America Market Value (US$ Million) by Product Type, 2023 to 2033 Figure 22: North America Market Value (US$ Million) by Route of Administration, 2023 to 2033 Figure 23: North America Market Value (US$ Million) by Animal Type, 2023 to 2033 Figure 24: North America Market Value (US$ Million) by Country, 2023 to 2033 Figure 25: North America Market Value (US$ Million) Analysis by Country, 2018 to 2033 Figure 26: North America Market Value Share (%) and BPS Analysis by Country, 2023 to 2033 Figure 27: North America Market Y-o-Y Growth (%) Projections by Country, 2023 to 2033 Figure 28: North America Market Value (US$ Million) Analysis by Product Type, 2018 to 2033 Figure 29: North America Market Value Share (%) and BPS Analysis by Product Type, 2023 to 2033 Figure 30: North America Market Y-o-Y Growth (%) Projections by Product Type, 2023 to 2033 Figure 31: North America Market Value (US$ Million) Analysis by Route of Administration, 2018 to 2033 Figure 32: North America Market Value Share (%) and BPS Analysis by Route of Administration, 2023 to 2033 Figure 33: North America Market Y-o-Y Growth (%) Projections by Route of Administration, 2023 to 2033 Figure 34: North America Market Value (US$ Million) Analysis by Animal Type, 2018 to 2033 Figure 35: North America Market Value Share (%) and BPS Analysis by Animal Type, 2023 to 2033 Figure 36: North America Market Y-o-Y Growth (%) Projections by Animal Type, 2023 to 2033 Figure 37: North America Market Attractiveness by Product Type, 2023 to 2033 Figure 38: North America Market Attractiveness by Route of Administration, 2023 to 2033 Figure 39: North America Market Attractiveness by Animal Type, 2023 to 2033 Figure 40: North America Market Attractiveness by Country, 2023 to 2033 Figure 41: Latin America Market Value (US$ Million) by Product Type, 2023 to 2033 Figure 42: Latin America Market Value (US$ Million) by Route of Administration, 2023 to 2033 Figure 43: Latin America Market Value (US$ Million) by Animal Type, 2023 to 2033 Figure 44: Latin America Market Value (US$ Million) by Country, 2023 to 2033 Figure 45: Latin America Market Value (US$ Million) Analysis by Country, 2018 to 2033 Figure 46: Latin America Market Value Share (%) and BPS Analysis by Country, 2023 to 2033 Figure 47: Latin America Market Y-o-Y Growth (%) Projections by Country, 2023 to 2033 Figure 48: Latin America Market Value (US$ Million) Analysis by Product Type, 2018 to 2033 Figure 49: Latin America Market Value Share (%) and BPS Analysis by Product Type, 2023 to 2033 Figure 50: Latin America Market Y-o-Y Growth (%) Projections by Product Type, 2023 to 2033 Figure 51: Latin America Market Value (US$ Million) Analysis by Route of Administration, 2018 to 2033 Figure 52: Latin America Market Value Share (%) and BPS Analysis by Route of Administration, 2023 to 2033 Figure 53: Latin America Market Y-o-Y Growth (%) Projections by Route of Administration, 2023 to 2033 Figure 54: Latin America Market Value (US$ Million) Analysis by Animal Type, 2018 to 2033 Figure 55: Latin America Market Value Share (%) and BPS Analysis by Animal Type, 2023 to 2033 Figure 56: Latin America Market Y-o-Y Growth (%) Projections by Animal Type, 2023 to 2033 Figure 57: Latin America Market Attractiveness by Product Type, 2023 to 2033 Figure 58: Latin America Market Attractiveness by Route of Administration, 2023 to 2033 Figure 59: Latin America Market Attractiveness by Animal Type, 2023 to 2033 Figure 60: Latin America Market Attractiveness by Country, 2023 to 2033 Figure 61: Western Europe Market Value (US$ Million) by Product Type, 2023 to 2033 Figure 62: Western Europe Market Value (US$ Million) by Route of Administration, 2023 to 2033 Figure 63: Western Europe Market Value (US$ Million) by Animal Type, 2023 to 2033 Figure 64: Western Europe Market Value (US$ Million) by Country, 2023 to 2033 Figure 65: Western Europe Market Value (US$ Million) Analysis by Country, 2018 to 2033 Figure 66: Western Europe Market Value Share (%) and BPS Analysis by Country, 2023 to 2033 Figure 67: Western Europe Market Y-o-Y Growth (%) Projections by Country, 2023 to 2033 Figure 68: Western Europe Market Value (US$ Million) Analysis by Product Type, 2018 to 2033 Figure 69: Western Europe Market Value Share (%) and BPS Analysis by Product Type, 2023 to 2033 Figure 70: Western Europe Market Y-o-Y Growth (%) Projections by Product Type, 2023 to 2033 Figure 71: Western Europe Market Value (US$ Million) Analysis by Route of Administration, 2018 to 2033 Figure 72: Western Europe Market Value Share (%) and BPS Analysis by Route of Administration, 2023 to 2033 Figure 73: Western Europe Market Y-o-Y Growth (%) Projections by Route of Administration, 2023 to 2033 Figure 74: Western Europe Market Value (US$ Million) Analysis by Animal Type, 2018 to 2033 Figure 75: Western Europe Market Value Share (%) and BPS Analysis by Animal Type, 2023 to 2033 Figure 76: Western Europe Market Y-o-Y Growth (%) Projections by Animal Type, 2023 to 2033 Figure 77: Western Europe Market Attractiveness by Product Type, 2023 to 2033 Figure 78: Western Europe Market Attractiveness by Route of Administration, 2023 to 2033 Figure 79: Western Europe Market Attractiveness by Animal Type, 2023 to 2033 Figure 80: Western Europe Market Attractiveness by Country, 2023 to 2033 Figure 81: Eastern Europe Market Value (US$ Million) by Product Type, 2023 to 2033 Figure 82: Eastern Europe Market Value (US$ Million) by Route of Administration, 2023 to 2033 Figure 83: Eastern Europe Market Value (US$ Million) by Animal Type, 2023 to 2033 Figure 84: Eastern Europe Market Value (US$ Million) by Country, 2023 to 2033 Figure 85: Eastern Europe Market Value (US$ Million) Analysis by Country, 2018 to 2033 Figure 86: Eastern Europe Market Value Share (%) and BPS Analysis by Country, 2023 to 2033 Figure 87: Eastern Europe Market Y-o-Y Growth (%) Projections by Country, 2023 to 2033 Figure 88: Eastern Europe Market Value (US$ Million) Analysis by Product Type, 2018 to 2033 Figure 89: Eastern Europe Market Value Share (%) and BPS Analysis by Product Type, 2023 to 2033 Figure 90: Eastern Europe Market Y-o-Y Growth (%) Projections by Product Type, 2023 to 2033 Figure 91: Eastern Europe Market Value (US$ Million) Analysis by Route of Administration, 2018 to 2033 Figure 92: Eastern Europe Market Value Share (%) and BPS Analysis by Route of Administration, 2023 to 2033 Figure 93: Eastern Europe Market Y-o-Y Growth (%) Projections by Route of Administration, 2023 to 2033 Figure 94: Eastern Europe Market Value (US$ Million) Analysis by Animal Type, 2018 to 2033 Figure 95: Eastern Europe Market Value Share (%) and BPS Analysis by Animal Type, 2023 to 2033 Figure 96: Eastern Europe Market Y-o-Y Growth (%) Projections by Animal Type, 2023 to 2033 Figure 97: Eastern Europe Market Attractiveness by Product Type, 2023 to 2033 Figure 98: Eastern Europe Market Attractiveness by Route of Administration, 2023 to 2033 Figure 99: Eastern Europe Market Attractiveness by Animal Type, 2023 to 2033 Figure 100: Eastern Europe Market Attractiveness by Country, 2023 to 2033 Figure 101: South Asia and Pacific Market Value (US$ Million) by Product Type, 2023 to 2033 Figure 102: South Asia and Pacific Market Value (US$ Million) by Route of Administration, 2023 to 2033 Figure 103: South Asia and Pacific Market Value (US$ Million) by Animal Type, 2023 to 2033 Figure 104: South Asia and Pacific Market Value (US$ Million) by Country, 2023 to 2033 Figure 105: South Asia and Pacific Market Value (US$ Million) Analysis by Country, 2018 to 2033 Figure 106: South Asia and Pacific Market Value Share (%) and BPS Analysis by Country, 2023 to 2033 Figure 107: South Asia and Pacific Market Y-o-Y Growth (%) Projections by Country, 2023 to 2033 Figure 108: South Asia and Pacific Market Value (US$ Million) Analysis by Product Type, 2018 to 2033 Figure 109: South Asia and Pacific Market Value Share (%) and BPS Analysis by Product Type, 2023 to 2033 Figure 110: South Asia and Pacific Market Y-o-Y Growth (%) Projections by Product Type, 2023 to 2033 Figure 111: South Asia and Pacific Market Value (US$ Million) Analysis by Route of Administration, 2018 to 2033 Figure 112: South Asia and Pacific Market Value Share (%) and BPS Analysis by Route of Administration, 2023 to 2033 Figure 113: South Asia and Pacific Market Y-o-Y Growth (%) Projections by Route of Administration, 2023 to 2033 Figure 114: South Asia and Pacific Market Value (US$ Million) Analysis by Animal Type, 2018 to 2033 Figure 115: South Asia and Pacific Market Value Share (%) and BPS Analysis by Animal Type, 2023 to 2033 Figure 116: South Asia and Pacific Market Y-o-Y Growth (%) Projections by Animal Type, 2023 to 2033 Figure 117: South Asia and Pacific Market Attractiveness by Product Type, 2023 to 2033 Figure 118: South Asia and Pacific Market Attractiveness by Route of Administration, 2023 to 2033 Figure 119: South Asia and Pacific Market Attractiveness by Animal Type, 2023 to 2033 Figure 120: South Asia and Pacific Market Attractiveness by Country, 2023 to 2033 Figure 121: East Asia Market Value (US$ Million) by Product Type, 2023 to 2033 Figure 122: East Asia Market Value (US$ Million) by Route of Administration, 2023 to 2033 Figure 123: East Asia Market Value (US$ Million) by Animal Type, 2023 to 2033 Figure 124: East Asia Market Value (US$ Million) by Country, 2023 to 2033 Figure 125: East Asia Market Value (US$ Million) Analysis by Country, 2018 to 2033 Figure 126: East Asia Market Value Share (%) and BPS Analysis by Country, 2023 to 2033 Figure 127: East Asia Market Y-o-Y Growth (%) Projections by Country, 2023 to 2033 Figure 128: East Asia Market Value (US$ Million) Analysis by Product Type, 2018 to 2033 Figure 129: East Asia Market Value Share (%) and BPS Analysis by Product Type, 2023 to 2033 Figure 130: East Asia Market Y-o-Y Growth (%) Projections by Product Type, 2023 to 2033 Figure 131: East Asia Market Value (US$ Million) Analysis by Route of Administration, 2018 to 2033 Figure 132: East Asia Market Value Share (%) and BPS Analysis by Route of Administration, 2023 to 2033 Figure 133: East Asia Market Y-o-Y Growth (%) Projections by Route of Administration, 2023 to 2033 Figure 134: East Asia Market Value (US$ Million) Analysis by Animal Type, 2018 to 2033 Figure 135: East Asia Market Value Share (%) and BPS Analysis by Animal Type, 2023 to 2033 Figure 136: East Asia Market Y-o-Y Growth (%) Projections by Animal Type, 2023 to 2033 Figure 137: East Asia Market Attractiveness by Product Type, 2023 to 2033 Figure 138: East Asia Market Attractiveness by Route of Administration, 2023 to 2033 Figure 139: East Asia Market Attractiveness by Animal Type, 2023 to 2033 Figure 140: East Asia Market Attractiveness by Country, 2023 to 2033 Figure 141: Middle East and Africa Market Value (US$ Million) by Product Type, 2023 to 2033 Figure 142: Middle East and Africa Market Value (US$ Million) by Route of Administration, 2023 to 2033 Figure 143: Middle East and Africa Market Value (US$ Million) by Animal Type, 2023 to 2033 Figure 144: Middle East and Africa Market Value (US$ Million) by Country, 2023 to 2033 Figure 145: Middle East and Africa Market Value (US$ Million) Analysis by Country, 2018 to 2033 Figure 146: Middle East and Africa Market Value Share (%) and BPS Analysis by Country, 2023 to 2033 Figure 147: Middle East and Africa Market Y-o-Y Growth (%) Projections by Country, 2023 to 2033 Figure 148: Middle East and Africa Market Value (US$ Million) Analysis by Product Type, 2018 to 2033 Figure 149: Middle East and Africa Market Value Share (%) and BPS Analysis by Product Type, 2023 to 2033 Figure 150: Middle East and Africa Market Y-o-Y Growth (%) Projections by Product Type, 2023 to 2033 Figure 151: Middle East and Africa Market Value (US$ Million) Analysis by Route of Administration, 2018 to 2033 Figure 152: Middle East and Africa Market Value Share (%) and BPS Analysis by Route of Administration, 2023 to 2033 Figure 153: Middle East and Africa Market Y-o-Y Growth (%) Projections by Route of Administration, 2023 to 2033 Figure 154: Middle East and Africa Market Value (US$ Million) Analysis by Animal Type, 2018 to 2033 Figure 155: Middle East and Africa Market Value Share (%) and BPS Analysis by Animal Type, 2023 to 2033 Figure 156: Middle East and Africa Market Y-o-Y Growth (%) Projections by Animal Type, 2023 to 2033 Figure 157: Middle East and Africa Market Attractiveness by Product Type, 2023 to 2033 Figure 158: Middle East and Africa Market Attractiveness by Route of Administration, 2023 to 2033 Figure 159: Middle East and Africa Market Attractiveness by Animal Type, 2023 to 2033 Figure 160: Middle East and Africa Market Attractiveness by Country, 2023 to 2033
Recommendations
Explore Healthcare Insights
View Reports