Veterinary Emetic Agents Market Size and Share Forecast Outlook 2025 to 2035

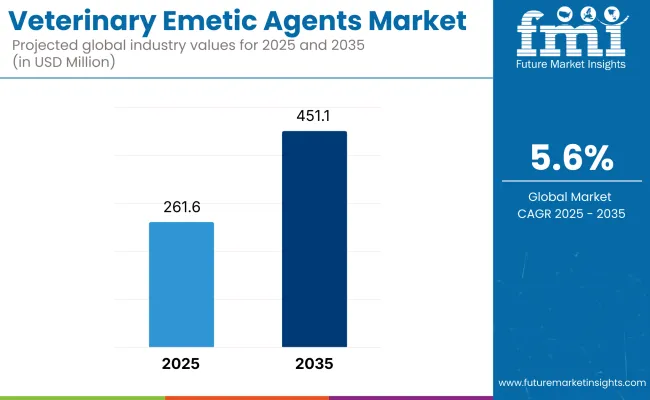
The veterinary emetic agents market is expected to record a valuation of USD 261.6 million in 2025 and USD 451.1 million in 2035, with reflecting a growth of USD 189.5 million across the ten-year span. The overall expansion represents a CAGR of 5.6%, representing a 1.72X increase over the ten-year period.
Quick Stats for Veterinary Emetic Agents Market

  • Veterinary Emetic Agents Market Value (2025): USD 261.6 million
  • Veterinary Emetic Agents Market Forecast Value (2035): USD 451.1 million
  • Veterinary Emetic Agents Market Forecast CAGR (2025 to 2035): 5.6%
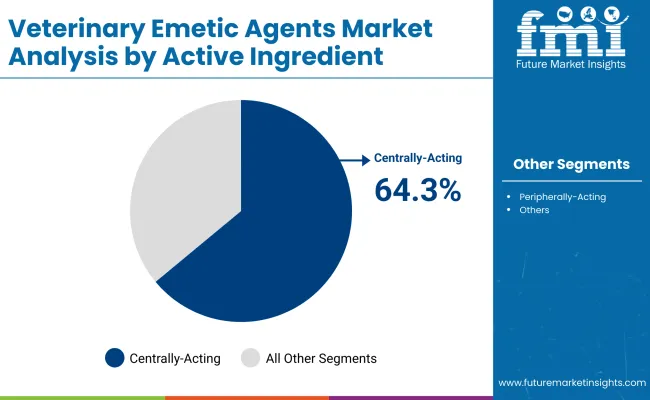
  • Leading Segment in 2025 (Active Ingredient Class): Centrally-Acting Emetic Agents(64.3%)
  • Key Growth Regions: North America, East Asia, and Europe
  • Top Key Players: Zoetis Inc., Boehringer Ingelheim, Elanco Animal Health, Ceva Santé Animale, Virbac, Vetoquinol, Dechra Pharmaceuticals, Wockhardt Ltd., Heska Corporation, Bayer Animal Health, Sumitomo Pharma Animal Health, Inovet Inc., and Others

Veterinary Emetic Agents Market

Metric Value
Industry Size (2025E) USD 261.6 million
Industry Value (2035F) USD 451.1 million
CAGR (2025 to 2035) 5.6%

During the first five-year period from 2025 to 2030, the total market value is projected to expand from USD 261.6 million to USD 343.5 million, adding USD 81.9 million which contributes to 43.2% of the total decade growth. The Centrally Acting Emetic Agents segment will remain dominant, holding around 64.3% share of the category by 2025 due to their higher efficacy, regulatory approvals, and strong preference among veterinary practitioners for use in companion animals such as dogs and cats.

The second half from 2030 to 2035 contributes USD 107.5 million which is equal to 56.8% of the total growth as the market jumps from USD 343.5 million to USD 451.1 million. This momentum is powered by innovation in drug formulations, expanding e-commerce distribution channels, and evolving regulatory frameworks. Centrally Acting Emetic Agents are expected to maintain or slightly increase their share, while alternative delivery formats and supportive care agents remain niche. The Centrally Acting Emetic Agents to hold 65.6% by the end of the decade. Overall, the market is poised for steady expansion driven by evolving pet care trends and veterinary pharmaceutical advancements.

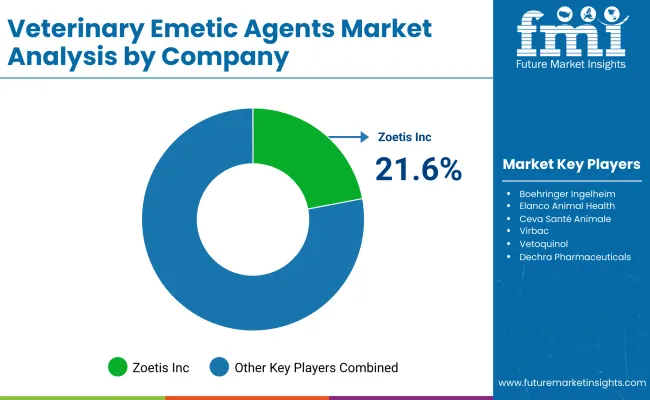
The global veterinary emetic agents market experienced steady expansion between 2020 and 2024, growing from USD 194.7 million to USD 249.0 million, driven primarily by increased demand for companion animal healthcare and rising awareness of safe emesis induction practices. Top three manufacturers, including major players such as Zoetis Inc., Elanco Animal Health, and Boehringer Ingelheim, contribute approximately 44.5% of the overall market share. Their dominance stems from strong product portfolios, geographic reach, and strategic investments in R&D and regulatory compliance.

Demand for veterinary emetic agents is expected to reach USD 261.6 million in 2025, with the market composition evolving as ophthalmic formulations and targeted delivery systems gain traction. Centrally Acting Emetic Agents will continue to dominate, but innovation is shifting toward safer, faster-acting compounds tailored for companion animals. Traditional pharmaceutical leaders face growing competition from niche biotech firms focused on precision veterinary therapeutics and patient-friendly administration formats. Key players are adapting by investing in formulation R&D, expanding e-commerce distribution, and integrating digital tools for dosage tracking and remote consultation.

Why Veterinary Emetic Agents Market is Growing?

A key driver is the increasing rate of pet ownership worldwide, especially in North America and Europe, is creating heightened demand for veterinary treatments that safely induce emesis, critical in poisoning and overdose cases. The humanization of pets has accelerated owners' willingness to spend on advanced therapies, fueling market expansion.

For instance, globally, pet ownership continues a strong upward trend, with approximately 900 million pet dogs and 370 million pet cats in 2025. In the USA alone, 94 million households own pets (about 71% of households), with dog ownership at 68 million and cats at 49 million. This expanding pet population fuels demand for veterinary healthcare products, including emetic agents essential in poisoning emergencies.

In parallel, advancements in centrally-acting emetic agents, such as FDA-approved ophthalmic formulations like ropinirole, have improved safety and efficacy profiles, prompting clinicians to prefer these alternatives over older, less predictable peripherally acting agents. For example, the introduction and regulatory approvals of more effective and safer emetic agents, like FDA-approved ropinirole eye drops for dogs, enhance clinical adoption. These advancements reduce side effects and improve dosage accuracy, encouraging veterinarians to prescribe emetics more confidently.

Segmental Analysis

The market for veterinary emetic agents is classified based on Active Ingredient Class, Route of Administration, Target Animal and Distribution Channel. The market is segmented by Active Ingredient Class, Route of Administration, Target Animal, and Distribution Channel. Active Ingredient Class includes Centrally Acting Emetic Agents such as apomorphine and ropinirole, which are preferred for their high efficacy and safer clinical profile.

Route of Administration is categorized into oral, intravenous, subcutaneous, intramuscular, and other methods. Target Animal segmentation includes dogs, cats and Others. Distribution Channel is segmented into Veterinary Clinics & Hospitals, Retail Pharmacies & Veterinary Stores and E-commerce. Regionally, the scope spans North America, Latin America, Western and Eastern Europe, East Asia, South Asia and Pacific, and the Middle East and Africa.
Insights on Centrally-Acting Emetic Agents to dominate the Active Ingredient Class

Veterinary Emetic Agents Market By Active Ingredient

By Active Ingredient Class Market Value Share, 2025
Centrally-Acting Emetic Agents 64.3%
Peripherally-Acting Emetic Agents 26.7%
Others 9.0%

In 2025, the Centrally-Acting Emetic Agents segment leads the global veterinary emetic agents market with 64.3% revenue share. Their dominance stems from their superior efficacy and targeted mechanism of action, which involves stimulating the chemoreceptor trigger zone in the brain to reliably induce vomiting. This central action provides a faster onset compared to peripheral agents, reducing the risk of incomplete emesis or repeated dosing.

Centrally-acting agents such as apomorphine and ropinirole offer greater precision in dosage control and fewer adverse effects, making them highly preferred by veterinarians treating poisoning and overdose cases in companion animals, especially dogs. Leading manufacturers have invested significantly in refining these agents’ formulations to enhance safety profiles and ease of administration particularly ophthalmic delivery methods that improve compliance and rapid effect. As veterinary care expands into emerging markets and outpatient settings, the clinical trust and reproducibility of centrally-acting agents continue to drive their market leadership, supported by positive outcomes in diverse animal species and evolving regulatory approvals.
Insights on Route of Administration Segment with Oral Administration Leading in Market Share

Veterinary Emetic Agents Market By Route Of Administration

By Route of Administration Market Value Share, 2025
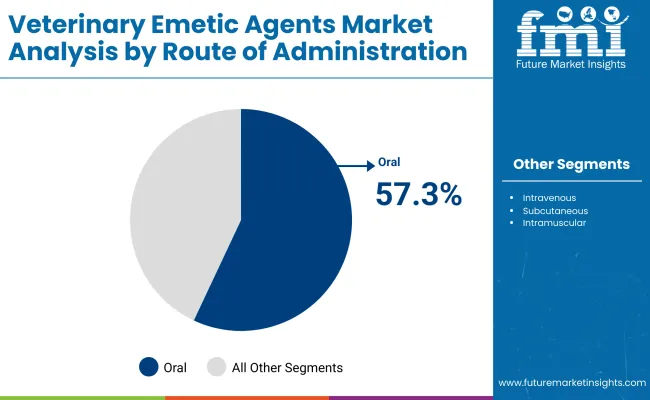
Oral 57.3%
Intravenous 9.3%
Subcutaneous 4.7%
Intramuscular 22.9%
Others 5.8%

In 2025, the Oral route of administration dominates the global veterinary emetic agents market with 57.3% revenue share, driving significant demand across companion animal healthcare. This prominence is attributed to the ease of administration, non-invasiveness, and rapid onset of action that oral emetics provide, making them highly practical for both veterinary clinics and at-home use by pet owners. For example, orally administered apomorphine tablets or syrups are commonly used to induce vomiting in dogs owing to their proven safety profile and effective absorption.

The oral route also facilitates prompt treatment during emergencies without the need for specialized equipment or invasive procedures, expanding accessibility in diverse clinical settings. Additionally, the convenience of oral administration supports compliance and repeat dosing when needed. Veterinary guidelines often recommend oral emetics as a first-line intervention for toxin ingestion or overdose in small animals, reinforcing this route’s dominant market position.

Insights on Target Animal Segment with Dogs Segment Dominating the Demand

By Target Animal Market Value Share, 2025
Dogs 73.2%
Cats 22.6%
Others 4.2%

In 2025, dogs hold the major revenue share of 73.2% in the target animal segment of the global veterinary emetic agents market. This dominance is driven by the high adoption of dogs as pets or companion animals across every country. This has led to frequent need for induced emesis to manage poisoning or accidental ingestion cases in canines. Moreover, veterinary protocols widely recommend emesis induction as a frontline treatment in dogs, further establishing their predominance in this segment.

Leading veterinary pharmaceutical companies tailor formulations and dosages primarily for dogs, reflecting their market importance. Instances such as the routine use of apomorphine or ropinirole in dogs for treating toxic exposures exemplify this trend. Compared to cats or other smaller animals, a significant percentage of dog population requires emergency care which reinforces their position as the primary target species, driving both clinical and market demand.

Insights on Distribution Channel Segment with focus on Veterinary Clinics and Hospitals

By Distribution Channel Market Value Share, 2025
Veterinary Clinics and Hospitals 73.2%
Retail Pharmacies/Veterinary Stores 22.6%
E-commerce Sales 4.2%

In 2025, Veterinary Clinics and Hospitals dominate the distribution channel segment of the global veterinary emetic agents market with a revenue share of 73.2% in 2025. This leadership is anchored in their comprehensive infrastructure, skilled veterinary professionals, and the capability to provide immediate, supervised administration of emetic agents during critical poisoning or overdose cases. Clinics and hospitals serve as the primary access points for pet owners seeking urgent care, ensuring rapid diagnosis and treatment with reliable, prescription-grade emetics.

Top pharmaceutical manufacturers prioritize this channel for product launches, clinical training, and post-market surveillance reinforcing their pivotal role in the supply chain. For instance, apomorphine and ropinirole are commonly stocked and administered in veterinary hospitals for controlled, effective emesis induction under medical supervision.

Furthermore, reimbursement frameworks and insurance coverage often support treatments within these institutional settings, increasing client preference. The growing number of specialty veterinary hospitals and emergency animal care centers globally, particularly in urban and developed regions, strengthens this channel’s market dominance as the most trusted and accessible point of care for veterinary emetic agents.

What are Key Drivers, Restraints, and Trends Shaping Veterinary Emetic Agents Market Growth?

Growth is restrained by safety concerns and side effects associated with common emetics such as apomorphine, ropinirole, and hydrogen peroxide, which limit universal application and require careful case selection. A key trend is the increasing adoption of e-commerce distribution channels, with major veterinary pharmaceutical companies and online platforms improving accessibility, convenience, and speed of supply for both pet owners and veterinary professionals.

Rising Pet Ownership and Pet Humanization Driving Demand

Rising pet ownership and pet humanization are key drivers of growth in the veterinary emetic agents market. As more households embrace pets as family members, demand for high-quality veterinary care including emergency treatments has surged. Pet parents are increasingly aware of the risks of toxic ingestion and seek rapid interventions, boosting the use of emetic agents. In emerging economies, rising disposable incomes and urbanization further drives pet adoption and healthcare spending.

This trend toward premium pet services, coupled with expanding access to veterinary clinics and reimbursement, ensures that emetic agents remain essential in safeguarding pet health and enhancing treatment outcomes. For instance, according to data published by American Pet Products Association, Overall, pet ownership has increased for both dogs and cats, with 51% of USA households (68 million) owning a dog and 37% of USA households (49 million) owning a cat.

Safety Concerns and Side Effects

Safety concerns and side effects significantly hamper the growth of the global veterinary emetic agents market. According to peer-reviewed veterinary studies and scientific literature, commonly used emetic agents such as apomorphine and ropinirole while effective in maximum cases. However, these drugs are associated with adverse effects in limited pet population which hinder their adoption in certain circumstances. For example, apomorphine can cause sedation, excessive salivation, respiratory depression, and gastrointestinal discomfort in dogs.

Ropinirole ophthalmic drops, recently approved by the FDA, have a side effect profile including conjunctival hyperemia, ocular irritation, protracted vomiting episodes, and sedation, which are mostly self-limiting but require careful use especially in animals with preexisting conditions. Moreover, certain emetics like hydrogen peroxide, though used peripherally, pose risks of gastrointestinal irritation, gastric dilatation-volvulus (bloat) in dogs, and potentially aggravate injuries if not properly indicated. Veterinary guidelines caution against emesis induction if the ingested substance is corrosive or could cause harm upon regurgitation, further restricting universal use.

Rising Shift Toward E-commerce Distribution

The shift towards e-commerce distribution is a prominent market trend driving growth in the global veterinary emetic agents market. Veterinary pharmaceuticals, including emetic agents, are increasingly being accessed through online platforms, enhancing availability and convenience for pet owners and veterinary professionals alike. Veterinary distribution, encompassing clinics, hospitals, retail pharmacies, and e-commerce, plays a critical role in ensuring access to essential medicines for companion animals and livestock.

Key industry leaders such as Zoetis, Merck Animal Health, and Boehringer Ingelheim actively leverage e-commerce channels to expand their reach, providing pet owners with easier, faster access to veterinary emetic agents without depending solely on traditional brick-and-mortar outlets. The rise of online veterinary pharmacies and e-tailers like Chewy, Amazon, and Petco enables purchasing from home, often coupled with veterinary consultation services, meeting the growing demand for quick and safe toxin management solutions.
Analysis of Global Veterinary Emetic Agents Market, by Key Countries

Country Wise Analysis Of Veterinary Emetic Agents Market

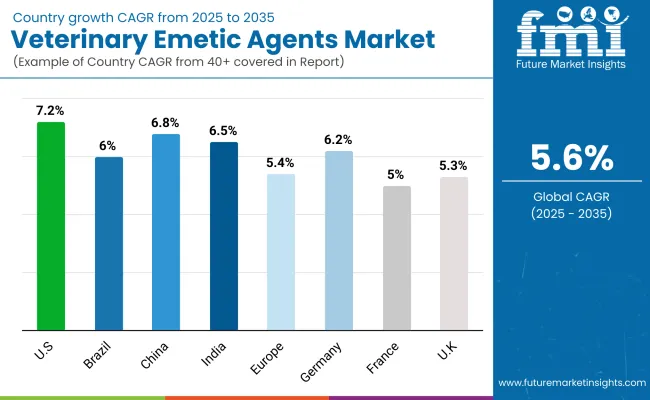
Country CAGR (%)
USA 7.2%
Brazil 6.0%
China 6.8%
India 6.5%
Europe 5.4%
Germany 6.2%
France 5.0%
UK 5.3%

Asia-Pacific is emerging as the fastest-growing region in the global veterinary emetic agents market, driven by rapid expansion of veterinary healthcare infrastructure, rising pet ownership, and increasing awareness about pet health management. Countries like India and China are leading this growth with estimated CAGRs of approximately 6.5% and 6.8%, respectively.

This growth is supported by government initiatives to improve animal health, increased veterinary spending, and the expansion of veterinary clinics and specialty hospitals. Additionally, domestic manufacturers in these markets are improving the availability and affordability of veterinary emetic agents, facilitating wider adoption in rural and previously underserved areas.

Europe demonstrates moderate growth, with a CAGR around 5.4%, supported by strong veterinary care frameworks in countries such as Germany, France, and the United Kingdom France benefits from extensive pet insurance coverage and proactive veterinary protocols, while the United Kingdom is expanding specialty veterinary clinics and emergency care centers. Germany’s growth is comparatively slower due to market maturity and conservative prescription practices for emetic agents. Stable demand persists, driven by high pet ownership rates and growing aging pet populations needing more frequent veterinary interventions.

North America remains a mature yet crucial market, with the United States growing at about 7.2% CAGR. Growth drivers include widespread pet humanization, increasing veterinary expenditures, and strong veterinary infrastructure supported by insurance reimbursements for advanced therapies. Leading manufacturers such as Zoetis and Elanco are investing in research and partnerships with veterinary hospitals, accelerating product adoption. The availability of telemedicine and e-commerce channels also enhances access and convenience for pet owners, maintaining steady market expansion rooted in advanced veterinary care standards and high pet health awareness.

Sales Outlook of Veterinary Emetic Agents Market in United States

Year USA Veterinary Emetic Agents Market (USD Million)
2025 85.0
2026 90.9
2027 97.2
2028 104.1
2029 111.5
2030 119.5
2031 128.0
2032 137.2
2033 147.4
2034 158.5
2035 170.4

The veterinary emetic agents market in the United States is projected to grow at a CAGR of approximately 7.2% from 2025 to 2035. Despite its maturity, the market exhibits steady expansion driven by increasing pet ownership, heightened awareness of pet toxicology emergencies, and rising veterinary healthcare expenditure. Growth is further supported by the expanding use of advanced and safer centrally-acting emetic agents like FDA-approved ropinirole, which enhance treatment outcomes in poisoning cases.

Veterinary clinics and hospitals remain the dominant end users due to their equipped facilities and trained staff capable of administering emetic treatments efficiently. Additionally, independent veterinary emergency and specialty clinics are witnessing increased adoption owing to faster patient handling and growing demand for urgent care services.

  • Increased recognition and early intervention in pet poisoning and overdose incidents, especially in dogs, which represent the largest pet demographic.
  • Development and FDA approvals of safer emetic drug formulations with fewer side effects increasing veterinary practitioners’ confidence.
  • Expansion of telemedicine and ambulatory care models allowing prompt veterinary guidance and remote management of emesis cases.

This evolving healthcare ecosystem, supported by pet humanization and better clinical protocols, sustains consistent market growth in the United States during this period.

Growth and Expansion Outlook of Veterinary Emetic Agents Market in United Kingdom

The United Kingdom's Veterinary Emetic Agents Market is projected to grow at a CAGR of approximately 5.3% from 2025 to 2035. Market expansion is supported by increasing pet ownership, growing awareness of pet emergency care, and improved veterinary healthcare infrastructure backed by public and private funding. The UK’s National Health Service (NHS) model has parallels in rising public support for animal welfare, with increased referrals to specialized veterinary hospitals equipped for advanced emergency treatments, including emetic agent administration.

Hospitals and veterinary clinics continue to dominate as primary end users, benefiting from modernized facilities and integrated care pathways that improve treatment outcomes. Emerging independent emergency veterinary centers are gaining traction by offering efficient, rapid care for poisoning and toxin ingestion cases, reducing pressure on traditional hospital settings.

  • Increasing government-backed awareness campaigns promoting prompt veterinary intervention for toxic exposures in domestic pets.
  • Enhanced training programs for veterinary professionals focused on safe and effective emesis induction techniques.
  • A growing emphasis on minimally invasive and outpatient care models, enabling quicker treatment access and better pet welfare.

Growth and Expansion Outlook of Veterinary Emetic Agents in Germany

Germany’s veterinary emetic agents market is projected to grow at a CAGR of 6.2% between 2025 and 2035, supported by its advanced veterinary healthcare infrastructure and strong pet ownership culture. Over 34% of households own dogs or cats, driving consistent demand for emergency treatments like emetic agents. University-affiliated and specialty animal hospitals lead adoption of safe emesis protocols in poisoning cases. Regulatory bodies like BMEL and PEI ensure high standards but also slow market entry for new formulations.

  • Veterinary hospitals use advanced diagnostics to guide emetic administration.
  • University clinics adopt newer emesis protocols for poisoning cases.
  • Retail veterinary pharmacies distribute emetics under strict prescription norms
Europe Veterinary Emetic Agents Market Analysis Country 2025
Germany 28.2%
UK 17.0%
France 15.2%
Italy 11.4%
Spain 8.6%
BENELUX 7.0%
Nordic Countries 6.0%
Rest of Western Europe 6.6%
Europe Veterinary Emetic Agents Market Analysis Country 2035
Germany 29.4%
UK 17.8%
France 14.2%
Italy 10.1%
Spain 7.4%
BENELUX 7.6%
Nordic Countries 6.8%
Rest of Western Europe 6.7%

Growth and Expansion Outlook of Veterinary Emetic Agents Market in India

India’s Veterinary Emetic Agents Market is expected to grow at a robust CAGR of approximately 6.5% between 2025 and 2035, positioning it among the fastest-growing veterinary pharmaceutical markets globally. This growth is driven by rising pet ownership across urban and semi-urban areas, increasing awareness of pet health and emergency care, and expanding veterinary healthcare infrastructure, particularly in metropolitan regions. Government initiatives aimed at improving animal health and welfare are fueling investments in veterinary clinics and hospitals equipped to handle toxin management cases requiring emetic agents.

Veterinary Clinics and Hospitals remain the dominant end users due to their advanced facilities and experienced staff capable of administering emetics safely. Meanwhile, private multispecialty veterinary centers in Tier-1 cities are witnessing growing adoption by pet owners seeking premium and minimally invasive care, reflecting rising pet humanization and consumer preference for quality veterinary services.

  • Increasing incidence of accidental poisoning cases in companion animals, heightening demand for prompt emetic treatments.
  • Expanded veterinary training programs emphasizing toxicology and emergency management.
  • Entry of domestic veterinary pharmaceutical manufacturers offering cost-effective emetic formulations, enhancing accessibility across diverse market segments.

Growth and Expansion Outlook of Veterinary Emetic Agents in China

China’s veterinary emetic agents market is projected to grow at a robust CAGR of 6.8% between 2025 and 2035, driven by its vast companion animal population and expanding veterinary infrastructure. With over 124 million pets, including 71.5 million cats and 52.6 million dogs, demand for emergency treatments like emetic agents is surging.

Regulatory bodies like MARA and IVDC are enhancing drug safety standards, while companies like New Ruipeng Pet Healthcare Group operate 1,400 hospitals across 80 cities, boosting access. The increasing urban pet population, rising awareness of pet health, and expanding veterinary hospital networks contribute to increasing demand for emergency veterinary drugs essential for poison management, such as emetic agents.

  • Urban clinics are expanding emetic use for poisoning emergencies.
  • Domestic pharma firms scale emetic production in tier-2 and tier-3 cities.
  • Government-backed frameworks improve veterinary drug safety and adoption.
Active Ingredient Class 2025 Share (%)
Centrally-Acting Emetic Agents 65.5%
Peripherally-Acting Emetic Agents 27.2%
Others 7.3%

Growth Outlook of Veterinary Emetic Agents Market in Japan

Japan’s Veterinary Emetic Agents Market is forecast to grow at a CAGR of 4.3% from 2025 to 2030, driven by an aging pet population and heightened awareness about pet healthcare. The market is dominated by centrally-acting emetic agents, which hold a 65.5% share in 2025, followed by peripherally-acting agents at 27.2%, with other agents comprising 7.3%.

The country's robust veterinary infrastructure, bolstered by policies from the Ministry of Agriculture, Forestry and Fisheries (MAFF), facilitates access to essential veterinary medicines. Veterinary hospitals and clinics are the primary end users, benefiting from advanced diagnostic and treatment capabilities. Regional veterinary clinics are also seeing increased adoption due to government decentralization efforts aimed at improving access to veterinary services.

  • Market in Japan holds share of 5.5% in 2025 in the global market
  • Centrally-acting agents lead with 65.5% share over other segment
  • Growth driven by aging pets and decentralized care policies

This supportive regulatory environment, combined with a well-developed veterinary care system and evolving pet owner attitudes, underpins sustained growth of the veterinary emetic agents market in Japan through 2035.

Growth Outlook of Veterinary Emetic Agents Market in South Korea

Target Animal 2025 Share (%)
Dogs 73.4%
Cats 20.3%
Others 6.3%

South Korea’s Veterinary Emetic Agents Market is projected to grow at a CAGR of 3.7% from 2025 to 2035. This growth is driven by increasing pet ownership, heightened awareness of animal health emergencies, and the expansion of veterinary healthcare infrastructure supported by government initiatives.

The Ministry of Agriculture, Food and Rural Affairs (MAFRA) plays a vital role in promoting veterinary public health programs and enhancing access to critical treatments, including emetic agents. The market is primarily driven by dogs, which account for 73.4% of the share in 2025, followed by cats at 20.3%.

Tertiary veterinary hospitals in major cities like Seoul are the primary end users, offering advanced diagnostic and treatment services. Regional veterinary clinics and emergency care centers are also witnessing growth, supported by improved training and government-backed service initiatives.
  • Market size for South Korea in 2025 is USD 5.8 million
  • Global market share is approximately 2.2%
  • Dogs lead the segment with 73.4% due to high pet ownership

Competitive Landscape

Veterinary Emetic Agents Market By Company

Key Players Global Value Share (%) 2025
Zoetis Inc. 21.6%
Other Players 78.4%

The global veterinary emetic agents market is moderately consolidated, comprising leading multinational pharmaceutical companies, specialized veterinary drug manufacturers, and regional suppliers servicing diverse veterinary care settings. Zoetis Inc. holds the leading market share at 21.6%, propelled by its robust portfolio of veterinary pharmaceuticals, including widely used emetic agents such as apomorphine. Zoetis’ competitive advantage is rooted in its extensive research and development capabilities, stringent quality control measures, and a vast global distribution network that ensures broad accessibility across companion animal healthcare providers.

Mid-sized players like Elanco Animal Health, Merck Animal Health, and Virbac are recognized for their innovation in veterinary formulations, novel drug delivery systems, and adaptive production facilities. These companies often collaborate with Zoetis and veterinary clinics as Tier 2/3 suppliers, offering complementary emetic agents and supporting products, while also focusing on regional market adaptations and compliance with localized regulations.

Specialty providers, such as Vetoquinol and Dechra Pharmaceuticals, focus on niche markets within veterinary care, including customized dosage forms, species-specific formulations, and localized contract manufacturing. These firms facilitate rapid product development cycles, regional regulatory approvals, and cater to emerging veterinary needs such as telehealth and home care applications.

As the market evolves, competitive differentiation is increasingly based on product innovation, safety profile enhancements, and integration with broader animal health management solutions. Leading companies are investing in continuous pharmacovigilance, digital veterinary health platforms, and sustainable manufacturing practices to address growing demands from pet owners for safer, effective, and environmentally responsible emetic treatments. Zoetis’ leadership is reinforced by its commitment to innovation, comprehensive clinical support, and global reach, vital for sustaining growth in an evolving veterinary pharmaceutical landscape.

Key Developments

  • In 2024, The FDA approved a 3-year shelf life for ropinirole ophthalmic solution (Clevor; Vetoquinol), extending its expiration by 12 months. As the only FDA-approved emetic for dogs, its injection-free ocular delivery simplifies vomiting induction, making treatment less stressful for pets and veterinary teams.
  • In 2024, Animalcare has launched Clevor in the United Kingdom, a fast-acting emetic eye drop containing ropinirole, a selective dopamine D2 agonist that targets emesis-triggering receptors. Licensed for repeat dosing, each vial treats up to three 20kg dogs. The product offers vets a timely solution for pet poisoning cases.

Scope of Report

Item Value
Quantitative Units USD 261.6 million
Active Ingredient Class Centrally-Acting Emetic Agents, Peripherally-Acting Emetic Agents and Others
Route of Administration Oral, Intravenous, Subcutaneous, Intramuscular and Others
Target Animal Cat, Dogs and Others
Distribution Channel Veterinary Clinics and Hospitals, Retail Pharmacies/Veterinary Stores and E-commerce sales
Regions Covered North America, Latin America, Western & Eastern Europe, East Asia, South Asia & Pacific, Middle East & Africa
Countries Covered USA, Brazil, China, India, Germany, France, UK etc.
Key Companies Profiled Zoetis Inc., Boehringer Ingelheim, Elanco Animal Health, Ceva Santé Animale, Virbac, Vetoquinol, Dechra Pharmaceuticals, Wockhardt Ltd., Heska Corporation, Bayer Animal Health, Sumitomo Pharma Animal Health, Inovet Inc.
Additional Attributes Dollar sales by active ingredient class and regions, adoption trends across dogs segment, rising demand Oral administration, Growing demand across Veterinary Clinics and Hospitals

Key Segmentation

By Active Ingredient Class:

  • Centrally-Acting Emetic Agents
  • Peripherally-Acting Emetic Agents
  • Others (Combination Products)

By Route of Administration:

  • Oral
  • Intravenous
  • Subcutaneous
  • Intramuscular
  • Others (Ocular, Transmucosal, and among Others)

By Target Animal:

  • Dogs
  • Cats
  • Others (Rabbits, and among Others)

By Distribution Channel:

  • Veterinary Clinics & Hospitals
  • Retail Pharmacies/Veterinary Stores
  • E-commerce Websites

By Region:

  • North America
  • Latin America
  • Western Europe
  • Eastern Europe
  • East Asia
  • South Asia
  • MEA

Table of Content

  1. Executive Summary
    • Global Market Outlook
    • Demand-side Trends
    • Supply-side Trends
    • Technology Roadmap Analysis
    • Analysis and Recommendations
  2. Market Overview
    • Market Coverage / Taxonomy
    • Market Definition / Scope / Limitations
  3. Market Background
    • Market Dynamics
      • Drivers
      • Restraints
      • Opportunity
      • Trends
    • Scenario Forecast
      • Demand in Optimistic Scenario
      • Demand in Likely Scenario
      • Demand in Conservative Scenario
    • Opportunity Map Analysis
    • Product Life Cycle Analysis
    • Historical Roadmap of Drug Approvals
    • Investment Feasibility Matrix
    • Value Chain Analysis
      • Profit Margin Analysis
      • Wholesalers and Distributors
      • Retailers
    • PESTLE and Porter’s Analysis
    • Regulatory Landscape
      • By Key Regions
      • By Key Countries
    • Regional Parent Market Outlook
    • Animal Population Statistics, By major countries
  4. Global Market Analysis 2020 to 2024 and Forecast, 2025 to 2035
    • Historical Market Size Value (USD Million) & Volume (Units) Analysis, 2020 to 2024
    • Current and Future Market Size Value (USD Million) & Volume (Units) Projections, 2025 to 2035
      • Y-o-Y Growth Trend Analysis
      • Absolute $ Opportunity Analysis
  5. Global Market Analysis 2020 to 2024 and Forecast 2025 to 2035, By Active Ingredient Class
    • Introduction / Key Findings
    • Historical Market Size Value (USD Million) & Volume (Units) Analysis By Active Ingredient Class, 2020 to 2024
    • Current and Future Market Size Value (USD Million) & Volume (Units) Analysis and Forecast By Active Ingredient Class, 2025 to 2035
      • Centrally-Acting Emetic Agents
      • Peripherally-Acting Emetic Agents
      • Others (Combination Products)
    • Y-o-Y Growth Trend Analysis By Active Ingredient Class, 2020 to 2024
    • Absolute $ Opportunity Analysis By Active Ingredient Class, 2025 to 2035
  6. Global Market Analysis 2020 to 2024 and Forecast 2025 to 2035, By Route of Administration
    • Introduction / Key Findings
    • Historical Market Size Value (USD Million) & Volume (Units) Analysis By Route of Administration, 2020 to 2024
    • Current and Future Market Size Value (USD Million) & Volume (Units) Analysis and Forecast By Route of Administration, 2025 to 2035
      • Oral
      • Intravenous
      • Subcutaneous
      • Intramuscular
      • Others (Ocular, Transmucosal, and among Others)
    • Y-o-Y Growth Trend Analysis By Route of Administration, 2020 to 2024
    • Absolute $ Opportunity Analysis By Route of Administration, 2025 to 2035
  7. Global Market Analysis 2020 to 2024 and Forecast 2025 to 2035, By Target Animal
    • Introduction / Key Findings
    • Historical Market Size Value (USD Million) & Volume (Units) Analysis By Target Animal, 2020 to 2024
    • Current and Future Market Size Value (USD Million) & Volume (Units) Analysis and Forecast By Target Animal, 2025 to 2035
      • Dogs
      • Cats
      • Others (Rabbits, and among Others)
    • Y-o-Y Growth Trend Analysis By Target Animal, 2020 to 2024
    • Absolute $ Opportunity Analysis By Target Animal, 2025 to 2035
  8. Global Market Analysis 2020 to 2024 and Forecast 2025 to 2035, By Distribution Channel
    • Introduction / Key Findings
    • Historical Market Size Value (USD Million) & Volume (Units) Analysis By Distribution Channel, 2020 to 2024
    • Current and Future Market Size Value (USD Million) & Volume (Units) Analysis and Forecast By Distribution Channel, 2025 to 2035
      • Veterinary Clinics & Hospitals
      • Retail Pharmacies/Veterinary Stores
      • E-commerce Websites
    • Y-o-Y Growth Trend Analysis By Distribution Channel, 2020 to 2024
    • Absolute $ Opportunity Analysis By Distribution Channel, 2025 to 2035
  9. Global Market Analysis 2020 to 2024 and Forecast 2025 to 2035, By Region
    • Introduction
    • Historical Market Size Value (USD Million) & Volume (Units) Analysis By Region, 2020 to 2024
    • Current Market Size Value (USD Million) & Volume (Units) Analysis and Forecast By Region, 2025 to 2035
      • North America
      • Latin America
      • Western Europe
      • Eastern Europe
      • East Asia
      • South Asia
      • MEA
    • Market Attractiveness Analysis By Region
  10. North America Market Analysis 2020 to 2024 and Forecast 2025 to 2035, By Country
    • Historical Market Size Value (USD Million) & Volume (Units) Trend Analysis By Market Taxonomy, 2020 to 2024
    • Market Size Value (USD Million) & Volume (Units) Forecast By Market Taxonomy, 2025 to 2035
      • By Country
        • USA
        • Canada
        • Mexico
      • By Active Ingredient Class
      • By Route of Administration
      • By Target Animal
      • By Distribution Channel
    • Market Attractiveness Analysis
      • By Country
      • By Active Ingredient Class
      • By Route of Administration
      • By Target Animal
      • By Distribution Channel
    • Key Takeaways
  11. Latin America Market Analysis 2020 to 2024 and Forecast 2025 to 2035, By Country
    • Historical Market Size Value (USD Million) & Volume (Units) Trend Analysis By Market Taxonomy, 2020 to 2024
    • Market Size Value (USD Million) & Volume (Units) Forecast By Market Taxonomy, 2025 to 2035
      • By Country
        • Brazil
        • Argentina
        • Rest of Latin America
      • By Active Ingredient Class
      • By Route of Administration
      • By Target Animal
      • By Distribution Channel
    • Market Attractiveness Analysis
      • By Country
      • By Active Ingredient Class
      • By Route of Administration
      • By Target Animal
      • By Distribution Channel
    • Key Takeaways
  12. Western Europe Market Analysis 2020 to 2024 and Forecast 2025 to 2035, By Country
    • Historical Market Size Value (USD Million) & Volume (Units) Trend Analysis By Market Taxonomy, 2020 to 2024
    • Market Size Value (USD Million) & Volume (Units) Forecast By Market Taxonomy, 2025 to 2035
      • By Country
        • Germany
        • Italy
        • France
        • UK
        • Spain
        • BENELUX
        • Nordic Countries
        • Rest of Western Europe
      • By Active Ingredient Class
      • By Route of Administration
      • By Target Animal
      • By Distribution Channel
    • Market Attractiveness Analysis
      • By Country
      • By Active Ingredient Class
      • By Route of Administration
      • By Target Animal
      • By Distribution Channel
    • Key Takeaways
  13. Eastern Europe Market Analysis 2020 to 2024 and Forecast 2025 to 2035, By Country
    • Historical Market Size Value (USD Million) & Volume (Units) Trend Analysis By Market Taxonomy, 2020 to 2024
    • Market Size Value (USD Million) & Volume (Units) Forecast By Market Taxonomy, 2025 to 2035
      • By Country
        • Russia
        • Hungry
        • Poland
        • Rest of Eastern Europe
      • By Active Ingredient Class
      • By Route of Administration
      • By Target Animal
      • By Distribution Channel
    • Market Attractiveness Analysis
      • By Country
      • By Active Ingredient Class
      • By Route of Administration
      • By Target Animal
      • By Distribution Channel
    • Key Takeaways
  14. East Asia Market Analysis 2020 to 2024 and Forecast 2025 to 2035, By Country
    • Historical Market Size Value (USD Million) & Volume (Units) Trend Analysis By Market Taxonomy, 2020 to 2024
    • Market Size Value (USD Million) & Volume (Units) Forecast By Market Taxonomy, 2025 to 2035
      • By Country
        • China
        • Japan
        • South Korea
      • By Active Ingredient Class
      • By Route of Administration
      • By Target Animal
      • By Distribution Channel
    • Market Attractiveness Analysis
      • By Country
      • By Active Ingredient Class
      • By Route of Administration
      • By Target Animal
      • By Distribution Channel
    • Key Takeaways
  15. South Asia Market Analysis 2020 to 2024 and Forecast 2025 to 2035, By Country
    • Historical Market Size Value (USD Million) & Volume (Units) Trend Analysis By Market Taxonomy, 2020 to 2024
    • Market Size Value (USD Million) & Volume (Units) Forecast By Market Taxonomy, 2025 to 2035
      • By Country
        • India
        • ASEAN Countries
        • Australia & New Zealand
        • Rest of South Asia
      • By Active Ingredient Class
      • By Route of Administration
      • By Target Animal
      • By Distribution Channel
    • Market Attractiveness Analysis
      • By Country
      • By Active Ingredient Class
      • By Route of Administration
      • By Target Animal
      • By Distribution Channel
    • Key Takeaways
  16. MEA Market Analysis 2020 to 2024 and Forecast 2025 to 2035, By Country
    • Historical Market Size Value (USD Million) & Volume (Units) Trend Analysis By Market Taxonomy, 2020 to 2024
    • Market Size Value (USD Million) & Volume (Units) Forecast By Market Taxonomy, 2025 to 2035
      • By Country
        • Saudi Arabia
        • Türkiye
        • South Africa
        • Other African Union
        • Rest of MEA
      • By Active Ingredient Class
      • By Route of Administration
      • By Target Animal
      • By Distribution Channel
    • Market Attractiveness Analysis
      • By Country
      • By Active Ingredient Class
      • By Route of Administration
      • By Target Animal
      • By Distribution Channel
    • Key Takeaways
  17. Key Countries Market Analysis
    • USA
      • Pricing Analysis
      • Market Share Analysis, 2024
        • By Active Ingredient Class
        • By Route of Administration
        • By Target Animal
        • By Distribution Channel
    • Brazil
      • Pricing Analysis
      • Market Share Analysis, 2024
        • By Active Ingredient Class
        • By Route of Administration
        • By Target Animal
        • By Distribution Channel
    • China
      • Pricing Analysis
      • Market Share Analysis, 2024
        • By Active Ingredient Class
        • By Route of Administration
        • By Target Animal
        • By Distribution Channel
    • India
      • Pricing Analysis
      • Market Share Analysis, 2024
        • By Active Ingredient Class
        • By Route of Administration
        • By Target Animal
        • By Distribution Channel
    • Europe
      • Pricing Analysis
      • Market Share Analysis, 2024
        • By Active Ingredient Class
        • By Route of Administration
        • By Target Animal
        • By Distribution Channel
    • Germany
      • Pricing Analysis
      • Market Share Analysis, 2024
        • By Active Ingredient Class
        • By Route of Administration
        • By Target Animal
        • By Distribution Channel
    • France
      • Pricing Analysis
      • Market Share Analysis, 2024
        • By Active Ingredient Class
        • By Route of Administration
        • By Target Animal
        • By Distribution Channel
    • UK
      • Pricing Analysis
      • Market Share Analysis, 2024
        • By Active Ingredient Class
        • By Route of Administration
        • By Target Animal
        • By Distribution Channel
  18. Market Structure Analysis
    • Competition Dashboard
    • Competition Benchmarking
    • Market Share Analysis of Top Players
      • By Regional
      • By Active Ingredient Class
      • By Route of Administration
      • By Target Animal
      • By Distribution Channel
  19. Competition Analysis
    • Competition Deep Dive
      • Zoetis Inc.
        • Overview
        • Product Portfolio
        • Profitability by Market Segments (Product/Age /Sales Channel/Region)
        • Sales Footprint
        • Strategy Overview
          • Marketing Strategy
          • Product Strategy
          • Channel Strategy
      • Boehringer Ingelheim
        • Overview
        • Product Portfolio
        • Profitability by Market Segments (Product/Age /Sales Channel/Region)
        • Sales Footprint
        • Strategy Overview
          • Marketing Strategy
          • Product Strategy
          • Channel Strategy
      • Elanco Animal Health
        • Overview
        • Product Portfolio
        • Profitability by Market Segments (Product/Age /Sales Channel/Region)
        • Sales Footprint
        • Strategy Overview
          • Marketing Strategy
          • Product Strategy
          • Channel Strategy
      • Ceva Santé Animale
        • Overview
        • Product Portfolio
        • Profitability by Market Segments (Product/Age /Sales Channel/Region)
        • Sales Footprint
        • Strategy Overview
          • Marketing Strategy
          • Product Strategy
          • Channel Strategy
      • Virbac
        • Overview
        • Product Portfolio
        • Profitability by Market Segments (Product/Age /Sales Channel/Region)
        • Sales Footprint
        • Strategy Overview
          • Marketing Strategy
          • Product Strategy
          • Channel Strategy
      • Vetoquinol
        • Overview
        • Product Portfolio
        • Profitability by Market Segments (Product/Age /Sales Channel/Region)
        • Sales Footprint
        • Strategy Overview
          • Marketing Strategy
          • Product Strategy
          • Channel Strategy
      • Dechra Pharmaceuticals
        • Overview
        • Product Portfolio
        • Profitability by Market Segments (Product/Age /Sales Channel/Region)
        • Sales Footprint
        • Strategy Overview
          • Marketing Strategy
          • Product Strategy
          • Channel Strategy
      • Wockhardt Ltd.
        • Overview
        • Product Portfolio
        • Profitability by Market Segments (Product/Age /Sales Channel/Region)
        • Sales Footprint
        • Strategy Overview
          • Marketing Strategy
          • Product Strategy
          • Channel Strategy
      • Heska Corporation
        • Overview
        • Product Portfolio
        • Profitability by Market Segments (Product/Age /Sales Channel/Region)
        • Sales Footprint
        • Strategy Overview
          • Marketing Strategy
          • Product Strategy
          • Channel Strategy
      • Bayer Animal Health
        • Overview
        • Product Portfolio
        • Profitability by Market Segments (Product/Age /Sales Channel/Region)
        • Sales Footprint
        • Strategy Overview
          • Marketing Strategy
          • Product Strategy
          • Channel Strategy
      • Sumitomo Pharma Animal Health
        • Overview
        • Product Portfolio
        • Profitability by Market Segments (Product/Age /Sales Channel/Region)
        • Sales Footprint
        • Strategy Overview
          • Marketing Strategy
          • Product Strategy
          • Channel Strategy
      • Inovet Inc.
        • Overview
        • Product Portfolio
        • Profitability by Market Segments (Product/Age /Sales Channel/Region)
        • Sales Footprint
        • Strategy Overview
          • Marketing Strategy
          • Product Strategy
          • Channel Strategy
  20. Assumptions & Acronyms Used
  21. Research Methodology

List of Tables

  • Table 1: Global Market Value (USD Million) Forecast by Region, 2020-2035
  • Table 2: Global Market Volume (Units) Forecast by Region, 2020-2035
  • Table 3: Global Market Value (USD Million) Forecast by Active Ingredient Class, 2020-2035
  • Table 4: Global Market Volume (Units) Forecast by Active Ingredient Class, 2020-2035
  • Table 5: Global Market Value (USD Million) Forecast by Route of Administration, 2020-2035
  • Table 6: Global Market Volume (Units) Forecast by Route of Administration, 2020-2035
  • Table 7: Global Market Value (USD Million) Forecast by Target Animal, 2020-2035
  • Table 8: Global Market Volume (Units) Forecast by Target Animal, 2020-2035
  • Table 9: Global Market Value (USD Million) Forecast by Distribution Channel, 2020-2035
  • Table 10: Global Market Volume (Units) Forecast by Distribution Channel, 2020-2035
  • Table 11: North America Market Value (USD Million) Forecast by Country, 2020-2035
  • Table 12: North America Market Volume (Units) Forecast by Country, 2020-2035
  • Table 13: North America Market Value (USD Million) Forecast by Active Ingredient Class, 2020-2035
  • Table 14: North America Market Volume (Units) Forecast by Active Ingredient Class, 2020-2035
  • Table 15: North America Market Value (USD Million) Forecast by Route of Administration, 2020-2035
  • Table 16: North America Market Volume (Units) Forecast by Route of Administration, 2020-2035
  • Table 17: North America Market Value (USD Million) Forecast by Target Animal, 2020-2035
  • Table 18: North America Market Volume (Units) Forecast by Target Animal, 2020-2035
  • Table 19: North America Market Value (USD Million) Forecast by Distribution Channel, 2020-2035
  • Table 20: North America Market Volume (Units) Forecast by Distribution Channel, 2020-2035
  • Table 21: Latin America Market Value (USD Million) Forecast by Country, 2020-2035
  • Table 22: Latin America Market Volume (Units) Forecast by Country, 2020-2035
  • Table 23: Latin America Market Value (USD Million) Forecast by Active Ingredient Class, 2020-2035
  • Table 24: Latin America Market Volume (Units) Forecast by Active Ingredient Class, 2020-2035
  • Table 25: Latin America Market Value (USD Million) Forecast by Route of Administration, 2020-2035
  • Table 26: Latin America Market Volume (Units) Forecast by Route of Administration, 2020-2035
  • Table 27: Latin America Market Value (USD Million) Forecast by Target Animal, 2020-2035
  • Table 28: Latin America Market Volume (Units) Forecast by Target Animal, 2020-2035
  • Table 29: Latin America Market Value (USD Million) Forecast by Distribution Channel, 2020-2035
  • Table 30: Latin America Market Volume (Units) Forecast by Distribution Channel, 2020-2035
  • Table 31: Western Europe Market Value (USD Million) Forecast by Country, 2020-2035
  • Table 32: Western Europe Market Volume (Units) Forecast by Country, 2020-2035
  • Table 33: Western Europe Market Value (USD Million) Forecast by Active Ingredient Class, 2020-2035
  • Table 34: Western Europe Market Volume (Units) Forecast by Active Ingredient Class, 2020-2035
  • Table 35: Western Europe Market Value (USD Million) Forecast by Route of Administration, 2020-2035
  • Table 36: Western Europe Market Volume (Units) Forecast by Route of Administration, 2020-2035
  • Table 37: Western Europe Market Value (USD Million) Forecast by Target Animal, 2020-2035
  • Table 38: Western Europe Market Volume (Units) Forecast by Target Animal, 2020-2035
  • Table 39: Western Europe Market Value (USD Million) Forecast by Distribution Channel, 2020-2035
  • Table 40: Western Europe Market Volume (Units) Forecast by Distribution Channel, 2020-2035
  • Table 41: Eastern Europe Market Value (USD Million) Forecast by Country, 2020-2035
  • Table 42: Eastern Europe Market Volume (Units) Forecast by Country, 2020-2035
  • Table 43: Eastern Europe Market Value (USD Million) Forecast by Active Ingredient Class, 2020-2035
  • Table 44: Eastern Europe Market Volume (Units) Forecast by Active Ingredient Class, 2020-2035
  • Table 45: Eastern Europe Market Value (USD Million) Forecast by Route of Administration, 2020-2035
  • Table 46: Eastern Europe Market Volume (Units) Forecast by Route of Administration, 2020-2035
  • Table 47: Eastern Europe Market Value (USD Million) Forecast by Target Animal, 2020-2035
  • Table 48: Eastern Europe Market Volume (Units) Forecast by Target Animal, 2020-2035
  • Table 49: Eastern Europe Market Value (USD Million) Forecast by Distribution Channel, 2020-2035
  • Table 50: Eastern Europe Market Volume (Units) Forecast by Distribution Channel, 2020-2035
  • Table 51: East Asia Market Value (USD Million) Forecast by Country, 2020-2035
  • Table 52: East Asia Market Volume (Units) Forecast by Country, 2020-2035
  • Table 53: East Asia Market Value (USD Million) Forecast by Active Ingredient Class, 2020-2035
  • Table 54: East Asia Market Volume (Units) Forecast by Active Ingredient Class, 2020-2035
  • Table 55: East Asia Market Value (USD Million) Forecast by Route of Administration, 2020-2035
  • Table 56: East Asia Market Volume (Units) Forecast by Route of Administration, 2020-2035
  • Table 57: East Asia Market Value (USD Million) Forecast by Target Animal, 2020-2035
  • Table 58: East Asia Market Volume (Units) Forecast by Target Animal, 2020-2035
  • Table 59: East Asia Market Value (USD Million) Forecast by Distribution Channel, 2020-2035
  • Table 60: East Asia Market Volume (Units) Forecast by Distribution Channel, 2020-2035
  • Table 61: South Asia Market Value (USD Million) Forecast by Country, 2020-2035
  • Table 62: South Asia Market Volume (Units) Forecast by Country, 2020-2035
  • Table 63: South Asia Market Value (USD Million) Forecast by Active Ingredient Class, 2020-2035
  • Table 64: South Asia Market Volume (Units) Forecast by Active Ingredient Class, 2020-2035
  • Table 65: South Asia Market Value (USD Million) Forecast by Route of Administration, 2020-2035
  • Table 66: South Asia Market Volume (Units) Forecast by Route of Administration, 2020-2035
  • Table 67: South Asia Market Value (USD Million) Forecast by Target Animal, 2020-2035
  • Table 68: South Asia Market Volume (Units) Forecast by Target Animal, 2020-2035
  • Table 69: South Asia Market Value (USD Million) Forecast by Distribution Channel, 2020-2035
  • Table 70: South Asia Market Volume (Units) Forecast by Distribution Channel, 2020-2035
  • Table 71: MEA Market Value (USD Million) Forecast by Country, 2020-2035
  • Table 72: MEA Market Volume (Units) Forecast by Country, 2020-2035
  • Table 73: MEA Market Value (USD Million) Forecast by Active Ingredient Class, 2020-2035
  • Table 74: MEA Market Volume (Units) Forecast by Active Ingredient Class, 2020-2035
  • Table 75: MEA Market Value (USD Million) Forecast by Route of Administration, 2020-2035
  • Table 76: MEA Market Volume (Units) Forecast by Route of Administration, 2020-2035
  • Table 77: MEA Market Value (USD Million) Forecast by Target Animal, 2020-2035
  • Table 78: MEA Market Volume (Units) Forecast by Target Animal, 2020-2035
  • Table 79: MEA Market Value (USD Million) Forecast by Distribution Channel, 2020-2035
  • Table 80: MEA Market Volume (Units) Forecast by Distribution Channel, 2020-2035

List of Figures

  • Figure 1: Global Market Value (USD Million) by Active Ingredient Class, 2025-2035
  • Figure 2: Global Market Value (USD Million) by Route of Administration, 2025-2035
  • Figure 3: Global Market Value (USD Million) by Target Animal, 2025-2035
  • Figure 4: Global Market Value (USD Million) by Distribution Channel, 2025-2035
  • Figure 5: Global Market Value (USD Million) by Region, 2025-2035
  • Figure 6: Global Market Value (USD Million) Analysis by Region, 2020-2035
  • Figure 7: Global Market Volume (Units) Analysis by Region, 2020-2035
  • Figure 8: Global Market Value Share (%) and BPS Analysis by Region, 2025-2035
  • Figure 9: Global Market Y-o-Y Growth (%) Projections by Region, 2025-2035
  • Figure 10: Global Market Value (USD Million) Analysis by Active Ingredient Class, 2020-2035
  • Figure 11: Global Market Volume (Units) Analysis by Active Ingredient Class, 2020-2035
  • Figure 12: Global Market Value Share (%) and BPS Analysis by Active Ingredient Class, 2025-2035
  • Figure 13: Global Market Y-o-Y Growth (%) Projections by Active Ingredient Class, 2025-2035
  • Figure 14: Global Market Value (USD Million) Analysis by Route of Administration, 2020-2035
  • Figure 15: Global Market Volume (Units) Analysis by Route of Administration, 2020-2035
  • Figure 16: Global Market Value Share (%) and BPS Analysis by Route of Administration, 2025-2035
  • Figure 17: Global Market Y-o-Y Growth (%) Projections by Route of Administration, 2025-2035
  • Figure 18: Global Market Value (USD Million) Analysis by Target Animal, 2020-2035
  • Figure 19: Global Market Volume (Units) Analysis by Target Animal, 2020-2035
  • Figure 20: Global Market Value Share (%) and BPS Analysis by Target Animal, 2025-2035
  • Figure 21: Global Market Y-o-Y Growth (%) Projections by Target Animal, 2025-2035
  • Figure 22: Global Market Value (USD Million) Analysis by Distribution Channel, 2020-2035
  • Figure 23: Global Market Volume (Units) Analysis by Distribution Channel, 2020-2035
  • Figure 24: Global Market Value Share (%) and BPS Analysis by Distribution Channel, 2025-2035
  • Figure 25: Global Market Y-o-Y Growth (%) Projections by Distribution Channel, 2025-2035
  • Figure 26: Global Market Attractiveness by Active Ingredient Class, 2025-2035
  • Figure 27: Global Market Attractiveness by Route of Administration, 2025-2035
  • Figure 28: Global Market Attractiveness by Target Animal, 2025-2035
  • Figure 29: Global Market Attractiveness by Distribution Channel, 2025-2035
  • Figure 30: Global Market Attractiveness by Region, 2025-2035
  • Figure 31: North America Market Value (USD Million) by Active Ingredient Class, 2025-2035
  • Figure 32: North America Market Value (USD Million) by Route of Administration, 2025-2035
  • Figure 33: North America Market Value (USD Million) by Target Animal, 2025-2035
  • Figure 34: North America Market Value (USD Million) by Distribution Channel, 2025-2035
  • Figure 35: North America Market Value (USD Million) by Country, 2025-2035
  • Figure 36: North America Market Value (USD Million) Analysis by Country, 2020-2035
  • Figure 37: North America Market Volume (Units) Analysis by Country, 2020-2035
  • Figure 38: North America Market Value Share (%) and BPS Analysis by Country, 2025-2035
  • Figure 39: North America Market Y-o-Y Growth (%) Projections by Country, 2025-2035
  • Figure 40: North America Market Value (USD Million) Analysis by Active Ingredient Class, 2020-2035
  • Figure 41: North America Market Volume (Units) Analysis by Active Ingredient Class, 2020-2035
  • Figure 42: North America Market Value Share (%) and BPS Analysis by Active Ingredient Class, 2025-2035
  • Figure 43: North America Market Y-o-Y Growth (%) Projections by Active Ingredient Class, 2025-2035
  • Figure 44: North America Market Value (USD Million) Analysis by Route of Administration, 2020-2035
  • Figure 45: North America Market Volume (Units) Analysis by Route of Administration, 2020-2035
  • Figure 46: North America Market Value Share (%) and BPS Analysis by Route of Administration, 2025-2035
  • Figure 47: North America Market Y-o-Y Growth (%) Projections by Route of Administration, 2025-2035
  • Figure 48: North America Market Value (USD Million) Analysis by Target Animal, 2020-2035
  • Figure 49: North America Market Volume (Units) Analysis by Target Animal, 2020-2035
  • Figure 50: North America Market Value Share (%) and BPS Analysis by Target Animal, 2025-2035
  • Figure 51: North America Market Y-o-Y Growth (%) Projections by Target Animal, 2025-2035
  • Figure 52: North America Market Value (USD Million) Analysis by Distribution Channel, 2020-2035
  • Figure 53: North America Market Volume (Units) Analysis by Distribution Channel, 2020-2035
  • Figure 54: North America Market Value Share (%) and BPS Analysis by Distribution Channel, 2025-2035
  • Figure 55: North America Market Y-o-Y Growth (%) Projections by Distribution Channel, 2025-2035
  • Figure 56: North America Market Attractiveness by Active Ingredient Class, 2025-2035
  • Figure 57: North America Market Attractiveness by Route of Administration, 2025-2035
  • Figure 58: North America Market Attractiveness by Target Animal, 2025-2035
  • Figure 59: North America Market Attractiveness by Distribution Channel, 2025-2035
  • Figure 60: North America Market Attractiveness by Country, 2025-2035
  • Figure 61: Latin America Market Value (USD Million) by Active Ingredient Class, 2025-2035
  • Figure 62: Latin America Market Value (USD Million) by Route of Administration, 2025-2035
  • Figure 63: Latin America Market Value (USD Million) by Target Animal, 2025-2035
  • Figure 64: Latin America Market Value (USD Million) by Distribution Channel, 2025-2035
  • Figure 65: Latin America Market Value (USD Million) by Country, 2025-2035
  • Figure 66: Latin America Market Value (USD Million) Analysis by Country, 2020-2035
  • Figure 67: Latin America Market Volume (Units) Analysis by Country, 2020-2035
  • Figure 68: Latin America Market Value Share (%) and BPS Analysis by Country, 2025-2035
  • Figure 69: Latin America Market Y-o-Y Growth (%) Projections by Country, 2025-2035
  • Figure 70: Latin America Market Value (USD Million) Analysis by Active Ingredient Class, 2020-2035
  • Figure 71: Latin America Market Volume (Units) Analysis by Active Ingredient Class, 2020-2035
  • Figure 72: Latin America Market Value Share (%) and BPS Analysis by Active Ingredient Class, 2025-2035
  • Figure 73: Latin America Market Y-o-Y Growth (%) Projections by Active Ingredient Class, 2025-2035
  • Figure 74: Latin America Market Value (USD Million) Analysis by Route of Administration, 2020-2035
  • Figure 75: Latin America Market Volume (Units) Analysis by Route of Administration, 2020-2035
  • Figure 76: Latin America Market Value Share (%) and BPS Analysis by Route of Administration, 2025-2035
  • Figure 77: Latin America Market Y-o-Y Growth (%) Projections by Route of Administration, 2025-2035
  • Figure 78: Latin America Market Value (USD Million) Analysis by Target Animal, 2020-2035
  • Figure 79: Latin America Market Volume (Units) Analysis by Target Animal, 2020-2035
  • Figure 80: Latin America Market Value Share (%) and BPS Analysis by Target Animal, 2025-2035
  • Figure 81: Latin America Market Y-o-Y Growth (%) Projections by Target Animal, 2025-2035
  • Figure 82: Latin America Market Value (USD Million) Analysis by Distribution Channel, 2020-2035
  • Figure 83: Latin America Market Volume (Units) Analysis by Distribution Channel, 2020-2035
  • Figure 84: Latin America Market Value Share (%) and BPS Analysis by Distribution Channel, 2025-2035
  • Figure 85: Latin America Market Y-o-Y Growth (%) Projections by Distribution Channel, 2025-2035
  • Figure 86: Latin America Market Attractiveness by Active Ingredient Class, 2025-2035
  • Figure 87: Latin America Market Attractiveness by Route of Administration, 2025-2035
  • Figure 88: Latin America Market Attractiveness by Target Animal, 2025-2035
  • Figure 89: Latin America Market Attractiveness by Distribution Channel, 2025-2035
  • Figure 90: Latin America Market Attractiveness by Country, 2025-2035
  • Figure 91: Western Europe Market Value (USD Million) by Active Ingredient Class, 2025-2035
  • Figure 92: Western Europe Market Value (USD Million) by Route of Administration, 2025-2035
  • Figure 93: Western Europe Market Value (USD Million) by Target Animal, 2025-2035
  • Figure 94: Western Europe Market Value (USD Million) by Distribution Channel, 2025-2035
  • Figure 95: Western Europe Market Value (USD Million) by Country, 2025-2035
  • Figure 96: Western Europe Market Value (USD Million) Analysis by Country, 2020-2035
  • Figure 97: Western Europe Market Volume (Units) Analysis by Country, 2020-2035
  • Figure 98: Western Europe Market Value Share (%) and BPS Analysis by Country, 2025-2035
  • Figure 99: Western Europe Market Y-o-Y Growth (%) Projections by Country, 2025-2035
  • Figure 100: Western Europe Market Value (USD Million) Analysis by Active Ingredient Class, 2020-2035
  • Figure 101: Western Europe Market Volume (Units) Analysis by Active Ingredient Class, 2020-2035
  • Figure 102: Western Europe Market Value Share (%) and BPS Analysis by Active Ingredient Class, 2025-2035
  • Figure 103: Western Europe Market Y-o-Y Growth (%) Projections by Active Ingredient Class, 2025-2035
  • Figure 104: Western Europe Market Value (USD Million) Analysis by Route of Administration, 2020-2035
  • Figure 105: Western Europe Market Volume (Units) Analysis by Route of Administration, 2020-2035
  • Figure 106: Western Europe Market Value Share (%) and BPS Analysis by Route of Administration, 2025-2035
  • Figure 107: Western Europe Market Y-o-Y Growth (%) Projections by Route of Administration, 2025-2035
  • Figure 108: Western Europe Market Value (USD Million) Analysis by Target Animal, 2020-2035
  • Figure 109: Western Europe Market Volume (Units) Analysis by Target Animal, 2020-2035
  • Figure 110: Western Europe Market Value Share (%) and BPS Analysis by Target Animal, 2025-2035
  • Figure 111: Western Europe Market Y-o-Y Growth (%) Projections by Target Animal, 2025-2035
  • Figure 112: Western Europe Market Value (USD Million) Analysis by Distribution Channel, 2020-2035
  • Figure 113: Western Europe Market Volume (Units) Analysis by Distribution Channel, 2020-2035
  • Figure 114: Western Europe Market Value Share (%) and BPS Analysis by Distribution Channel, 2025-2035
  • Figure 115: Western Europe Market Y-o-Y Growth (%) Projections by Distribution Channel, 2025-2035
  • Figure 116: Western Europe Market Attractiveness by Active Ingredient Class, 2025-2035
  • Figure 117: Western Europe Market Attractiveness by Route of Administration, 2025-2035
  • Figure 118: Western Europe Market Attractiveness by Target Animal, 2025-2035
  • Figure 119: Western Europe Market Attractiveness by Distribution Channel, 2025-2035
  • Figure 120: Western Europe Market Attractiveness by Country, 2025-2035
  • Figure 121: Eastern Europe Market Value (USD Million) by Active Ingredient Class, 2025-2035
  • Figure 122: Eastern Europe Market Value (USD Million) by Route of Administration, 2025-2035
  • Figure 123: Eastern Europe Market Value (USD Million) by Target Animal, 2025-2035
  • Figure 124: Eastern Europe Market Value (USD Million) by Distribution Channel, 2025-2035
  • Figure 125: Eastern Europe Market Value (USD Million) by Country, 2025-2035
  • Figure 126: Eastern Europe Market Value (USD Million) Analysis by Country, 2020-2035
  • Figure 127: Eastern Europe Market Volume (Units) Analysis by Country, 2020-2035
  • Figure 128: Eastern Europe Market Value Share (%) and BPS Analysis by Country, 2025-2035
  • Figure 129: Eastern Europe Market Y-o-Y Growth (%) Projections by Country, 2025-2035
  • Figure 130: Eastern Europe Market Value (USD Million) Analysis by Active Ingredient Class, 2020-2035
  • Figure 131: Eastern Europe Market Volume (Units) Analysis by Active Ingredient Class, 2020-2035
  • Figure 132: Eastern Europe Market Value Share (%) and BPS Analysis by Active Ingredient Class, 2025-2035
  • Figure 133: Eastern Europe Market Y-o-Y Growth (%) Projections by Active Ingredient Class, 2025-2035
  • Figure 134: Eastern Europe Market Value (USD Million) Analysis by Route of Administration, 2020-2035
  • Figure 135: Eastern Europe Market Volume (Units) Analysis by Route of Administration, 2020-2035
  • Figure 136: Eastern Europe Market Value Share (%) and BPS Analysis by Route of Administration, 2025-2035
  • Figure 137: Eastern Europe Market Y-o-Y Growth (%) Projections by Route of Administration, 2025-2035
  • Figure 138: Eastern Europe Market Value (USD Million) Analysis by Target Animal, 2020-2035
  • Figure 139: Eastern Europe Market Volume (Units) Analysis by Target Animal, 2020-2035
  • Figure 140: Eastern Europe Market Value Share (%) and BPS Analysis by Target Animal, 2025-2035
  • Figure 141: Eastern Europe Market Y-o-Y Growth (%) Projections by Target Animal, 2025-2035
  • Figure 142: Eastern Europe Market Value (USD Million) Analysis by Distribution Channel, 2020-2035
  • Figure 143: Eastern Europe Market Volume (Units) Analysis by Distribution Channel, 2020-2035
  • Figure 144: Eastern Europe Market Value Share (%) and BPS Analysis by Distribution Channel, 2025-2035
  • Figure 145: Eastern Europe Market Y-o-Y Growth (%) Projections by Distribution Channel, 2025-2035
  • Figure 146: Eastern Europe Market Attractiveness by Active Ingredient Class, 2025-2035
  • Figure 147: Eastern Europe Market Attractiveness by Route of Administration, 2025-2035
  • Figure 148: Eastern Europe Market Attractiveness by Target Animal, 2025-2035
  • Figure 149: Eastern Europe Market Attractiveness by Distribution Channel, 2025-2035
  • Figure 150: Eastern Europe Market Attractiveness by Country, 2025-2035
  • Figure 151: East Asia Market Value (USD Million) by Active Ingredient Class, 2025-2035
  • Figure 152: East Asia Market Value (USD Million) by Route of Administration, 2025-2035
  • Figure 153: East Asia Market Value (USD Million) by Target Animal, 2025-2035
  • Figure 154: East Asia Market Value (USD Million) by Distribution Channel, 2025-2035
  • Figure 155: East Asia Market Value (USD Million) by Country, 2025-2035
  • Figure 156: East Asia Market Value (USD Million) Analysis by Country, 2020-2035
  • Figure 157: East Asia Market Volume (Units) Analysis by Country, 2020-2035
  • Figure 158: East Asia Market Value Share (%) and BPS Analysis by Country, 2025-2035
  • Figure 159: East Asia Market Y-o-Y Growth (%) Projections by Country, 2025-2035
  • Figure 160: East Asia Market Value (USD Million) Analysis by Active Ingredient Class, 2020-2035
  • Figure 161: East Asia Market Volume (Units) Analysis by Active Ingredient Class, 2020-2035
  • Figure 162: East Asia Market Value Share (%) and BPS Analysis by Active Ingredient Class, 2025-2035
  • Figure 163: East Asia Market Y-o-Y Growth (%) Projections by Active Ingredient Class, 2025-2035
  • Figure 164: East Asia Market Value (USD Million) Analysis by Route of Administration, 2020-2035
  • Figure 165: East Asia Market Volume (Units) Analysis by Route of Administration, 2020-2035
  • Figure 166: East Asia Market Value Share (%) and BPS Analysis by Route of Administration, 2025-2035
  • Figure 167: East Asia Market Y-o-Y Growth (%) Projections by Route of Administration, 2025-2035
  • Figure 168: East Asia Market Value (USD Million) Analysis by Target Animal, 2020-2035
  • Figure 169: East Asia Market Volume (Units) Analysis by Target Animal, 2020-2035
  • Figure 170: East Asia Market Value Share (%) and BPS Analysis by Target Animal, 2025-2035
  • Figure 171: East Asia Market Y-o-Y Growth (%) Projections by Target Animal, 2025-2035
  • Figure 172: East Asia Market Value (USD Million) Analysis by Distribution Channel, 2020-2035
  • Figure 173: East Asia Market Volume (Units) Analysis by Distribution Channel, 2020-2035
  • Figure 174: East Asia Market Value Share (%) and BPS Analysis by Distribution Channel, 2025-2035
  • Figure 175: East Asia Market Y-o-Y Growth (%) Projections by Distribution Channel, 2025-2035
  • Figure 176: East Asia Market Attractiveness by Active Ingredient Class, 2025-2035
  • Figure 177: East Asia Market Attractiveness by Route of Administration, 2025-2035
  • Figure 178: East Asia Market Attractiveness by Target Animal, 2025-2035
  • Figure 179: East Asia Market Attractiveness by Distribution Channel, 2025-2035
  • Figure 180: East Asia Market Attractiveness by Country, 2025-2035
  • Figure 181: South Asia Market Value (USD Million) by Active Ingredient Class, 2025-2035
  • Figure 182: South Asia Market Value (USD Million) by Route of Administration, 2025-2035
  • Figure 183: South Asia Market Value (USD Million) by Target Animal, 2025-2035
  • Figure 184: South Asia Market Value (USD Million) by Distribution Channel, 2025-2035
  • Figure 185: South Asia Market Value (USD Million) by Country, 2025-2035
  • Figure 186: South Asia Market Value (USD Million) Analysis by Country, 2020-2035
  • Figure 187: South Asia Market Volume (Units) Analysis by Country, 2020-2035
  • Figure 188: South Asia Market Value Share (%) and BPS Analysis by Country, 2025-2035
  • Figure 189: South Asia Market Y-o-Y Growth (%) Projections by Country, 2025-2035
  • Figure 190: South Asia Market Value (USD Million) Analysis by Active Ingredient Class, 2020-2035
  • Figure 191: South Asia Market Volume (Units) Analysis by Active Ingredient Class, 2020-2035
  • Figure 192: South Asia Market Value Share (%) and BPS Analysis by Active Ingredient Class, 2025-2035
  • Figure 193: South Asia Market Y-o-Y Growth (%) Projections by Active Ingredient Class, 2025-2035
  • Figure 194: South Asia Market Value (USD Million) Analysis by Route of Administration, 2020-2035
  • Figure 195: South Asia Market Volume (Units) Analysis by Route of Administration, 2020-2035
  • Figure 196: South Asia Market Value Share (%) and BPS Analysis by Route of Administration, 2025-2035
  • Figure 197: South Asia Market Y-o-Y Growth (%) Projections by Route of Administration, 2025-2035
  • Figure 198: South Asia Market Value (USD Million) Analysis by Target Animal, 2020-2035
  • Figure 199: South Asia Market Volume (Units) Analysis by Target Animal, 2020-2035
  • Figure 200: South Asia Market Value Share (%) and BPS Analysis by Target Animal, 2025-2035
  • Figure 201: South Asia Market Y-o-Y Growth (%) Projections by Target Animal, 2025-2035
  • Figure 202: South Asia Market Value (USD Million) Analysis by Distribution Channel, 2020-2035
  • Figure 203: South Asia Market Volume (Units) Analysis by Distribution Channel, 2020-2035
  • Figure 204: South Asia Market Value Share (%) and BPS Analysis by Distribution Channel, 2025-2035
  • Figure 205: South Asia Market Y-o-Y Growth (%) Projections by Distribution Channel, 2025-2035
  • Figure 206: South Asia Market Attractiveness by Active Ingredient Class, 2025-2035
  • Figure 207: South Asia Market Attractiveness by Route of Administration, 2025-2035
  • Figure 208: South Asia Market Attractiveness by Target Animal, 2025-2035
  • Figure 209: South Asia Market Attractiveness by Distribution Channel, 2025-2035
  • Figure 210: South Asia Market Attractiveness by Country, 2025-2035
  • Figure 211: MEA Market Value (USD Million) by Active Ingredient Class, 2025-2035
  • Figure 212: MEA Market Value (USD Million) by Route of Administration, 2025-2035
  • Figure 213: MEA Market Value (USD Million) by Target Animal, 2025-2035
  • Figure 214: MEA Market Value (USD Million) by Distribution Channel, 2025-2035
  • Figure 215: MEA Market Value (USD Million) by Country, 2025-2035
  • Figure 216: MEA Market Value (USD Million) Analysis by Country, 2020-2035
  • Figure 217: MEA Market Volume (Units) Analysis by Country, 2020-2035
  • Figure 218: MEA Market Value Share (%) and BPS Analysis by Country, 2025-2035
  • Figure 219: MEA Market Y-o-Y Growth (%) Projections by Country, 2025-2035
  • Figure 220: MEA Market Value (USD Million) Analysis by Active Ingredient Class, 2020-2035
  • Figure 221: MEA Market Volume (Units) Analysis by Active Ingredient Class, 2020-2035
  • Figure 222: MEA Market Value Share (%) and BPS Analysis by Active Ingredient Class, 2025-2035
  • Figure 223: MEA Market Y-o-Y Growth (%) Projections by Active Ingredient Class, 2025-2035
  • Figure 224: MEA Market Value (USD Million) Analysis by Route of Administration, 2020-2035
  • Figure 225: MEA Market Volume (Units) Analysis by Route of Administration, 2020-2035
  • Figure 226: MEA Market Value Share (%) and BPS Analysis by Route of Administration, 2025-2035
  • Figure 227: MEA Market Y-o-Y Growth (%) Projections by Route of Administration, 2025-2035
  • Figure 228: MEA Market Value (USD Million) Analysis by Target Animal, 2020-2035
  • Figure 229: MEA Market Volume (Units) Analysis by Target Animal, 2020-2035
  • Figure 230: MEA Market Value Share (%) and BPS Analysis by Target Animal, 2025-2035
  • Figure 231: MEA Market Y-o-Y Growth (%) Projections by Target Animal, 2025-2035
  • Figure 232: MEA Market Value (USD Million) Analysis by Distribution Channel, 2020-2035
  • Figure 233: MEA Market Volume (Units) Analysis by Distribution Channel, 2020-2035
  • Figure 234: MEA Market Value Share (%) and BPS Analysis by Distribution Channel, 2025-2035
  • Figure 235: MEA Market Y-o-Y Growth (%) Projections by Distribution Channel, 2025-2035
  • Figure 236: MEA Market Attractiveness by Active Ingredient Class, 2025-2035
  • Figure 237: MEA Market Attractiveness by Route of Administration, 2025-2035
  • Figure 238: MEA Market Attractiveness by Target Animal, 2025-2035
  • Figure 239: MEA Market Attractiveness by Distribution Channel, 2025-2035
  • Figure 240: MEA Market Attractiveness by Country, 2025-2035

Frequently Asked Questions

How big is the veterinary emetic agents market in 2025?

The veterinary emetic agents market is estimated to be valued at USD 261.6 million in 2025.

What will be the size of the veterinary emetic agents market in 2035?

The market size for the veterinary emetic agents market is projected to reach approximately USD 451.10 million by 2035.

How much will the veterinary emetic agents market grow between 2025 and 2035?

The veterinary emetic agents market is expected to grow at a CAGR of 5.6% between 2025 and 2035.

What are the key Active Ingredient Class in the veterinary emetic agents market?

The active ingredient class in the veterinary emetic agents market include centrally-acting emetic agents, peripherally-acting emetic agents, and among others.

Which distribution channel segment will contribute a significant share in the veterinary emetic agents market in 2025?

In terms of distribution channel, the veterinary clinics & hospitals segment is projected to command the highest share at 63.6% in the veterinary emetic agents market in 2025.

Explore Similar Insights

Future Market Insights

Veterinary Emetic Agents Market