Reports

- Global Locations -

Headquarters

Future Market Insights, Inc.

Christiana Corporate, 200
Continental Drive, Suite 401,
Newark, Delaware - 19713,
United States

T: +1-845-579-5705

Americas

Future Market Insights, Inc.

616 Corporate Way, Suite 2-9018,
Valley Cottage, NY 10989, United States

T: +1-347-918-3531

MEA

Future Market Insights

1602-6 Jumeirah Bay X2 Tower, Plot No: JLT-PH2-X2A,
Jumeirah Lakes Towers, Dubai,
United Arab Emirates

Europe

Future Market Insights

3rd Floor, 207 Regent Street,
W1B 3HH London
United Kingdom

T: + 44 (0) 20 8123 9659
D: +44 (0) 20 3287 4268

Asia Pacific

Future Market Insights

IndiaLand Global Tech Park, Unit UG-1, Behind Grand HighStreet, Phase 1, Hinjawadi, MH, Pune – 411057, India

Veterinary Wound Cleansers Market Snapshot

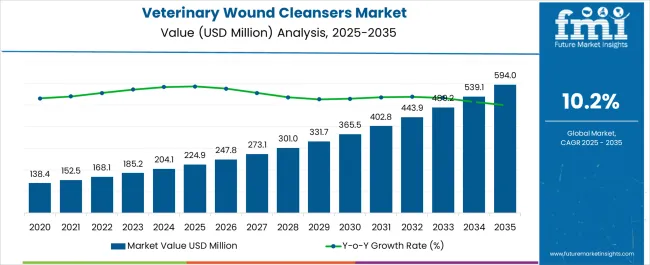
According to Future Market Insights research, during the projected period, the global veterinary wound cleansers market is expected to grow at a CAGR of 10.2%. The market value is projected to increase from US$ 185.2 Million in 2023 to US$ 488.2 Million by 2033. The veterinary wound cleansers market was valued at US$ 169.5 Million at the end of 2022 and is anticipated to exhibit Y-o-Y growth of 9.2% in 2023.

Market Outlook:

Data Points Market Insights
Market Value 2022 US$ 169.5 Million
Market Value 2023 US$ 185.2 Million
Market Value 2033 US$ 488.2 Million
CAGR 2023 to 2033 10.2%
Market Share of Top 5 Countries 51.5%
Key Companies List Elanco, Vetoquinol, Virbac, Innovacyn Inc., Axio Biosolutions Pvt Ltd, Jorgen Kruuse, Dechra Pharmaceuticals, Neogen Corporation, Ethicon, Sonoma Pharma, AMERX Health Care Corp.

The veterinary wound cleansers market is expanding rapidly due to increased animal health awareness and the growing number of pet owners. Wound cleansers are essential in the healing process because they prevent infections and promote speedier recovery.

These cleansers are made with safe and effective antiseptic and antibacterial chemicals. There is a large variety of veterinary wound cleansers in the market, including sprays, gels, and solutions for various types of wounds and animals.

Likewise, developments in veterinary medicine and the availability of novel wound management solutions are propelling market growth. With rising demand for high-quality veterinary care, the wound cleansers market has a bright future.

Don't pay for what you don't need

Customize your report by selecting specific countries or regions and save 30%!

Sales Analysis of Veterinary Wound Cleansers Market from 2012 to 2022 Vs Market Outlook for 2023 to 2033

The global market recorded a historic CAGR of 8.0% in the last 10 years from 2012 to 2022.

Around 15% of the US$ 1.13 Billion advanced wound care market is contributed by the veterinary wound cleansers market.

The increased number of animal procedures is a key factor driving the veterinary wound cleansers market. The number of veterinary surgeries performed worldwide has increased as more pet owners prioritize the health and well-being of their animal companions. These surgeries can range from common treatments like spaying and neutering to more difficult operations like orthopedic surgery or tumor excision.

Several causes are driving the growing trend of animal surgery. For starters, pet owners are more ready to engage in advanced medical procedures, including surgical operations, for their dogs.

This shift in attitude toward dogs as cherished family members has resulted in a greater need for veterinary surgeries and, as a result, a greater demand for wound cleansers to aid in post-operative wound care and surgical site infection (SSI) wounds.

  • According to the article published in Research in Veterinary Science on May 2021, in 103 clinics, 1789 dogs with (ASA) American Society of Anesthesiologists physical status 1 or 2 had clean surgical procedures. SSI was found in 85/1550 dogs (5.5%), 25/500 orthopedic/neurosurgery treatments (5.0%), and 60/1050 soft tissue procedures (5.7%).

Likewise, advances in veterinary medicine have increased the number of surgical choices available to animals. Surgery has become safer and more accessible as a result of new procedures, improved anesthetic, and improved surgical instruments. This has encouraged more veterinarians to undertake procedures, which has increased the number of customers for wound cleanser makers.

Also, as the relevance of wound care in veterinary medicine has grown, veterinarians and pet owners have prioritized post-operative wound management. Proper wound cleansing is critical for avoiding infections, facilitating healing, and guaranteeing successful surgical outcomes. Because of this increased awareness, there is a greater demand for high-quality wound cleansers created expressly for veterinary usage.

In a nutshell, the increase in animal surgeries is a significant market growth driver for the veterinary wound cleanser market, driven by pet owners' increased investment in pet healthcare, advancements in veterinary medicine, the prevalence of chronic diseases, and growing awareness of wound care.

What are the Key Lucrative Opportunities Propelling the Demand for Veterinary Wound Cleansers?

A prominent growth factor for the veterinary wound cleanser industry is the rising cost of veterinary healthcare. Pet owners are prepared to spend more on veterinary services and goods as they become more aware of the value of giving their animal friends top-notch healthcare.

  • According to the research article published in Animals (Basel) Journal on March 2023, Pet owners with incomes over $55,000 spend on average $164 more than those with incomes under $55,000.

Preventive care, diagnostics, therapies, and post-operative wound care are all included in this increase in veterinary healthcare spending. In order to ensure appropriate healing and reduce the risk of problems, wound cleansers are essential in the post-operative care of wounds.

The rising cost of veterinary healthcare suggests a greater need for efficient wound cleansers made specifically for veterinary usage. By providing unique and specialized solutions that satisfy the changing needs and expectations of pet owners and veterinary experts, manufacturers in the veterinary wound cleansers market can benefit from this growth driver and drive market expansion.

Sabyasachi Ghosh
Sabyasachi Ghosh

Principal Consultant

Talk to Analyst

Find your sweet spots for generating winning opportunities in this market.

What Factors Present a Restrictive Outlook for the Veterinary Wound Cleansers Market?

The veterinary wound cleansers market growth is constrained by low awareness among pet owners regarding product and acceptance rates. Even some healthcare experts and pet owners are unaware of the availability and advantages of specialized wound cleansers, despite the significance of good wound care in veterinary medicine.

The widespread use of veterinary wound cleansers is hampered by this low level of understanding. Additionally, due to familiarity and perceived cost-effectiveness, classic wound care techniques such as using basic saline solutions or antiseptic solutions are frequently used.

Manufacturers face difficulties in gaining market share and educating potential customers about the benefits of utilizing specialized wound cleansers for efficient wound treatment in animals due to the low level of knowledge and limited adoption of veterinary wound cleansers.
Country wise insights

What Makes the USA the Prominent Market for Veterinary Wound Cleansers Market?

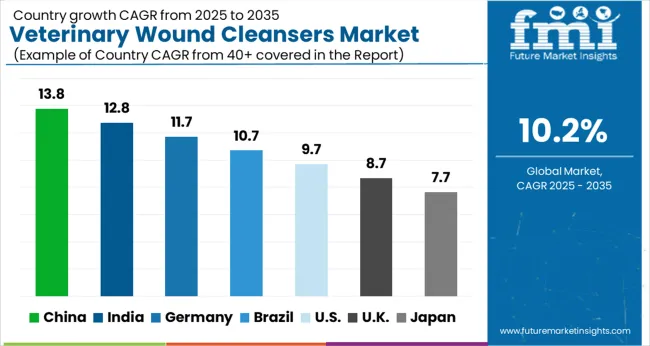
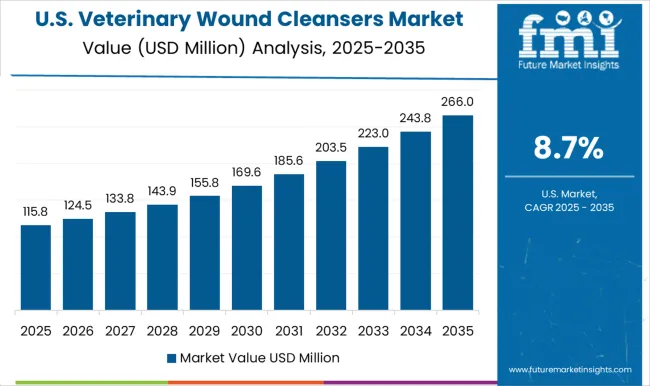
The USA dominates with a total market share of 27.2% in 2022 and is projected to continue experiencing high growth throughout the forecast period.

Increasing occurrence of orthopedic difficulties such as congenital hip dysplasia (CHD) and age-related problems are the prominent growth drivers for veterinary wound cleanser industry in the USA.

Orthopedic issues are common in animals, particularly in certain breeds, and may necessitate surgical intervention for diagnosis, treatment, or management. These procedures, which may include joint replacements, major fracture repairs, or ligament reconstructions, necessitate the use of competent wound cleansers for post-operative care.

  • According to the research article studying Canine Hip Dysplasia Demographics in the USA and Canada, published in Journal of Veterinary Medicine on March 2012, the prevalence of CHD in veterinary teaching hospitals in the United States was highest in Rottweilers (35.4%) and lowest in miniature schnauzer dogs (1.5%).

As more pet owners become aware of these orthopedic disorders and seek appropriate medical care for their animals, the demand for veterinary-specific wound cleansers is likely to expand.

Veterinary wound cleanser makers must meet this market demand by developing safe and effective solutions for post-operative wound treatment in orthopedically challenged animals.
Why has Germany Considered a Lucrative Market for Veterinary Wound Cleansers?

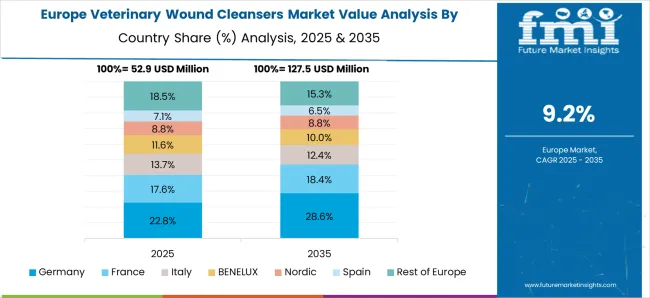
Germany holds a market share of around 6.4% in the global market in 2022.

A prominent growth factor for the veterinary wound cleanser industry is the increased availability and diversity of wound cleansers in Germany. German veterinary treatment is well-established, and animal health is highly prioritized.

There has been an increase in demand for a variety of wound cleansers that are specially designed for veterinary usage due to improvements in veterinary medicine and greater knowledge of wound care. As a result, there are now more and more types of wound cleansers like aerosol sprays, wound lotions, wound creams available in the German market to meet the needs of various wound types, sizes, and specifications.

Veterinarians and pet owners now have more access to and options for wound cleansers, giving them the chance to choose the best solutions for efficient wound management. The variety and accessibility of wound cleansers in Germany contribute to the country's total market for veterinary wound cleansers' expansion and growth.

What Makes United Kingdom an Emerging Market for Veterinary Wound Cleansers?

United Kingdom holds a 5.4% share in the global market share in 2022.

The rising pet ownership rate in the United Kingdom is a key driver for the veterinary wound cleansers market growth. Pet ownership in the United Kingdom has steadily increased as more individuals and families appreciate the companionship and emotional support that pets bring.

  • According to the article National Dog Survey: Describing United Kingdom Dog and Ownership Demographics published in Animals (Basel) Journal on March 2023, Dogs are the most popular companion animals in the United Kingdom, with an estimated 34% of families keeping one or more dogs.

Rising number of pet ownership subsequently raises the need for proper care and treatment, including wound management. Accidents, traumas, and surgical procedures are all prevalent in pets, resulting in wounds that must be effectively cleaned and cared for.

Pet owners attempt to ensure their cherished animals' well-being and quick recovery, increases the need for veterinary wound cleansers. Manufacturers of veterinary wound cleansers have been making profits from this trend by offering a variety of high-quality products created exclusively for pet wound care, appealing to the growing market of pet owners in the United Kingdom.

Get the data you need at a Fraction of the cost

Personalize your report by choosing insights you need
and save 40%!

Category Insights

Which Animal Segment Accounts for High Market Share Holding?

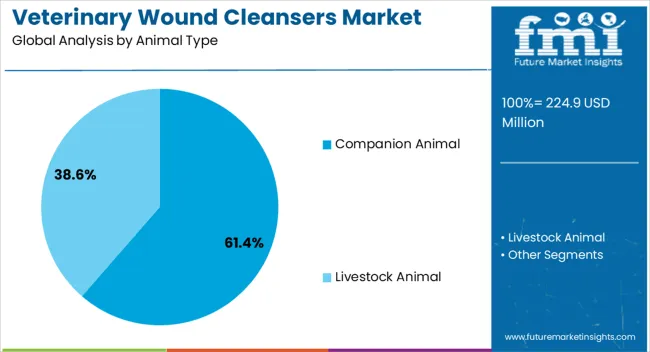
Companion animal hold a revenue share of 62.0% in 2022, and the same trend is being followed over the forecasted period.

Because of the growing number of pets and the growing awareness among pet owners about the need for wound care and healthcare for their animal companions, the companion animal segment dominates the animal type segment in the market for veterinary wound cleansers.

Which End User Occupies a Dominant Share of the Market?

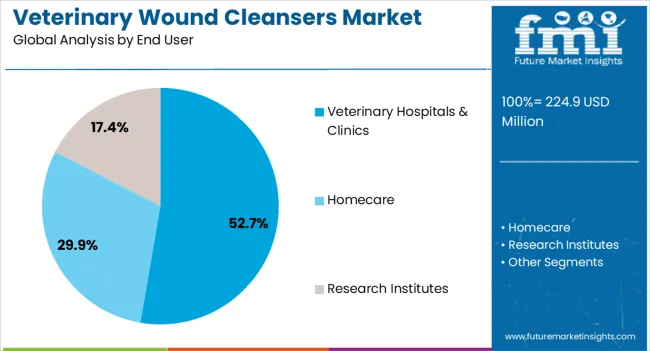
Veterinary hospitals & clinics hold a market share of 76.4% in 2022, within the forecasted period.

Due to the increased need for wound care products, the veterinary hospitals & clinics sector dominates the end user segment in global market. Veterinary hospitals and clinics provide primary care for animals, making them big users of veterinary wound cleansers for post-operative treatment and wound management.
Competitive Landscape

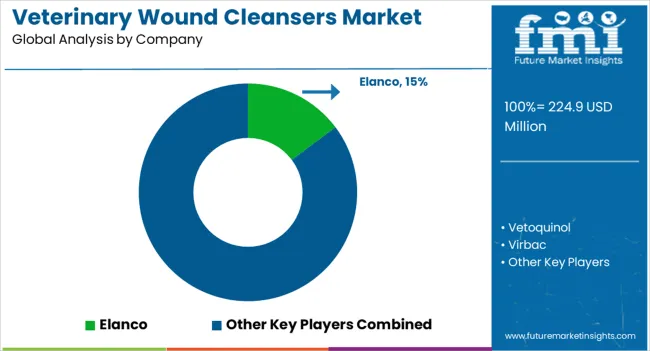
Strategic collaborations and research sponsorships are the key strategies adopted by manufacturers within this market to increase their product sales in different geographies.

  • In August 2022, Elanco and Colorado State University have formed a strategic partnership to advance sustainability innovations for livestock producers by leveraging AgNext's research and ecosystem health expertise.

Similarly, recent developments related to companies in veterinary wound cleansers market have been tracked by the team at Future Market Insights, which are available in the full report.

Report Scope as per Veterinary Wound Cleansers Industry Analysis

Attribute Details
Forecast Period 2023 to 2033
Historical Data Available for 2012 to 2022
Market Analysis US$ Million for Value
Key Regions Covered North America, Latin America, Europe, South Asia, East Asia, Oceania, and Middle East & Africa
Key Countries Covered USA, Canada, Brazil, Mexico, Argentina, United Kingdom, Germany, Italy, Russia, Spain, France, BENELUX, India, Thailand, Indonesia, Malaysia, Japan, China, South Korea, Australia, New Zealand, Türkiye, GCC Countries, South Africa, and Northern Africa
Key Market Segments Covered Animal, End User and Region
Key Companies Profiled
  • Elanco
  • Vetoquinol
  • Virbac
  • Innovacyn, Inc.
  • Axio Biosolutions Pvt Ltd
  • Jorgen Kruuse
  • Dechra Pharmaceuticals
  • Neogen Corporation
  • Ethicon
  • Sonoma Pharma
  • AMERX Health Care Corp.
Report Coverage Market Forecast, Competition Intelligence, DROT Analysis, Market Dynamics and Challenges, Strategic Growth Initiatives
Pricing Available upon Request

Key Market Segments Covered in Veterinary Wound Cleansers Industry Research

By Animal Type:

  • Companion Animal
  • Livestock Animal

By End User:

  • Veterinary Hospitals & Clinics
  • Homecare
  • Research Institutes

By Region:

  • North America
  • Latin America
  • Europe
  • South Asia
  • East Asia
  • Oceania
  • Middle East and Africa (MEA)

Frequently Asked Questions

What is the Estimated Market Size of Global Veterinary Wound Cleansers Market in 2023?

The global veterinary wound cleansers market value could be near US$ 185.2 million in 2023.

Which Region is Growing at a Faster Rate in Production of Veterinary Wound Cleansers?

Production of veterinary wound cleansers in Asia Pacific is expected to grow rapidly through 2033.

Which is Presently the Leading Region for Selling Veterinary Wound Cleansers?

The United States leads the veterinary wound cleansers sales, with 27.2% market share in 2022.

What is the Overall Share of the Market from Companion Animal Segment?

The companion animal segment captured an overall market share of 62% in 2022.

Which Country Dominates the Europe Veterinary Wound Cleansers Market?

Germany, with a market share of around 6.4% dominates the Europe market.

Table of Content

1. Executive Summary

    1.1. Global Market Outlook

    1.2. Demand Side Trends

    1.3. Supply Side Trends

    1.4. Analysis and Recommendations

2. Market Overview

    2.1. Market Coverage / Taxonomy

    2.2. Market Definition / Scope / Limitations

    2.3. Inclusion and Exclusions

3. Key Market Trends

    3.1. Key Trends Impacting the Market

    3.2. Innovation/Development Trends

4. Value Added Insights

    4.1. Adoption Rate/Usage Analysis for

    4.2. Regulatory Scenario

    4.3. PESTLE Analysis

    4.4. Government Initiative and Healthcare Policies

    4.5. Porter's Analysis

    4.6. Promotional Strategies, By Key Players

    4.7. Unmet Needs

    4.8. Value Chain Analysis

5. Market Background

    5.1. Macro-Economic Factors

        5.1.1. Global Healthcare Expenditure Outlook

        5.1.2. Veterinary Healthcare Products Market Analysis

    5.2. Forecast Factors - Relevance & Impact

        5.2.1. Awareness of Veterinary Wound Cleansers

        5.2.2. Increasing Prevalence of Chronic Disease

        5.2.3. Growing Investment in Healthcare Expenditure

        5.2.4. New Product Launch

        5.2.5. Top Companies’ Historical Growth

        5.2.6. Product-Based Cost

        5.2.7. Strategic Collaboration and Partnership

    5.3. Market Dynamics

        5.3.1. Drivers

        5.3.2. Restraints

        5.3.3. Opportunity Analysis

6. Global Market Demand (in Value or Size in US$ Million) Analysis 2012 to 2022 and Forecast, 2023 to 2033

    6.1. Revenue Opportunity Scenario- Likely/Conservative/Optimistic

    6.2. Historical Market Value (US$ Million) Analysis, 2012 to 2022

    6.3. Current and Future Market Value (US$ Million) Projections, 2023 to 2033

        6.3.1. Y-o-Y Growth Trend Analysis

        6.3.2. Absolute $ Opportunity Analysis

7. Global Market Analysis 2012 to 2022 and Forecast 2023 to 2033, By Animal Type

    7.1. Introduction / Key Findings

    7.2. Historical Market Size (US$ Million) Analysis by Animal Type, 2012 to 2022

    7.3. Current and Future Market Size (US$ Million) Analysis and Forecast by Animal Type, 2023 to 2033

        7.3.1. Companion Animals

        7.3.2. Livestock Animals

    7.4. Market Attractiveness Analysis by Animal Type

8. Global Market Analysis 2012 to 2022 and Forecast 2023 to 2033, By End User

    8.1. Introduction / Key Findings

    8.2. Historical Market Size (US$ Million) Analysis by End User , 2012 to 2022

    8.3. Current and Future Market Size (US$ Million) Analysis and Forecast by End User , 2023 to 2033

        8.3.1. Veterinary Hospitals & Clinics

        8.3.2. Homecare

        8.3.3. Research Institutes

    8.4. Market Attractiveness Analysis by End User

9. Global Market Analysis 2012 to 2022 and Forecast 2023 to 2033, By Region

    9.1. Introduction

    9.2. Historical Market Size (US$ Million) Analysis by Region, 2012 to 2022

    9.3. Current and Future Market Size (US$ Million) Analysis and Forecast by Region, 2023 to 2033

        9.3.1. North America

        9.3.2. Latin America

        9.3.3. Europe

        9.3.4. East Asia

        9.3.5. South Asia

        9.3.6. Oceania

        9.3.7. Middle East & Africa

    9.4. Market Attractiveness Analysis by Region

10. North America Market Analysis 2012 to 2022 and Forecast 2023 to 2033

    10.1. Introduction

    10.2. Historical Market Size (US$ Million) Trend Analysis by Market Taxonomy, 2012 to 2022

    10.3. Current and Future Market Size (US$ Million) Analysis and Forecast by Market Taxonomy, 2023 to 2033

        10.3.1. By Country

            10.3.1.1. The USA

            10.3.1.2. Canada

        10.3.2. By Animal Type

        10.3.3. By End User

    10.4. Market Attractiveness Analysis

        10.4.1. By Country

        10.4.2. By Animal Type

        10.4.3. By End User

    10.5. Market Trends

    10.6. Drivers and Restraints - Impact Analysis

    10.7. Country Level Analysis & Forecast

        10.7.1. USA Market

            10.7.1.1. Introduction

            10.7.1.2. Market Analysis and Forecast by Market Taxonomy

                10.7.1.2.1. By Animal Type

                10.7.1.2.2. By End User

        10.7.2. Canada Market

            10.7.2.1. Introduction

            10.7.2.2. Market Analysis and Forecast by Market Taxonomy

                10.7.2.2.1. By Animal Type

                10.7.2.2.2. By End User

11. Latin America Market Analysis 2012 to 2022 and Forecast 2023 to 2033

    11.1. Introduction

    11.2. Historical Market Size (US$ Million) Analysis by Market Taxonomy, 2012 to 2022

    11.3. Current and Future Market Size (US$ Million) Analysis and Forecast by Market Taxonomy, 2023 to 2033

        11.3.1. By Country

            11.3.1.1. Brazil

            11.3.1.2. Mexico

            11.3.1.3. Argentina

            11.3.1.4. Rest of Latin America

        11.3.2. By Animal Type

        11.3.3. By End User

    11.4. Market Attractiveness Analysis

        11.4.1. By Country

        11.4.2. By Animal Type

        11.4.3. By End User

    11.5. Market Trends

    11.6. Drivers and Restraints - Impact Analysis

    11.7. Country Level Analysis & Forecast

        11.7.1. Brazil Market Analysis

            11.7.1.1. Introduction

            11.7.1.2. Market Analysis and Forecast by Market Taxonomy

                11.7.1.2.1. By Animal Type

                11.7.1.2.2. By End User

        11.7.2. Mexico Market Analysis

            11.7.2.1. Introduction

            11.7.2.2. Market Analysis and Forecast by Market Taxonomy

                11.7.2.2.1. By Animal Type

                11.7.2.2.2. By End User

        11.7.3. Argentina Market Analysis

            11.7.3.1. Introduction

            11.7.3.2. Market Analysis and Forecast by Market Taxonomy

                11.7.3.2.1. By Animal Type

                11.7.3.2.2. By End User

12. Europe Market 2012 to 2022 and Forecast 2023 to 2033

    12.1. Introduction

    12.2. Historical Market Size (US$ Million) Analysis by Market Taxonomy, 2012 – 2022

    12.3. Current and Future Market Size (US$ Million) Analysis and Forecast by Market Taxonomy, 2023 to 2033

        12.3.1. By Country

            12.3.1.1. Germany

            12.3.1.2. France

            12.3.1.3. Spain

            12.3.1.4. Italy

            12.3.1.5. BENELUX

            12.3.1.6. United Kingdom

            12.3.1.7. Russia

            12.3.1.8. Rest of Europe

        12.3.2. By Animal Type

        12.3.3. By End User

    12.4. Market Attractiveness Analysis

        12.4.1. By Country

        12.4.2. By Animal Type

        12.4.3. By End User

    12.5. Market Trends

    12.6. Drivers and Restraints - Impact Analysis

    12.7. Country Level Analysis & Forecast

        12.7.1. Germany Market Analysis

            12.7.1.1. Introduction

            12.7.1.2. Market Analysis and Forecast by Market Taxonomy

                12.7.1.2.1. By Animal Type

                12.7.1.2.2. By End User

        12.7.2. France Market Analysis

            12.7.2.1. Introduction

            12.7.2.2. Market Analysis and Forecast by Market Taxonomy

                12.7.2.2.1. By Animal Type

                12.7.2.2.2. By End User

        12.7.3. Spain Market Analysis

            12.7.3.1. Introduction

            12.7.3.2. Market Analysis and Forecast by Market Taxonomy

                12.7.3.2.1. By Animal Type

                12.7.3.2.2. By End User

        12.7.4. Italy Market Analysis

            12.7.4.1. Introduction

            12.7.4.2. Market Analysis and Forecast by Market Taxonomy

                12.7.4.2.1. By Animal Type

                12.7.4.2.2. By End User

        12.7.5. BENELUX Market Analysis

            12.7.5.1. Introduction

            12.7.5.2. Market Analysis and Forecast by Market Taxonomy

                12.7.5.2.1. By Animal Type

                12.7.5.2.2. By End User

        12.7.6. United Kingdom Market Analysis

            12.7.6.1. Introduction

            12.7.6.2. Market Analysis and Forecast by Market Taxonomy

                12.7.6.2.1. By Animal Type

                12.7.6.2.2. By End User

        12.7.7. Russia Market Analysis

            12.7.7.1. Introduction

            12.7.7.2. Market Analysis and Forecast by Market Taxonomy

                12.7.7.2.1. By Animal Type

                12.7.7.2.2. By End User

13. East Asia Market Analysis 2012 to 2022 and Forecast 2023 to 2033

    13.1. Introduction

    13.2. Historical Market Size (US$ Million) Analysis by Market Taxonomy, 2012 to 2022

    13.3. Current and Future Market Size (US$ Million) Analysis and Forecast by Market Taxonomy, 2023 to 2033

        13.3.1. By Country

            13.3.1.1. China

            13.3.1.2. Japan

            13.3.1.3. South Korea

        13.3.2. By Animal Type

        13.3.3. By End User

    13.4. Market Attractiveness Analysis

        13.4.1. By Country

        13.4.2. By Animal Type

        13.4.3. By End User

        13.4.4. Market Trends

    13.5. Key Market Participants - Intensity Mapping

    13.6. Drivers and Restraints - Impact Analysis

    13.7. Country Level Analysis & Forecast

        13.7.1. China Market Analysis

            13.7.1.1. Introduction

            13.7.1.2. Market Analysis and Forecast by Market Taxonomy

                13.7.1.2.1. By Animal Type

                13.7.1.2.2. By End User

        13.7.2. Japan Market Analysis

            13.7.2.1. Introduction

            13.7.2.2. Market Analysis and Forecast by Market Taxonomy

                13.7.2.2.1. By Animal Type

                13.7.2.2.2. By End User

        13.7.3. South Korea Market Analysis

            13.7.3.1. Introduction

            13.7.3.2. Market Analysis and Forecast by Market Taxonomy

                13.7.3.2.1. By Animal Type

                13.7.3.2.2. By End User

14. South Asia Market Analysis 2012 to 2022 and Forecast 2023 to 2033

    14.1. Introduction

    14.2. Historical Market Size (US$ Million) Analysis by Market Taxonomy, 2012 to 2022

    14.3. Current and Future Market Size (US$ Million) Analysis and Forecast by Market Taxonomy, 2023 to 2033

        14.3.1. By Country

            14.3.1.1. India

            14.3.1.2. Indonesia

            14.3.1.3. Thailand

            14.3.1.4. Malaysia

            14.3.1.5. Rest of South Asia

        14.3.2. By Animal Type

        14.3.3. By End User

    14.4. Market Attractiveness Analysis

        14.4.1. By Country

        14.4.2. By Animal Type

        14.4.3. By End User

    14.5. Market Trends

    14.6. Drivers and Restraints - Impact Analysis

    14.7. Country Level Analysis & Forecast

        14.7.1. India Market Analysis

            14.7.1.1. Introduction

            14.7.1.2. Market Analysis and Forecast by Market Taxonomy

                14.7.1.2.1. By Animal Type

                14.7.1.2.2. By End User

        14.7.2. Indonesia Market Analysis

            14.7.2.1. Introduction

            14.7.2.2. Market Analysis and Forecast by Market Taxonomy

                14.7.2.2.1. By Animal Type

                14.7.2.2.2. By End User

        14.7.3. Thailand Market Analysis

            14.7.3.1. Introduction

            14.7.3.2. Market Analysis and Forecast by Market Taxonomy

                14.7.3.2.1. By Animal Type

                14.7.3.2.2. By End User

        14.7.4. Malaysia Market Analysis

            14.7.4.1. Introduction

            14.7.4.2. Market Analysis and Forecast by Market Taxonomy

                14.7.4.2.1. By Animal Type

                14.7.4.2.2. By End User

15. Oceania Market Analysis 2012 to 2022 and Forecast 2023 to 2033

    15.1. Introduction

    15.2. Historical Market Size (US$ Million) Analysis by Market Taxonomy, 2012 to 2022

    15.3. Current and Future Market Size (US$ Million) Analysis and Forecast by Market Taxonomy, 2023 to 2033

        15.3.1. By Country

            15.3.1.1. Australia

            15.3.1.2. New Zealand

        15.3.2. By Animal Type

        15.3.3. By End User

    15.4. Market Attractiveness Analysis

        15.4.1. By Country

        15.4.2. By Animal Type

        15.4.3. By End User

    15.5. Market Trends

    15.6. Drivers and Restraints - Impact Analysis

    15.7. Country Level Analysis & Forecast

        15.7.1. Australia Market Analysis

            15.7.1.1. Introduction

            15.7.1.2. Market Analysis and Forecast by Market Taxonomy

                15.7.1.2.1. By Animal Type

                15.7.1.2.2. By End User

        15.7.2. New Zealand Market Analysis

            15.7.2.1. Introduction

            15.7.2.2. Market Analysis and Forecast by Market Taxonomy

                15.7.2.2.1. By Animal Type

                15.7.2.2.2. By End User

16. Middle East & Africa Market Analysis 2012 to 2022 and Forecast 2023 to 2033

    16.1. Introduction

    16.2. Historical Market Size (US$ Million) Analysis by Market Taxonomy, 2012 to 2022

    16.3. Current and Future Market Size (US$ Million) Analysis and Forecast by Market Taxonomy, 2023 to 2033

        16.3.1. By Country

            16.3.1.1. GCC Countries

            16.3.1.2. Türkiye

            16.3.1.3. Northern Africa

            16.3.1.4. South Africa

            16.3.1.5. Rest of MEA

        16.3.2. By Animal Type

        16.3.3. By End User

    16.4. Market Attractiveness Analysis

        16.4.1. By Country

        16.4.2. By Animal Type

        16.4.3. By End User

    16.5. Market Trends

    16.6. Drivers and Restraints - Impact Analysis

    16.7. Country Level Analysis & Forecast

        16.7.1. GCC Countries Market Analysis

            16.7.1.1. Introduction

            16.7.1.2. Market Analysis and Forecast by Market Taxonomy

                16.7.1.2.1. By Animal Type

                16.7.1.2.2. By End User

        16.7.2. Türkiye Market Analysis

            16.7.2.1. Introduction

            16.7.2.2. Market Analysis and Forecast by Market Taxonomy

                16.7.2.2.1. By Animal Type

                16.7.2.2.2. By End User

        16.7.3. Northern Africa Market Analysis

            16.7.3.1. Introduction

            16.7.3.2. Market Analysis and Forecast by Market Taxonomy

                16.7.3.2.1. By Animal Type

                16.7.3.2.2. By End User

        16.7.4. South Africa Market Analysis

            16.7.4.1. Introduction

            16.7.4.2. Market Analysis and Forecast by Market Taxonomy

                16.7.4.2.1. By Animal Type

                16.7.4.2.2. By End User

17. Market Structure Analysis

    17.1. Market Analysis by Tier of Companies

    17.2. Market Share Analysis of Top Players

    17.3. Market Presence Analysis

        17.3.1. Regional footprint of Players

        17.3.2. Product footprint by Players

        17.3.3. Channel footprint by Players

18. Competition Analysis

    18.1. Competition Dashboard

    18.2. Competition Benchmarking

    18.3. Competition Deep Dive

        18.3.1. Elanco

            18.3.1.1. Overview

            18.3.1.2. Product Portfolio

            18.3.1.3. Key Financials

            18.3.1.4. Sales Footprint

            18.3.1.5. SWOT Analysis

            18.3.1.6. Key Developments

            18.3.1.7. Strategy Overview

                18.3.1.7.1. Channel Strategy

                18.3.1.7.2. Marketing Strategy

                18.3.1.7.3. Product Strategy

        18.3.2. Vetoquinol

            18.3.2.1. Overview

            18.3.2.2. Product Portfolio

            18.3.2.3. Key Financials

            18.3.2.4. Sales Footprint

            18.3.2.5. SWOT Analysis

            18.3.2.6. Key Developments

            18.3.2.7. Strategy Overview

                18.3.2.7.1. Channel Strategy

                18.3.2.7.2. Marketing Strategy

                18.3.2.7.3. Product Strategy

        18.3.3. Virbac

            18.3.3.1. Overview

            18.3.3.2. Product Portfolio

            18.3.3.3. Key Financials

            18.3.3.4. Sales Footprint

            18.3.3.5. SWOT Analysis

            18.3.3.6. Key Developments

            18.3.3.7. Strategy Overview

                18.3.3.7.1. Channel Strategy

                18.3.3.7.2. Marketing Strategy

                18.3.3.7.3. Product Strategy

        18.3.4. Innovacyn, Inc.

            18.3.4.1. Overview

            18.3.4.2. Product Portfolio

            18.3.4.3. Key Financials

            18.3.4.4. Sales Footprint

            18.3.4.5. SWOT Analysis

            18.3.4.6. Key Developments

            18.3.4.7. Strategy Overview

                18.3.4.7.1. Channel Strategy

                18.3.4.7.2. Marketing Strategy

                18.3.4.7.3. Product Strategy

        18.3.5. Axio Biosolutions Pvt Ltd

            18.3.5.1. Overview

            18.3.5.2. Product Portfolio

            18.3.5.3. Key Financials

            18.3.5.4. Sales Footprint

            18.3.5.5. SWOT Analysis

            18.3.5.6. Key Developments

            18.3.5.7. Strategy Overview

                18.3.5.7.1. Channel Strategy

                18.3.5.7.2. Marketing Strategy

                18.3.5.7.3. Product Strategy

        18.3.6. Jorgen Kruuse

            18.3.6.1. Overview

            18.3.6.2. Product Portfolio

            18.3.6.3. Key Financials

            18.3.6.4. Sales Footprint

            18.3.6.5. SWOT Analysis

            18.3.6.6. Key Developments

            18.3.6.7. Strategy Overview

                18.3.6.7.1. Channel Strategy

                18.3.6.7.2. Marketing Strategy

                18.3.6.7.3. Product Strategy

        18.3.7. Dechra Pharmaceuticals

            18.3.7.1. Overview

            18.3.7.2. Product Portfolio

            18.3.7.3. Key Financials

            18.3.7.4. Sales Footprint

            18.3.7.5. SWOT Analysis

            18.3.7.6. Key Developments

            18.3.7.7. Strategy Overview

                18.3.7.7.1. Channel Strategy

                18.3.7.7.2. Marketing Strategy

                18.3.7.7.3. Product Strategy

        18.3.8. Neogen Corporation

            18.3.8.1. Overview

            18.3.8.2. Product Portfolio

            18.3.8.3. Key Financials

            18.3.8.4. Sales Footprint

            18.3.8.5. SWOT Analysis

            18.3.8.6. Key Developments

            18.3.8.7. Strategy Overview

                18.3.8.7.1. Channel Strategy

                18.3.8.7.2. Marketing Strategy

                18.3.8.7.3. Product Strategy

        18.3.9. Ethicon

            18.3.9.1. Overview

            18.3.9.2. Product Portfolio

            18.3.9.3. Key Financials

            18.3.9.4. Sales Footprint

            18.3.9.5. SWOT Analysis

            18.3.9.6. Key Developments

            18.3.9.7. Strategy Overview

                18.3.9.7.1. Channel Strategy

                18.3.9.7.2. Marketing Strategy

                18.3.9.7.3. Product Strategy

        18.3.10. Sonoma Pharma

            18.3.10.1. Overview

            18.3.10.2. Product Portfolio

            18.3.10.3. Key Financials

            18.3.10.4. Sales Footprint

            18.3.10.5. SWOT Analysis

            18.3.10.6. Key Developments

            18.3.10.7. Strategy Overview

                18.3.10.7.1. Channel Strategy

                18.3.10.7.2. Marketing Strategy

                18.3.10.7.3. Product Strategy

        18.3.11. AMERX Health Care Corp.

            18.3.11.1. Overview

            18.3.11.2. Product Portfolio

            18.3.11.3. Key Financials

            18.3.11.4. Sales Footprint

            18.3.11.5. SWOT Analysis

            18.3.11.6. Key Developments

            18.3.11.7. Strategy Overview

                18.3.11.7.1. Channel Strategy

                18.3.11.7.2. Marketing Strategy

                18.3.11.7.3. Product Strategy

19. Assumptions and Acronyms Used

20. Research Methodology

List of Tables

Table 1: Global Market Value (US$ Million) Analysis and Forecast 2012 to 2033, By Animal Type

Table 3: Global Market Value (US$ Million) Analysis and Forecast 2012 to 2033, By End User

Table 4: Global Market Value (US$ Million) Analysis and Forecast 2012 to 2033, By Region

Table 5: North America Market Value (US$ Million) Analysis and Forecast 2012 to 2033, By Country

Table 6: North America Market Value (US$ Million) Analysis and Forecast 2012 to 2033, By Animal Type

Table 7: North America Market Value (US$ Million) Analysis and Forecast 2012 to 2033, By End User

Table 8: Latin America Market Value (US$ Million) Analysis and Forecast 2012 to 2033, By Country

Table 9: Latin America Market Value (US$ Million) Analysis and Forecast 2012 to 2033, By Animal Type

Table 10: Latin America Market Value (US$ Million) Analysis and Forecast 2012 to 2033, By End User

Table 11: Europe Market Value (US$ Million) Analysis and Forecast 2012 to 2033, By Country

Table 12: Europe Market Value (US$ Million) Analysis and Forecast 2012 to 2033, By Animal Type

Table 13: Europe Market Value (US$ Million) Analysis and Forecast 2012 to 2033, By End User

Table 14: South Asia Market Value (US$ Million) Analysis and Forecast 2012 to 2033, By Country

Table 15: South Asia Market Value (US$ Million) Analysis and Forecast 2012 to 2033, By Animal Type

Table 16: South Asia Market Value (US$ Million) Analysis and Forecast 2012 to 2033, By End User

Table 17: East Asia Market Value (US$ Million) Analysis and Forecast 2012 to 2033, By Country

Table 18: East Asia Market Value (US$ Million) Analysis and Forecast 2012 to 2033, By Animal Type

Table 19: East Asia Market Value (US$ Million) Analysis and Forecast 2012 to 2033, By End User

Table 20: Oceania Market Value (US$ Million) Analysis and Forecast 2012 to 2033, By Country

Table 22: Oceania Market Value (US$ Million) Analysis and Forecast 2012 to 2033, By Animal Type

Table 23: Oceania Market Value (US$ Million) Analysis and Forecast 2012 to 2033, By End User

Table 24: Middle East and Africa Market Value (US$ Million) Analysis and Forecast 2012 to 2033, By Country

Table 25: Middle East and Africa Market Value (US$ Million) Analysis and Forecast 2012 to 2033, By Animal Type

Table 26: Middle East and Africa Market Value (US$ Million) Analysis and Forecast 2012 to 2033, By End User

List of Charts

Figure 1: Global Market Value (Us$ Million) Analysis, 2012 to 2022

Figure 2: Global Market Forecast & Y-O-Y Growth, 2023 to 2033

Figure 3: Global Market Absolute $ Opportunity (Us$ Million) Analysis, 2022–2033

Figure 4: Global Market Value Share (%) Analysis 2023 and 2033, By Animal Type

Figure 5: Global Market Y-O-Y Growth (%) Analysis 2022 to 2033, By Animal Type

Figure 6: Global Market Attractiveness Analysis 2023 to 2033, By Animal Type

Figure 7: Global Market Value Share (%) Analysis 2023 and 2033, By End User

Figure 8: Global Market Y-O-Y Growth (%) Analysis 2022 to 2033, By End User

Figure 9: Global Market Attractiveness Analysis 2023 to 2033, By End User

Figure 10: Global Market Value Share (%) Analysis 2023 and 2033, By Region

Figure 11: Global Market Y-O-Y Growth (%) Analysis 2022 to 2033, By Region

Figure 12: Global Market Attractiveness Analysis 2023 to 2033, By Region

Figure 13: North America Market Value (Us$ Million) Analysis, 2012 to 2022

Figure 14: North America Market Value (Us$ Million) Forecast, 2023 to 2033

Figure 15: North America Market Value Share, By Animal Type (2023 E)

Figure 16: North America Market Value Share, By End User (2023 E)

Figure 17: North America Market Value Share, By Country (2023 E)

Figure 18: North America Market Attractiveness Analysis By Animal Type, 2023 to 2033

Figure 19: North America Market Attractiveness Analysis By End User, 2023 to 2033

Figure 20: North America Market Attractiveness Analysis By Country, 2023 to 2033

Figure 21: USA Market Value Proportion Analysis, 2022

Figure 22: Global Vs. USA Growth Comparison, 2022 to 2033

Figure 23: USA Market Share Analysis (%) By Animal Type, 2022 & 2033

Figure 24: USA Market Share Analysis (%) By End User, 2022 & 2033

Figure 25: Canada Market Value Proportion Analysis, 2022

Figure 26: Global Vs. Canada. Growth Comparison, 2022 to 2033

Figure 27: Canada Market Share Analysis (%) By Animal Type, 2022 & 2033

Figure 28: Canada Market Share Analysis (%) By End User, 2022 & 2033

Figure 29: Latin America Market Value (Us$ Million) Analysis, 2012 to 2022

Figure 30: Latin America Market Value (Us$ Million) Forecast, 2023 to 2033

Figure 31: Latin America Market Value Share, By Animal Type (2023 E)

Figure 32: Latin America Market Value Share, By End User (2023 E)

Figure 33: Latin America Market Value Share, By Country (2023 E)

Figure 34: Latin America Market Attractiveness Analysis By Animal Type, 2023 to 2033

Figure 35: Latin America Market Attractiveness Analysis By End User, 2023 to 2033

Figure 36: Latin America Market Attractiveness Analysis By Country, 2023 to 2033

Figure 37: Mexico Market Value Proportion Analysis, 2022

Figure 38: Global Vs Mexico Growth Comparison, 2022 to 2033

Figure 39: Mexico Market Share Analysis (%) By Animal Type, 2022 & 2033

Figure 40: Mexico Market Share Analysis (%) By End User, 2022 & 2033

Figure 41: Brazil Market Value Proportion Analysis, 2022

Figure 42: Global Vs. Brazil. Growth Comparison, 2022 to 2033

Figure 43: Brazil Market Share Analysis (%) By Animal Type, 2022 & 2033

Figure 44: Brazil Market Share Analysis (%) By End User, 2022 & 2033

Figure 45: Argentina Market Value Proportion Analysis, 2022

Figure 46: Global Vs Argentina Growth Comparison, 2022 to 2033

Figure 47: Argentina Market Share Analysis (%) By Animal Type, 2022 & 2033

Figure 48: Argentina Market Share Analysis (%) By End User, 2022 & 2033

Figure 49: Europe Market Value (Us$ Million) Analysis, 2012 to 2022

Figure 50: Europe Market Value (Us$ Million) Forecast, 2023 to 2033

Figure 51: Europe Market Value Share, By Animal Type (2023 E)

Figure 52: Europe Market Value Share, By End User (2023 E)

Figure 53: Europe Market Value Share, By Country (2023 E)

Figure 54: Europe Market Attractiveness Analysis By Animal Type, 2023 to 2033

Figure 55: Europe Market Attractiveness Analysis By End User, 2023 to 2033

Figure 56: Europe Market Attractiveness Analysis By Country, 2023 to 2033

Figure 57: United Kingdom Market Value Proportion Analysis, 2022

Figure 58: Global Vs. United Kingdom Growth Comparison, 2022 to 2033

Figure 59: United Kingdom Market Share Analysis (%) By Animal Type, 2022 & 2033

Figure 60: United Kingdom Market Share Analysis (%) By End User, 2022 & 2033

Figure 61: Germany Market Value Proportion Analysis, 2022

Figure 62: Global Vs. Germany Growth Comparison, 2022 to 2033

Figure 63: Germany Market Share Analysis (%) By Animal Type, 2022 & 2033

Figure 64: Germany Market Share Analysis (%) By End User, 2022 & 2033

Figure 65: Italy Market Value Proportion Analysis, 2022

Figure 66: Global Vs. Italy Growth Comparison, 2022 to 2033

Figure 67: Italy Market Share Analysis (%) By Animal Type, 2022 & 2033

Figure 68: Italy Market Share Analysis (%) By End User, 2022 & 2033

Figure 69: France Market Value Proportion Analysis, 2022

Figure 70: Global Vs France Growth Comparison, 2022 to 2033

Figure 71: France Market Share Analysis (%) By Animal Type, 2022 & 2033

Figure 72: France Market Share Analysis (%) By End User, 2022 & 2033

Figure 73: Spain Market Value Proportion Analysis, 2022

Figure 74: Global Vs Spain Growth Comparison, 2022 to 2033

Figure 75: Spain Market Share Analysis (%) By Animal Type, 2022 & 2033

Figure 76: Spain Market Share Analysis (%) By End User, 2022 & 2033

Figure 77: Russia Market Value Proportion Analysis, 2022

Figure 78: Global Vs Russia Growth Comparison, 2022 to 2033

Figure 79: Russia Market Share Analysis (%) By Animal Type, 2022 & 2033

Figure 80: Russia Market Share Analysis (%) By End User, 2022 & 2033

Figure 81: Benelux Market Value Proportion Analysis, 2022

Figure 82: Global Vs Benelux Growth Comparison, 2022 to 2033

Figure 83: Benelux Market Share Analysis (%) By Animal Type, 2022 & 2033

Figure 84: Benelux Market Share Analysis (%) By End User, 2022 & 2033

Figure 85: East Asia Market Value (Us$ Million) Analysis, 2012 to 2022

Figure 86: East Asia Market Value (Us$ Million) Forecast, 2023 to 2033

Figure 87: East Asia Market Value Share, By Animal Type (2023 E)

Figure 88: East Asia Market Value Share, By End User (2023 E)

Figure 89: East Asia Market Value Share, By Country (2023 E)

Figure 90: East Asia Market Attractiveness Analysis By Animal Type, 2023 to 2033

Figure 91: East Asia Market Attractiveness Analysis By End User, 2023 to 2033

Figure 92: East Asia Market Attractiveness Analysis By Country, 2023 to 2033

Figure 93: China Market Value Proportion Analysis, 2022

Figure 94: Global Vs. China Growth Comparison, 2022 to 2033

Figure 95: China Market Share Analysis (%) By Animal Type, 2022 & 2033

Figure 96: China Market Share Analysis (%) By End User, 2022 & 2033

Figure 97: Japan Market Value Proportion Analysis, 2022

Figure 98: Global Vs. Japan Growth Comparison, 2022 to 2033

Figure 99: Japan Market Share Analysis (%) By Animal Type, 2022 & 2033

Figure 100: Japan Market Share Analysis (%) By End User, 2022 & 2033

Figure 101: South Korea Market Value Proportion Analysis, 2022

Figure 102: Global Vs South Korea Growth Comparison, 2022 to 2033

Figure 103: South Korea Market Share Analysis (%) By Animal Type, 2022 & 2033

Figure 104: South Korea Market Share Analysis (%) By End User, 2022 & 2033

Figure 105: South Asia Market Value (Us$ Million) Analysis, 2012 to 2022

Figure 106: South Asia Market Value (Us$ Million) Forecast, 2023 to 2033

Figure 107: South Asia Market Value Share, By Animal Type (2023 E)

Figure 108: South Asia Market Value Share, By End User (2023 E)

Figure 109: South Asia Market Value Share, By Country (2023 E)

Figure 110: South Asia Market Attractiveness Analysis By Animal Type, 2023 to 2033

Figure 111: South Asia Market Attractiveness Analysis By End User, 2023 to 2033

Figure 112: South Asia Market Attractiveness Analysis By Country, 2023 to 2033

Figure 113: India Market Value Proportion Analysis, 2022

Figure 114: Global Vs. India Growth Comparison, 2022 to 2033

Figure 115: India Market Share Analysis (%) By Animal Type, 2022 & 2033

Figure 116: India Market Share Analysis (%) By End User, 2022 & 2033

Figure 117: Indonesia Market Value Proportion Analysis, 2022

Figure 118: Global Vs. Indonesia Growth Comparison, 2022 to 2033

Figure 119: Indonesia Market Share Analysis (%) By Animal Type, 2022 & 2033

Figure 120: Indonesia Market Share Analysis (%) By End User, 2022 & 2033

Figure 121: Malaysia Market Value Proportion Analysis, 2022

Figure 122: Global Vs. Malaysia Growth Comparison, 2022 to 2033

Figure 123: Malaysia Market Share Analysis (%) By Animal Type, 2022 & 2033

Figure 124: Malaysia Market Share Analysis (%) By End User, 2022 & 2033

Figure 125: Thailand Market Value Proportion Analysis, 2022

Figure 126: Global Vs. Thailand Growth Comparison, 2022 to 2033

Figure 127: Thailand Market Share Analysis (%) By Animal Type, 2022 & 2033

Figure 128: Thailand Market Share Analysis (%) By End User, 2022 & 2033

Figure 129: Oceania Market Value (Us$ Million) Analysis, 2012 to 2022

Figure 130: Oceania Market Value (Us$ Million) Forecast, 2023 to 2033

Figure 131: Oceania Market Value Share, By Animal Type (2023 E)

Figure 132: Oceania Market Value Share, By End User (2023 E)

Figure 133: Oceania Market Value Share, By Country (2023 E)

Figure 134: Oceania Market Attractiveness Analysis By Animal Type, 2023 to 2033

Figure 135: Oceania Market Attractiveness Analysis By End User, 2023 to 2033

Figure 136: Oceania Market Attractiveness Analysis By Country, 2023 to 2033

Figure 137: Australia Market Value Proportion Analysis, 2022

Figure 138: Global Vs. Australia Growth Comparison, 2022 to 2033

Figure 139: Australia Market Share Analysis (%) By Animal Type, 2022 & 2033

Figure 140: Australia Market Share Analysis (%) By End User, 2022 & 2033

Figure 141: New Zealand Market Value Proportion Analysis, 2022

Figure 142: Global Vs New Zealand Growth Comparison, 2022 to 2033

Figure 143: New Zealand Market Share Analysis (%) By Animal Type, 2022 & 2033

Figure 144: New Zealand Market Share Analysis (%) By End User, 2022 & 2033

Figure 145: Middle East & Africa Market Value (Us$ Million) Analysis, 2012 to 2022

Figure 146: Middle East & Africa Market Value (Us$ Million) Forecast, 2023 to 2033

Figure 147: Middle East & Africa Market Value Share, By Animal Type (2023 E)

Figure 148: Middle East & Africa Market Value Share, By End User (2023 E)

Figure 149: Middle East & Africa Market Value Share, By Country (2023 E)

Figure 150: Middle East & Africa Market Attractiveness Analysis By Animal Type, 2023 to 2033

Figure 151: Middle East & Africa Market Attractiveness Analysis By End User, 2023 to 2033

Figure 152: Middle East & Africa Market Attractiveness Analysis By Country, 2023 to 2033

Figure 153: GCC Countries Market Value Proportion Analysis, 2022

Figure 154: Global Vs GCC Countries Growth Comparison, 2022 to 2033

Figure 155: GCC Countries Market Share Analysis (%) By Animal Type, 2022 & 2033

Figure 156: GCC Countries Market Share Analysis (%) By End User, 2022 & 2033

Figure 157: Türkiye Market Value Proportion Analysis, 2022

Figure 158: Global Vs. Türkiye Growth Comparison, 2022 to 2033

Figure 159: Türkiye Market Share Analysis (%) By Animal Type, 2022 & 2033

Figure 160: Türkiye Market Share Analysis (%) By End User, 2022 & 2033

Figure 161: South Africa Market Value Proportion Analysis, 2022

Figure 162: Global Vs. South Africa Growth Comparison, 2022 to 2033

Figure 163: South Africa Market Share Analysis (%) By Animal Type, 2022 & 2033

Figure 164: South Africa Market Share Analysis (%) By End User, 2022 & 2033

Figure 165: North Africa Market Value Proportion Analysis, 2022

Figure 166: Global Vs North Africa Growth Comparison, 2022 to 2033

Figure 167: North Africa Market Share Analysis (%) By Animal Type, 2022 & 2033

Figure 168: North Africa Market Share Analysis (%) By End User, 2022 & 2033

Recommendations

Healthcare

Veterinary Antibiotics Market

Published : July 2023

Healthcare

Veterinary Disinfectant for Pets and Farms Market

Published : January 2023

Healthcare

Veterinary Rehabilitation Services Market

Published : December 2022

Healthcare

Veterinary Services Market

Published : October 2022

Explore Healthcare Insights

View Reports

Veterinary Wound Cleansers Market