Veterinary Thermography Market Size and Share Forecast Outlook 2025 to 2035

The Veterinary Thermography Market is estimated to be valued at USD 215.0 billion in 2025 and is projected to reach USD 455.6 billion by 2035, registering a compound annual growth rate (CAGR) of 7.8% over the forecast period.
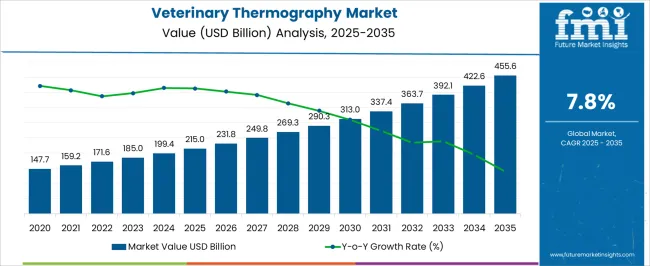
Quick Stats for Veterinary Thermography Market

  • Veterinary Thermography Market Value (2025): USD 215.0 billion
  • Veterinary Thermography Market Forecast Value (2035): USD 455.6 billion
  • Veterinary Thermography Market Forecast CAGR: 7.8%
  • Leading Segment in Veterinary Thermography Market in 2025: Long-Wavelength Thermography Cameras (41.2%)
  • Key Growth Regions in Veterinary Thermography Market: North America, Asia-Pacific, Europe
  • Top Key Players in Veterinary Thermography Market: Vetel Diagnostics, FLIR Systems, Inc., Digatherm, Meditherm, Animal Infrared Imaging, Veterinary Thermal Imaging Ltd., Thermology Diagnostics, Teletherm Infrared Systems, Vet-Therm, Infrared Cameras Inc., Thermal Imaging Services Ltd., Vet Therm, Thermo Diagnostic Imaging

Veterinary Thermography Market Market Value Analysis

Veterinary Thermography Market Key Takeaways

Metric Value
Veterinary Thermography Market Estimated Value in (2025 E) USD 215.0 billion
Veterinary Thermography Market Forecast Value in (2035 F) USD 455.6 billion
Forecast CAGR (2025 to 2035) 7.8%

Why is the Veterinary Thermography Market Growing?

The Veterinary Thermography market is experiencing robust growth, driven by the increasing adoption of non-invasive diagnostic tools in veterinary healthcare. Rising awareness of animal health monitoring, early disease detection, and preventive care is fueling the demand for thermography solutions. The market is further supported by advancements in infrared imaging technologies, higher-resolution sensors, and improved data processing capabilities, which enhance diagnostic accuracy and efficiency.

Growing adoption of long-wavelength thermography cameras enables veterinarians to capture precise thermal patterns, supporting timely interventions and reducing the risk of chronic conditions. Integration with software analytics and mobile platforms allows for real-time monitoring and remote consultation, improving accessibility and treatment outcomes. As animal healthcare providers, research institutions, and clinics prioritize accuracy, efficiency, and safety, thermography solutions are becoming a preferred choice.

The combination of non-invasive imaging, operational efficiency, and enhanced clinical decision-making is driving market expansion Investments in veterinary infrastructure and the increasing prevalence of companion animals globally are expected to sustain long-term growth.

Segmental Analysis

The veterinary thermography market is segmented by product type, application, end user, and geographic regions. By product type, veterinary thermography market is divided into Long-Wavelength Thermography Cameras, Short-Wavelength Thermography Cameras, and Mid-Wavelength Thermography Cameras. In terms of application, veterinary thermography market is classified into Veterinary Diagnosis, Inflammation, Muscle Injury, Nerve Injury, Pain Management, Preventive Medicine, Physiologic Monitoring And Animal Welfare Assessment, and Others. Based on end user, veterinary thermography market is segmented into Veterinary Clinics, Veterinary Diagnostic Center, and Research Institutes. Regionally, the veterinary thermography industry is classified into North America, Latin America, Western Europe, Eastern Europe, Balkan & Baltic Countries, Russia & Belarus, Central Asia, East Asia, South Asia & Pacific, and the Middle East & Africa.
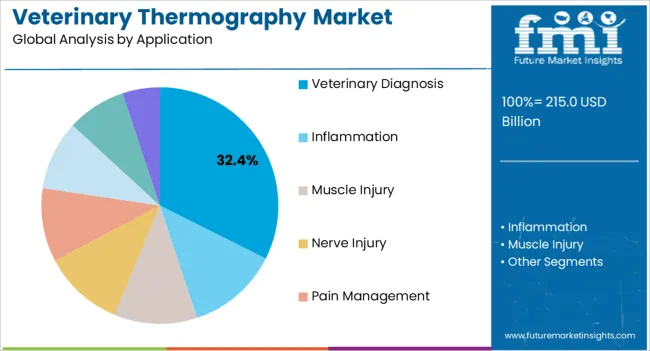
Insights into the Long-Wavelength Thermography Cameras Product Type Segment

Veterinary Thermography Market Analysis By Application

The long-wavelength thermography cameras segment is projected to hold 41.2% of the market revenue in 2025, establishing it as the leading product type. Its dominance is being driven by superior imaging capabilities that allow precise detection of subtle temperature variations, which are critical for early diagnosis of animal health issues. The ability to capture thermal patterns without physical contact ensures safety and reduces stress for animals during examinations.

Integration with analytical software enables veterinarians to detect inflammation, musculoskeletal injuries, and circulatory abnormalities with higher accuracy. Advancements in sensor technology and calibration techniques have improved reliability and consistency, reinforcing preference among veterinary professionals.

The cameras’ adaptability across multiple animal species, clinical settings, and research applications further strengthens their market leadership As demand for non-invasive diagnostic methods rises and veterinary clinics adopt advanced imaging solutions, long-wavelength thermography cameras are expected to maintain their leading position, driven by technological innovation and clinical efficacy.
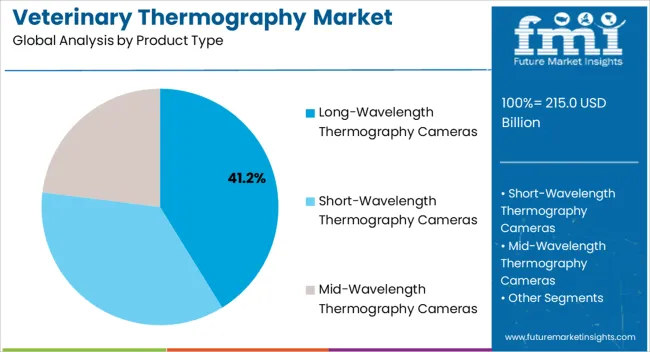
Insights into the Veterinary Diagnosis Application Segment

Veterinary Thermography Market Analysis By Product Type

The veterinary diagnosis application segment is anticipated to account for 32.4% of the market revenue in 2025, making it the leading application area. Its growth is fueled by the increasing need for accurate, non-invasive diagnostic methods in animal healthcare. Veterinary thermography enables detection of musculoskeletal injuries, inflammatory conditions, and circulatory disorders without causing discomfort or stress to animals.

High-resolution thermal imaging, combined with analytical software, provides veterinarians with actionable insights that improve treatment planning, early intervention, and recovery monitoring. The ability to integrate thermography data into electronic health records enhances clinical workflows and supports longitudinal studies. Rising adoption in research, rehabilitation, and preventive care further reinforces its market share.

The segment benefits from growing awareness among veterinarians, pet owners, and livestock managers regarding the advantages of non-invasive imaging As veterinary healthcare continues to emphasize precision, efficiency, and animal welfare, the veterinary diagnosis segment is expected to remain the primary growth driver in the market.
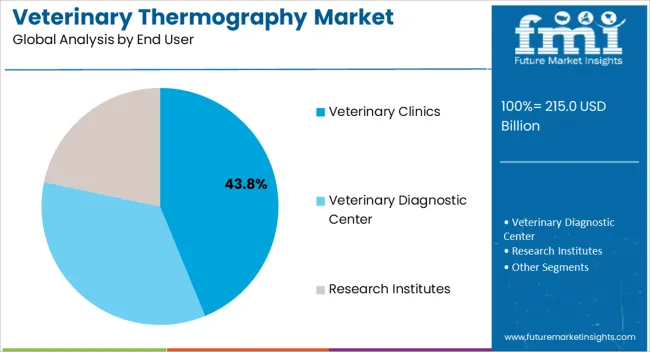
Insights into the Veterinary Clinics End-Use Segment

Veterinary Thermography Market Analysis By End User

The veterinary clinics segment is projected to hold 43.8% of the market revenue in 2025, establishing it as the leading end-use category. Growth in this segment is being driven by the rising number of veterinary facilities and the increasing integration of advanced diagnostic equipment to enhance service quality. Clinics are leveraging thermography solutions for early detection, preventive care, and ongoing monitoring of animal health, improving clinical outcomes and client satisfaction.

The non-invasive nature of thermography allows for safer and faster assessments, which is particularly valuable in busy clinical settings. Adoption is further supported by ease of use, portability, and compatibility with analytical software that enables detailed reporting and longitudinal tracking of animal health conditions.

The segment benefits from growing awareness among pet owners and livestock managers regarding the importance of timely diagnosis and treatment As veterinary clinics continue to invest in modern diagnostic technologies and prioritize efficiency and accuracy, the segment is expected to sustain its leading market position, reinforcing the overall growth of the veterinary thermography market.

Market Overview

Veterinary Thermography Market Overview

Veterinary Thermography is a remote, non-contact and non-invasive method for veterinary monitoring based on physiological imaging as a function of metabolic actions in the animal body. Infrared thermography or thermal imaging use thermographic cameras which can detect radiations in the long infrared range of electromagnetic spectrum and produce images called thermograms.

Thermograms i.e. physiological images depict temperature of an object with different color for different temperature and can be used for veterinary diagnosis. The use of thermography for monitoring of animal health is rapidly growing area due to rapid developments in the veterinary science. Veterinary thermography is increasingly gaining popularity as an equine and canine diagnostic solution as abnormal body temperature is considered as a major indicator of disease.

Thermography technique is crucial in helping diagnose inflammation or lack of blood circulation to a particular area in the animal body. Veterinary thermography can be used to detect the location of dysfunction in its early stages without sedation and touching the animal and animals are also avoided from unnecessary discomfort.
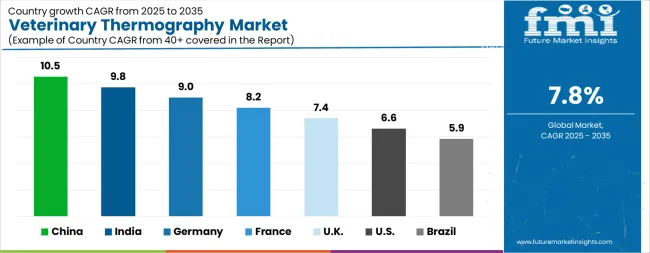
Analysis of Veterinary Thermography Market By Key Countries

Veterinary Thermography Market Cagr Analysis By Country

Country CAGR
China 10.5%
India 9.8%
Germany 9.0%
France 8.2%
UK 7.4%
USA 6.6%
Brazil 5.9%

Country-wise Analysis

The Veterinary Thermography Market is expected to register a CAGR of 7.8% during the forecast period, exhibiting varied country level momentum. China leads with the highest CAGR of 10.5%, followed by India at 9.8%. Developed markets such as Germany, France, and the UK continue to expand steadily, while the USA is likely to grow at consistent rates. Brazil posts the lowest CAGR at 5.9%, yet still underscores a broadly positive trajectory for the global Veterinary Thermography Market. In 2024, Germany held a dominant revenue in the Western Europe market and is expected to grow with a CAGR of 9.0%. The USA Veterinary Thermography Market is estimated to be valued at USD 79.2 billion in 2025 and is anticipated to reach a valuation of USD 150.6 billion by 2035. Sales are projected to rise at a CAGR of 6.6% over the forecast period between 2025 and 2035. While Japan and South Korea markets are estimated to be valued at USD 9.9 billion and USD 5.4 billion respectively in 2025.
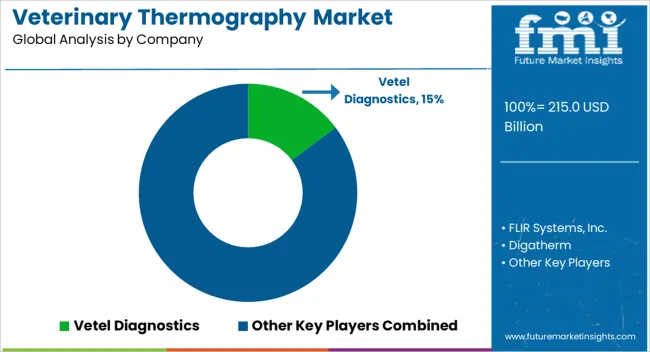
Key Players in the Veterinary Thermography Market

Veterinary Thermography Market Analysis By Company

  • Vetel Diagnostics
  • FLIR Systems, Inc.
  • Digatherm
  • Meditherm
  • Animal Infrared Imaging
  • Veterinary Thermal Imaging Ltd.
  • Thermology Diagnostics
  • Teletherm Infrared Systems
  • Vet-Therm
  • Infrared Cameras Inc.
  • Thermal Imaging Services Ltd.
  • Vet Therm
  • Thermo Diagnostic Imaging

Scope of the Report

Item Value
Quantitative Units USD 215.0 Billion
Product Type Long-Wavelength Thermography Cameras, Short-Wavelength Thermography Cameras, and Mid-Wavelength Thermography Cameras
Application Veterinary Diagnosis, Inflammation, Muscle Injury, Nerve Injury, Pain Management, Preventive Medicine, Physiologic Monitoring And Animal Welfare Assessment, and Others
End User Veterinary Clinics, Veterinary Diagnostic Center, and Research Institutes
Regions Covered North America, Europe, Asia-Pacific, Latin America, Middle East & Africa
Country Covered United States, Canada, Germany, France, United Kingdom, China, Japan, India, Brazil, South Africa
Key Companies Profiled Vetel Diagnostics, FLIR Systems, Inc., Digatherm, Meditherm, Animal Infrared Imaging, Veterinary Thermal Imaging Ltd., Thermology Diagnostics, Teletherm Infrared Systems, Vet-Therm, Infrared Cameras Inc., Thermal Imaging Services Ltd., Vet Therm, and Thermo Diagnostic Imaging

Veterinary Thermography Market by Segments

Product Type:

  • Long-Wavelength Thermography Cameras
  • Short-Wavelength Thermography Cameras
  • Mid-Wavelength Thermography Cameras

Application:

  • Veterinary Diagnosis
  • Inflammation
  • Muscle Injury
  • Nerve Injury
  • Pain Management
  • Preventive Medicine
  • Physiologic Monitoring And Animal Welfare Assessment
  • Others

End User:

  • Veterinary Clinics
  • Veterinary Diagnostic Center
  • Research Institutes

Region:

  • North America
    • USA
    • Canada
    • Mexico
  • Latin America
    • Brazil
    • Chile
    • Rest of Latin America
  • Western Europe
    • Germany
    • UK
    • Italy
    • Spain
    • France
    • Nordic
    • BENELUX
    • Rest of Western Europe
  • Eastern Europe
    • Russia
    • Poland
    • Hungary
    • Balkan & Baltic
    • Rest of Eastern Europe
  • East Asia
    • China
    • Japan
    • South Korea
  • South Asia and Pacific
    • India
    • ASEAN
    • Australia & New Zealand
    • Rest of South Asia and Pacific
  • Middle East & Africa
    • Kingdom of Saudi Arabia
    • Other GCC Countries
    • Turkiye
    • South Africa
    • Other African Union
    • Rest of Middle East & Africa

Table of Content

  1. Executive Summary
    • Global Market Outlook
    • Demand-side Trends
    • Supply-side Trends
    • Technology Roadmap Analysis
    • Analysis and Recommendations
  2. Market Overview
    • Market Coverage / Taxonomy
    • Market Definition / Scope / Limitations
  3. Market Background
    • Market Dynamics
      • Drivers
      • Restraints
      • Opportunity
      • Trends
    • Scenario Forecast
      • Demand in Optimistic Scenario
      • Demand in Likely Scenario
      • Demand in Conservative Scenario
    • Opportunity Map Analysis
    • Product Life Cycle Analysis
    • Supply Chain Analysis
    • Investment Feasibility Matrix
    • Value Chain Analysis
    • PESTLE and Porter’s Analysis
    • Regulatory Landscape
    • Regional Parent Market Outlook
    • Production and Consumption Statistics
    • Import and Export Statistics
  4. Global Market Analysis 2020 to 2024 and Forecast, 2025 to 2035
    • Historical Market Size Value (USD Million) Analysis, 2020 to 2024
    • Current and Future Market Size Value (USD Million) Projections, 2025 to 2035
      • Y-o-Y Growth Trend Analysis
      • Absolute $ Opportunity Analysis
  5. Global Market Pricing Analysis 2020 to 2024 and Forecast 2025 to 2035
  6. Global Market Analysis 2020 to 2024 and Forecast 2025 to 2035, By Product Type
    • Introduction / Key Findings
    • Historical Market Size Value (USD Million) Analysis By Product Type , 2020 to 2024
    • Current and Future Market Size Value (USD Million) Analysis and Forecast By Product Type , 2025 to 2035
      • Long-Wavelength Thermography Cameras
      • Short-Wavelength Thermography Cameras
      • Mid-Wavelength Thermography Cameras
    • Y-o-Y Growth Trend Analysis By Product Type , 2020 to 2024
    • Absolute $ Opportunity Analysis By Product Type , 2025 to 2035
  7. Global Market Analysis 2020 to 2024 and Forecast 2025 to 2035, By Application
    • Introduction / Key Findings
    • Historical Market Size Value (USD Million) Analysis By Application, 2020 to 2024
    • Current and Future Market Size Value (USD Million) Analysis and Forecast By Application, 2025 to 2035
      • Veterinary Diagnosis
      • Inflammation
      • Muscle Injury
      • Nerve Injury
      • Pain Management
      • Preventive Medicine
      • Physiologic Monitoring And Animal Welfare Assessment
      • Others
    • Y-o-Y Growth Trend Analysis By Application, 2020 to 2024
    • Absolute $ Opportunity Analysis By Application, 2025 to 2035
  8. Global Market Analysis 2020 to 2024 and Forecast 2025 to 2035, By End User
    • Introduction / Key Findings
    • Historical Market Size Value (USD Million) Analysis By End User, 2020 to 2024
    • Current and Future Market Size Value (USD Million) Analysis and Forecast By End User, 2025 to 2035
      • Veterinary Clinics
      • Veterinary Diagnostic Center
      • Research Institutes
    • Y-o-Y Growth Trend Analysis By End User, 2020 to 2024
    • Absolute $ Opportunity Analysis By End User, 2025 to 2035
  9. Global Market Analysis 2020 to 2024 and Forecast 2025 to 2035, By Region
    • Introduction
    • Historical Market Size Value (USD Million) Analysis By Region, 2020 to 2024
    • Current Market Size Value (USD Million) Analysis and Forecast By Region, 2025 to 2035
      • North America
      • Latin America
      • Western Europe
      • Eastern Europe
      • East Asia
      • South Asia and Pacific
      • Middle East & Africa
    • Market Attractiveness Analysis By Region
  10. North America Market Analysis 2020 to 2024 and Forecast 2025 to 2035, By Country
    • Historical Market Size Value (USD Million) Trend Analysis By Market Taxonomy, 2020 to 2024
    • Market Size Value (USD Million) Forecast By Market Taxonomy, 2025 to 2035
      • By Country
        • USA
        • Canada
        • Mexico
      • By Product Type
      • By Application
      • By End User
    • Market Attractiveness Analysis
      • By Country
      • By Product Type
      • By Application
      • By End User
    • Key Takeaways
  11. Latin America Market Analysis 2020 to 2024 and Forecast 2025 to 2035, By Country
    • Historical Market Size Value (USD Million) Trend Analysis By Market Taxonomy, 2020 to 2024
    • Market Size Value (USD Million) Forecast By Market Taxonomy, 2025 to 2035
      • By Country
        • Brazil
        • Chile
        • Rest of Latin America
      • By Product Type
      • By Application
      • By End User
    • Market Attractiveness Analysis
      • By Country
      • By Product Type
      • By Application
      • By End User
    • Key Takeaways
  12. Western Europe Market Analysis 2020 to 2024 and Forecast 2025 to 2035, By Country
    • Historical Market Size Value (USD Million) Trend Analysis By Market Taxonomy, 2020 to 2024
    • Market Size Value (USD Million) Forecast By Market Taxonomy, 2025 to 2035
      • By Country
        • Germany
        • UK
        • Italy
        • Spain
        • France
        • Nordic
        • BENELUX
        • Rest of Western Europe
      • By Product Type
      • By Application
      • By End User
    • Market Attractiveness Analysis
      • By Country
      • By Product Type
      • By Application
      • By End User
    • Key Takeaways
  13. Eastern Europe Market Analysis 2020 to 2024 and Forecast 2025 to 2035, By Country
    • Historical Market Size Value (USD Million) Trend Analysis By Market Taxonomy, 2020 to 2024
    • Market Size Value (USD Million) Forecast By Market Taxonomy, 2025 to 2035
      • By Country
        • Russia
        • Poland
        • Hungary
        • Balkan & Baltic
        • Rest of Eastern Europe
      • By Product Type
      • By Application
      • By End User
    • Market Attractiveness Analysis
      • By Country
      • By Product Type
      • By Application
      • By End User
    • Key Takeaways
  14. East Asia Market Analysis 2020 to 2024 and Forecast 2025 to 2035, By Country
    • Historical Market Size Value (USD Million) Trend Analysis By Market Taxonomy, 2020 to 2024
    • Market Size Value (USD Million) Forecast By Market Taxonomy, 2025 to 2035
      • By Country
        • China
        • Japan
        • South Korea
      • By Product Type
      • By Application
      • By End User
    • Market Attractiveness Analysis
      • By Country
      • By Product Type
      • By Application
      • By End User
    • Key Takeaways
  15. South Asia and Pacific Market Analysis 2020 to 2024 and Forecast 2025 to 2035, By Country
    • Historical Market Size Value (USD Million) Trend Analysis By Market Taxonomy, 2020 to 2024
    • Market Size Value (USD Million) Forecast By Market Taxonomy, 2025 to 2035
      • By Country
        • India
        • ASEAN
        • Australia & New Zealand
        • Rest of South Asia and Pacific
      • By Product Type
      • By Application
      • By End User
    • Market Attractiveness Analysis
      • By Country
      • By Product Type
      • By Application
      • By End User
    • Key Takeaways
  16. Middle East & Africa Market Analysis 2020 to 2024 and Forecast 2025 to 2035, By Country
    • Historical Market Size Value (USD Million) Trend Analysis By Market Taxonomy, 2020 to 2024
    • Market Size Value (USD Million) Forecast By Market Taxonomy, 2025 to 2035
      • By Country
        • Kingdom of Saudi Arabia
        • Other GCC Countries
        • Turkiye
        • South Africa
        • Other African Union
        • Rest of Middle East & Africa
      • By Product Type
      • By Application
      • By End User
    • Market Attractiveness Analysis
      • By Country
      • By Product Type
      • By Application
      • By End User
    • Key Takeaways
  17. Key Countries Market Analysis
    • USA
      • Pricing Analysis
      • Market Share Analysis, 2024
        • By Product Type
        • By Application
        • By End User
    • Canada
      • Pricing Analysis
      • Market Share Analysis, 2024
        • By Product Type
        • By Application
        • By End User
    • Mexico
      • Pricing Analysis
      • Market Share Analysis, 2024
        • By Product Type
        • By Application
        • By End User
    • Brazil
      • Pricing Analysis
      • Market Share Analysis, 2024
        • By Product Type
        • By Application
        • By End User
    • Chile
      • Pricing Analysis
      • Market Share Analysis, 2024
        • By Product Type
        • By Application
        • By End User
    • Germany
      • Pricing Analysis
      • Market Share Analysis, 2024
        • By Product Type
        • By Application
        • By End User
    • UK
      • Pricing Analysis
      • Market Share Analysis, 2024
        • By Product Type
        • By Application
        • By End User
    • Italy
      • Pricing Analysis
      • Market Share Analysis, 2024
        • By Product Type
        • By Application
        • By End User
    • Spain
      • Pricing Analysis
      • Market Share Analysis, 2024
        • By Product Type
        • By Application
        • By End User
    • France
      • Pricing Analysis
      • Market Share Analysis, 2024
        • By Product Type
        • By Application
        • By End User
    • India
      • Pricing Analysis
      • Market Share Analysis, 2024
        • By Product Type
        • By Application
        • By End User
    • ASEAN
      • Pricing Analysis
      • Market Share Analysis, 2024
        • By Product Type
        • By Application
        • By End User
    • Australia & New Zealand
      • Pricing Analysis
      • Market Share Analysis, 2024
        • By Product Type
        • By Application
        • By End User
    • China
      • Pricing Analysis
      • Market Share Analysis, 2024
        • By Product Type
        • By Application
        • By End User
    • Japan
      • Pricing Analysis
      • Market Share Analysis, 2024
        • By Product Type
        • By Application
        • By End User
    • South Korea
      • Pricing Analysis
      • Market Share Analysis, 2024
        • By Product Type
        • By Application
        • By End User
    • Russia
      • Pricing Analysis
      • Market Share Analysis, 2024
        • By Product Type
        • By Application
        • By End User
    • Poland
      • Pricing Analysis
      • Market Share Analysis, 2024
        • By Product Type
        • By Application
        • By End User
    • Hungary
      • Pricing Analysis
      • Market Share Analysis, 2024
        • By Product Type
        • By Application
        • By End User
    • Kingdom of Saudi Arabia
      • Pricing Analysis
      • Market Share Analysis, 2024
        • By Product Type
        • By Application
        • By End User
    • Turkiye
      • Pricing Analysis
      • Market Share Analysis, 2024
        • By Product Type
        • By Application
        • By End User
    • South Africa
      • Pricing Analysis
      • Market Share Analysis, 2024
        • By Product Type
        • By Application
        • By End User
  18. Market Structure Analysis
    • Competition Dashboard
    • Competition Benchmarking
    • Market Share Analysis of Top Players
      • By Regional
      • By Product Type
      • By Application
      • By End User
  19. Competition Analysis
    • Competition Deep Dive
      • Vetel Diagnostics
        • Overview
        • Product Portfolio
        • Profitability by Market Segments (Product/Age /Sales Channel/Region)
        • Sales Footprint
        • Strategy Overview
          • Marketing Strategy
          • Product Strategy
          • Channel Strategy
      • FLIR Systems, Inc.
      • Digatherm
      • Meditherm
      • Animal Infrared Imaging
      • Veterinary Thermal Imaging Ltd.
      • Thermology Diagnostics
      • Teletherm Infrared Systems
      • Vet-Therm
      • Infrared Cameras Inc.
      • Thermal Imaging Services Ltd.
      • Vet Therm
      • Thermo Diagnostic Imaging
  20. Assumptions & Acronyms Used
  21. Research Methodology

List of Tables

  • Table 1: Global Market Value (USD Million) Forecast by Region, 2020 to 2035
  • Table 2: Global Market Value (USD Million) Forecast by Product Type , 2020 to 2035
  • Table 3: Global Market Value (USD Million) Forecast by Application, 2020 to 2035
  • Table 4: Global Market Value (USD Million) Forecast by End User, 2020 to 2035
  • Table 5: North America Market Value (USD Million) Forecast by Country, 2020 to 2035
  • Table 6: North America Market Value (USD Million) Forecast by Product Type , 2020 to 2035
  • Table 7: North America Market Value (USD Million) Forecast by Application, 2020 to 2035
  • Table 8: North America Market Value (USD Million) Forecast by End User, 2020 to 2035
  • Table 9: Latin America Market Value (USD Million) Forecast by Country, 2020 to 2035
  • Table 10: Latin America Market Value (USD Million) Forecast by Product Type , 2020 to 2035
  • Table 11: Latin America Market Value (USD Million) Forecast by Application, 2020 to 2035
  • Table 12: Latin America Market Value (USD Million) Forecast by End User, 2020 to 2035
  • Table 13: Western Europe Market Value (USD Million) Forecast by Country, 2020 to 2035
  • Table 14: Western Europe Market Value (USD Million) Forecast by Product Type , 2020 to 2035
  • Table 15: Western Europe Market Value (USD Million) Forecast by Application, 2020 to 2035
  • Table 16: Western Europe Market Value (USD Million) Forecast by End User, 2020 to 2035
  • Table 17: Eastern Europe Market Value (USD Million) Forecast by Country, 2020 to 2035
  • Table 18: Eastern Europe Market Value (USD Million) Forecast by Product Type , 2020 to 2035
  • Table 19: Eastern Europe Market Value (USD Million) Forecast by Application, 2020 to 2035
  • Table 20: Eastern Europe Market Value (USD Million) Forecast by End User, 2020 to 2035
  • Table 21: East Asia Market Value (USD Million) Forecast by Country, 2020 to 2035
  • Table 22: East Asia Market Value (USD Million) Forecast by Product Type , 2020 to 2035
  • Table 23: East Asia Market Value (USD Million) Forecast by Application, 2020 to 2035
  • Table 24: East Asia Market Value (USD Million) Forecast by End User, 2020 to 2035
  • Table 25: South Asia and Pacific Market Value (USD Million) Forecast by Country, 2020 to 2035
  • Table 26: South Asia and Pacific Market Value (USD Million) Forecast by Product Type , 2020 to 2035
  • Table 27: South Asia and Pacific Market Value (USD Million) Forecast by Application, 2020 to 2035
  • Table 28: South Asia and Pacific Market Value (USD Million) Forecast by End User, 2020 to 2035
  • Table 29: Middle East & Africa Market Value (USD Million) Forecast by Country, 2020 to 2035
  • Table 30: Middle East & Africa Market Value (USD Million) Forecast by Product Type , 2020 to 2035
  • Table 31: Middle East & Africa Market Value (USD Million) Forecast by Application, 2020 to 2035
  • Table 32: Middle East & Africa Market Value (USD Million) Forecast by End User, 2020 to 2035

List of Figures

  • Figure 1: Global Market Pricing Analysis
  • Figure 2: Global Market Value (USD Million) Forecast 2020-2035
  • Figure 3: Global Market Value Share and BPS Analysis by Product Type , 2025 and 2035
  • Figure 4: Global Market Y-o-Y Growth Comparison by Product Type , 2025-2035
  • Figure 5: Global Market Attractiveness Analysis by Product Type
  • Figure 6: Global Market Value Share and BPS Analysis by Application, 2025 and 2035
  • Figure 7: Global Market Y-o-Y Growth Comparison by Application, 2025-2035
  • Figure 8: Global Market Attractiveness Analysis by Application
  • Figure 9: Global Market Value Share and BPS Analysis by End User, 2025 and 2035
  • Figure 10: Global Market Y-o-Y Growth Comparison by End User, 2025-2035
  • Figure 11: Global Market Attractiveness Analysis by End User
  • Figure 12: Global Market Value (USD Million) Share and BPS Analysis by Region, 2025 and 2035
  • Figure 13: Global Market Y-o-Y Growth Comparison by Region, 2025-2035
  • Figure 14: Global Market Attractiveness Analysis by Region
  • Figure 15: North America Market Incremental Dollar Opportunity, 2025-2035
  • Figure 16: Latin America Market Incremental Dollar Opportunity, 2025-2035
  • Figure 17: Western Europe Market Incremental Dollar Opportunity, 2025-2035
  • Figure 18: Eastern Europe Market Incremental Dollar Opportunity, 2025-2035
  • Figure 19: East Asia Market Incremental Dollar Opportunity, 2025-2035
  • Figure 20: South Asia and Pacific Market Incremental Dollar Opportunity, 2025-2035
  • Figure 21: Middle East & Africa Market Incremental Dollar Opportunity, 2025-2035
  • Figure 22: North America Market Value Share and BPS Analysis by Country, 2025 and 2035
  • Figure 23: North America Market Value Share and BPS Analysis by Product Type , 2025 and 2035
  • Figure 24: North America Market Y-o-Y Growth Comparison by Product Type , 2025-2035
  • Figure 25: North America Market Attractiveness Analysis by Product Type
  • Figure 26: North America Market Value Share and BPS Analysis by Application, 2025 and 2035
  • Figure 27: North America Market Y-o-Y Growth Comparison by Application, 2025-2035
  • Figure 28: North America Market Attractiveness Analysis by Application
  • Figure 29: North America Market Value Share and BPS Analysis by End User, 2025 and 2035
  • Figure 30: North America Market Y-o-Y Growth Comparison by End User, 2025-2035
  • Figure 31: North America Market Attractiveness Analysis by End User
  • Figure 32: Latin America Market Value Share and BPS Analysis by Country, 2025 and 2035
  • Figure 33: Latin America Market Value Share and BPS Analysis by Product Type , 2025 and 2035
  • Figure 34: Latin America Market Y-o-Y Growth Comparison by Product Type , 2025-2035
  • Figure 35: Latin America Market Attractiveness Analysis by Product Type
  • Figure 36: Latin America Market Value Share and BPS Analysis by Application, 2025 and 2035
  • Figure 37: Latin America Market Y-o-Y Growth Comparison by Application, 2025-2035
  • Figure 38: Latin America Market Attractiveness Analysis by Application
  • Figure 39: Latin America Market Value Share and BPS Analysis by End User, 2025 and 2035
  • Figure 40: Latin America Market Y-o-Y Growth Comparison by End User, 2025-2035
  • Figure 41: Latin America Market Attractiveness Analysis by End User
  • Figure 42: Western Europe Market Value Share and BPS Analysis by Country, 2025 and 2035
  • Figure 43: Western Europe Market Value Share and BPS Analysis by Product Type , 2025 and 2035
  • Figure 44: Western Europe Market Y-o-Y Growth Comparison by Product Type , 2025-2035
  • Figure 45: Western Europe Market Attractiveness Analysis by Product Type
  • Figure 46: Western Europe Market Value Share and BPS Analysis by Application, 2025 and 2035
  • Figure 47: Western Europe Market Y-o-Y Growth Comparison by Application, 2025-2035
  • Figure 48: Western Europe Market Attractiveness Analysis by Application
  • Figure 49: Western Europe Market Value Share and BPS Analysis by End User, 2025 and 2035
  • Figure 50: Western Europe Market Y-o-Y Growth Comparison by End User, 2025-2035
  • Figure 51: Western Europe Market Attractiveness Analysis by End User
  • Figure 52: Eastern Europe Market Value Share and BPS Analysis by Country, 2025 and 2035
  • Figure 53: Eastern Europe Market Value Share and BPS Analysis by Product Type , 2025 and 2035
  • Figure 54: Eastern Europe Market Y-o-Y Growth Comparison by Product Type , 2025-2035
  • Figure 55: Eastern Europe Market Attractiveness Analysis by Product Type
  • Figure 56: Eastern Europe Market Value Share and BPS Analysis by Application, 2025 and 2035
  • Figure 57: Eastern Europe Market Y-o-Y Growth Comparison by Application, 2025-2035
  • Figure 58: Eastern Europe Market Attractiveness Analysis by Application
  • Figure 59: Eastern Europe Market Value Share and BPS Analysis by End User, 2025 and 2035
  • Figure 60: Eastern Europe Market Y-o-Y Growth Comparison by End User, 2025-2035
  • Figure 61: Eastern Europe Market Attractiveness Analysis by End User
  • Figure 62: East Asia Market Value Share and BPS Analysis by Country, 2025 and 2035
  • Figure 63: East Asia Market Value Share and BPS Analysis by Product Type , 2025 and 2035
  • Figure 64: East Asia Market Y-o-Y Growth Comparison by Product Type , 2025-2035
  • Figure 65: East Asia Market Attractiveness Analysis by Product Type
  • Figure 66: East Asia Market Value Share and BPS Analysis by Application, 2025 and 2035
  • Figure 67: East Asia Market Y-o-Y Growth Comparison by Application, 2025-2035
  • Figure 68: East Asia Market Attractiveness Analysis by Application
  • Figure 69: East Asia Market Value Share and BPS Analysis by End User, 2025 and 2035
  • Figure 70: East Asia Market Y-o-Y Growth Comparison by End User, 2025-2035
  • Figure 71: East Asia Market Attractiveness Analysis by End User
  • Figure 72: South Asia and Pacific Market Value Share and BPS Analysis by Country, 2025 and 2035
  • Figure 73: South Asia and Pacific Market Value Share and BPS Analysis by Product Type , 2025 and 2035
  • Figure 74: South Asia and Pacific Market Y-o-Y Growth Comparison by Product Type , 2025-2035
  • Figure 75: South Asia and Pacific Market Attractiveness Analysis by Product Type
  • Figure 76: South Asia and Pacific Market Value Share and BPS Analysis by Application, 2025 and 2035
  • Figure 77: South Asia and Pacific Market Y-o-Y Growth Comparison by Application, 2025-2035
  • Figure 78: South Asia and Pacific Market Attractiveness Analysis by Application
  • Figure 79: South Asia and Pacific Market Value Share and BPS Analysis by End User, 2025 and 2035
  • Figure 80: South Asia and Pacific Market Y-o-Y Growth Comparison by End User, 2025-2035
  • Figure 81: South Asia and Pacific Market Attractiveness Analysis by End User
  • Figure 82: Middle East & Africa Market Value Share and BPS Analysis by Country, 2025 and 2035
  • Figure 83: Middle East & Africa Market Value Share and BPS Analysis by Product Type , 2025 and 2035
  • Figure 84: Middle East & Africa Market Y-o-Y Growth Comparison by Product Type , 2025-2035
  • Figure 85: Middle East & Africa Market Attractiveness Analysis by Product Type
  • Figure 86: Middle East & Africa Market Value Share and BPS Analysis by Application, 2025 and 2035
  • Figure 87: Middle East & Africa Market Y-o-Y Growth Comparison by Application, 2025-2035
  • Figure 88: Middle East & Africa Market Attractiveness Analysis by Application
  • Figure 89: Middle East & Africa Market Value Share and BPS Analysis by End User, 2025 and 2035
  • Figure 90: Middle East & Africa Market Y-o-Y Growth Comparison by End User, 2025-2035
  • Figure 91: Middle East & Africa Market Attractiveness Analysis by End User
  • Figure 92: Global Market - Tier Structure Analysis
  • Figure 93: Global Market - Company Share Analysis

Frequently Asked Questions

How big is the veterinary thermography market in 2025?

The global veterinary thermography market is estimated to be valued at USD 215.0 billion in 2025.

What will be the size of veterinary thermography market in 2035?

The market size for the veterinary thermography market is projected to reach USD 455.6 billion by 2035.

How much will be the veterinary thermography market growth between 2025 and 2035?

The veterinary thermography market is expected to grow at a 7.8% CAGR between 2025 and 2035.

What are the key product types in the veterinary thermography market?

The key product types in veterinary thermography market are long-wavelength thermography cameras, short-wavelength thermography cameras and mid-wavelength thermography cameras.

Which application segment to contribute significant share in the veterinary thermography market in 2025?

In terms of application, veterinary diagnosis segment to command 32.4% share in the veterinary thermography market in 2025.

Explore Similar Insights

Future Market Insights

Veterinary Thermography Market

Chat With MaRIA

Chat With

MaRIA

Hi There, I am MaRIA, Your Market Research Intelligence Assistant. How may I help you?