Reports

- Global Locations -

Headquarters

Future Market Insights, Inc.

Christiana Corporate, 200
Continental Drive, Suite 401,
Newark, Delaware - 19713,
United States

T: +1-845-579-5705

Americas

Future Market Insights, Inc.

616 Corporate Way, Suite 2-9018,
Valley Cottage, NY 10989, United States

T: +1-347-918-3531

MEA

Future Market Insights

1602-6 Jumeirah Bay X2 Tower, Plot No: JLT-PH2-X2A,
Jumeirah Lakes Towers, Dubai,
United Arab Emirates

Europe

Future Market Insights

3rd Floor, 207 Regent Street,
W1B 3HH London
United Kingdom

T: + 44 (0) 20 8123 9659
D: +44 (0) 20 3287 4268

Asia Pacific

Future Market Insights

IndiaLand Global Tech Park, Unit UG-1, Behind Grand HighStreet, Phase 1, Hinjawadi, MH, Pune – 411057, India

Veterinary Lasers Market Outlook (2023 to 2033)

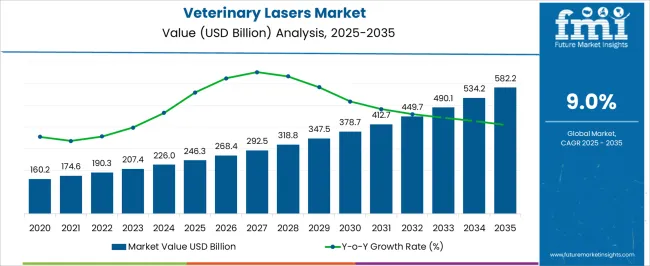
In 2023, the veterinary lasers market had a value of US$ 205.8 million; by 2033, it is anticipated to have grown to US$ 505.4 million. From 2023 to 2033, the veterinary lasers business is expected to grow at a CAGR of 9.4%.

Future Market Insights foresees a comparison and review analysis of the dynamics of the veterinary lasers industry, primarily influenced by some industry aspects and a few distinct influences on therapeutic views that promote industry innovation.

A few recent developments in the industry are the growth of veterinary informatics, which includes the dissemination and application of veterinary medical electronic health records, and improvements in digital imaging and communications in veterinary medicine.

The slow market adoption during the first half of the forecast period is mainly attributable to the emerging use of Natural Language Processing (NLP) and machine learning in biomedical informatics, which has an impact on the advancements in veterinary informatics and translational research, as well as the developments in zoonotic disease surveillance and reporting systems. These factors together account for the change in growth rate.

Despite these opportunities, the industry is still likely to face some obstacles, such as the absence of structural guidelines in veterinary medical practices and formal, structured support for intensive training in informatics and methods development from national veterinary organizations.

Attributes Details
Veterinary Lasers Market CAGR (2023 to 2033) 9.4%
Veterinary Lasers Market HCAGR (2018 to 2022) 8.9%
Veterinary Lasers Market Size - 2023 US$ 205.8 million
Veterinary Lasers Market Size - 2033 US$ 505.4 million

Don't pay for what you don't need

Customize your report by selecting specific countries or regions and save 30%!

Historical Comparison for the Veterinary Lasers Market between 2018 to 2022 and 2023 to 2033

Due to the rising need for therapeutic lasers in line with the development of laser technologies, the global market has grown. With more clinical applications, veterinary practices are adopting therapeutic lasers more and more.

Laser medicine has grown in popularity in conjunction with pharmacological therapy in recent years. Veterinarian lasers are great for lowering musculoskeletal discomfort, post-operative pain, inflammation, and wound healing, among other things. Photobiomodulation therapy has grown significantly in popularity due to the widespread acceptance of these non-invasive treatments in veterinary medicine for treating companion animals as opposed to farm animals.

In 2023, the global market may account for just under 0.4% of the $45.4 billion animal health market. Due to its inherent benefits, laser treatment is becoming more and more popular. For instance, new research in veterinary medicine suggests that utilizing laser therapy to treat wounds may speed up the healing process.

Due to an increase in the number of laser-assisted procedures performed in clinical settings, the veterinary lasers market is expected to experience substantial growth between 2023 and 2033.

The market is projected to increase significantly over the following six years at a CAGR of almost 9.4%, with an additional potential of US$ 145.7 million from 2023 to 2033. Throughout the projection period, demand for therapeutic lasers may remain at its highest level.

Exploring the Potential Market Opportunities for Veterinary Lasers

With increased public awareness of emerging technologies, laser surgical technology is widely acknowledged to improve clinical results, provide a more straightforward, convenient process, and have a generally cheap treatment cost. All of these elements are causing the veterinary lasers market to expand.

There has been ongoing development of new items and expansion of their product line to fulfill the rising demand.

For instance, the USA Food and Drug Administration (FDA) approved the Erchonia Corporation's FX 635 low-level laser for marketing in July 2019 to treat all-over musculoskeletal pain.

Sabyasachi Ghosh
Sabyasachi Ghosh

Principal Consultant

Talk to Analyst

Find your sweet spots for generating winning opportunities in this market.

What Obstacles Must the Veterinary Lasers Market Overcome to Thrive?

Numerous significant obstacles to the veterinary lasers industry prevent it from expanding and developing. Along with exclusionary clauses in private health insurance plans, there is a significant lack of insurance coverage for veterinary care in many nations. This lack of funding restricts pet owners' access to veterinary laser treatments, which has an effect on market growth.

The veterinary lasers industry is lacking in highly qualified specialists and professionals. The widespread use and efficient use of veterinary lasers are constrained by the lack of qualified staff, which limits the market's potential for growth.

A big barrier is the insufficient infrastructure for veterinary healthcare in developing countries. These areas frequently lack the essential veterinary laser support infrastructure as well as basic animal health care facilities. This discrepancy hinders market growth and restricts the application of veterinary laser technology in underserved regions.

In general, overcoming these obstacles through legislative changes, educational and training initiatives, and enhanced healthcare infrastructure may be essential for promoting the market expansion and wide acceptance of veterinary lasers.

Comparative View of Adjacent Veterinary Lasers Industry

Veterinary Lasers Market:

Attributes Veterinary Lasers Market
CAGR (From 2023 to 2033) 9.4%
Market Value (2023) US$ 205.8 million
Growth Factor Rising demand for non-invasive treatment options drives the market growth for veterinary lasers.
Opportunity Advancements in laser technology revolutionize surgical procedures in veterinary medicine.
Key Trends Growing awareness about the benefits of laser therapy boosts the adoption of veterinary lasers.

Laser Technology Market:

Attributes Laser Technology Market
CAGR (From 2023 to 2033) 7.8%
Market Value (2023) US$ 19.21 billion
Growth Factor Increasing integration of lasers in industrial manufacturing processes surge the market growth.
Opportunity Rapid advancements in laser technology pave the way for new applications in healthcare, aerospace, and defense sectors.
Key Trends Growing demand for laser-based materials processing and 3D printing fuels the market expansion.

Aesthetic Lasers Market:

Attributes Aesthetic Lasers Market
CAGR (From 2023 to 2033) 16.6%
Market Value (2023) US$ 1318.09 million
Growth Factor Rising demand for minimally invasive cosmetic procedures propels the market growth.
Opportunity Technological advancements in laser-based skin rejuvenation and hair removal drive market expansion.
Key Trends Increasing adoption of aesthetic lasers in medical spas and dermatology clinics contributes to market growth.

Get the data you need at a Fraction of the cost

Personalize your report by choosing insights you need
and save 40%!

Country - Wise Insights

North America Outlook:

Attributes Details
North America Market Share - 2023 28.2%
United States Market Share - 2023 19.6%

May the United States Remain a Key Veterinary Laser Industry?

The United States the leading country of the North American region with a significant market share in 2023 and projected to continue commanding the high growth during the coming years from 2023 to 2033 in veterinary lasers market. The growing populace of pets mainly drives the market growth and their humanization and increasing pets disorder owing to rise in disease incidence.

  • For instance, as per American Pet Products Association noted that as of 2016, 70 million to 80 million dogs (approximately 37% to 47% of all households) and 74 million to 96 million cats (30% to 37% of all households) were owned in the USA.

Asia Pacific Outlook:

Attributes Details
Japan Market Share (2023) 8.4%
India Market CAGR (2023 to 2023) 8.3%
China Market CAGR (2023 to 2023) 8.5%

Why is Japan an Emerging Veterinary lasers market?

Japan holds over 8.4% share in the global market in the year 2023, and projected to expand at a CAGR of 8.5%. The rising number of chronic wound surgeries in the country leads to enhance the demand of veterinary lasers.

What is the Outlook in China for the Veterinary Lasers?

In 2023, China is expected to hold considerable share in the Global veterinary lasers industry with more than 9.3% share and is projected to expand at a CAGR of 8.5% from 2023 to 2033. This is predominantly due to the rising number of pet hospitals, for instance, as per the recent estimates, currently, there are 12,000 pet hospitals in China and more than 10% are chains from established brands.

The increasing populace of pet per households along with growing awareness for pet health among pet owners to enhance the veterinary lasers market by 2033.

Europe Outlook:

Attributes Details
France Market Share (2023) 23.7%
France Market CAGR (2023 to 2023) 10.4%
United Kingdom Market CAGR (2023 to 2023) 9.7%

Which are the Most Lucrative Market within Europe?

France and United Kingdom to remain the most lucrative countries in veterinary lasers market, expected to grow with a CAGR of 10.4% and 9.7% respectively throughout the forecast period. This is due to high adoption of companion animal’s per-house across these countries. The per-capita veterinary spending is for United Kingdom was around US$ 93 in 2019 and while France was around US$ 87. This has resulted in a significant shift towards pets visits in healthcare settings for pain management and chronic wound healing.

With significant demand from healthcare settings on usage of veterinary lasers may pave ways for more opportunity during the forecast period.

Category - Wise Insights

Product Outlook

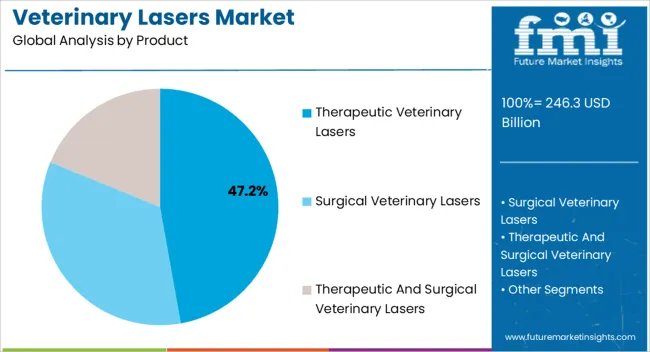
Segment Therapeutic And Surgical Lasers
Segment Share 43.17%

Which Veterinary Lasers Product is driving the market growth?

By product, the therapeutic and surgical lasers is expected to expand at a CAGR of 9.5% during the forecast period from 2023 to 2033.

With the success of laser therapy among humans, there has been a significant inclination of veterinarians towards usage of therapeutic and surgical lasers for rehabilitation purposes as well as for comfortable procedures. These lasers have a unique ability to vaporize or expunge the tissue and are also utilized to make incisions, as well as to erase unhealthy tissue.

Not only does the laser kill any bacteria during the procedure, but it also seals the lymphatics, hence reports a much less swelling post-operatively. This enables the pet to resume its normal activities sooner.

Owing to the technological benefits of the laser therapy, the veterinary lasers market is experiencing its faster adoption and hence the growth is reflected. Therefore it’s driving the demand for veterinary lasers during the forecast period from 2023 to 2033.

Laser Type Outlook

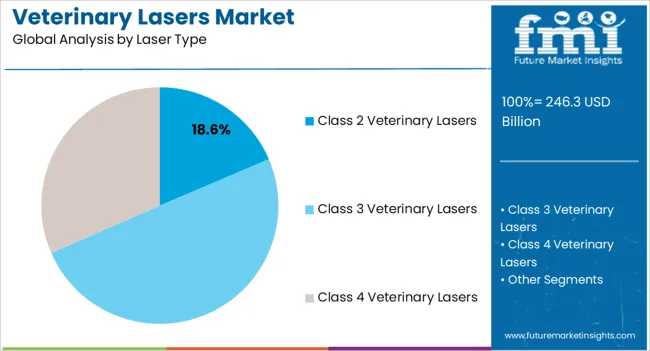
Segment Class 3 Type Laser
Segment Share 45.64%

Why does the Class 3 type laser hold a High Market Share?

The Class 3 type laser dominated the veterinary lasers market in laser type segment, contributing an around 45.64%of the revenue share in 2023. This trend is expected to continue to grow during the study period. The high share of this segment is attributed to its inherited safety and increased usage in pet surgeries and related treatment as compared to other devices.

End User Outlook

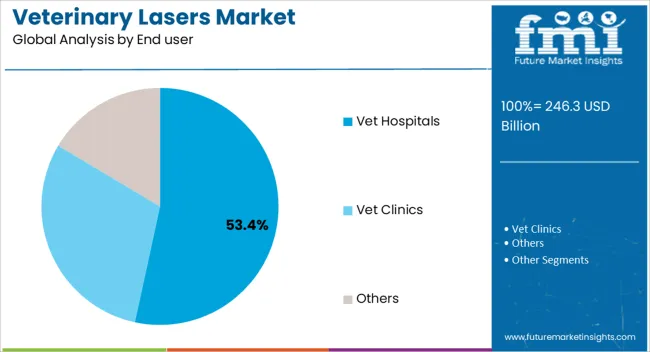
Segment Veterinary Hospitals
Segment Share 40.9%

Which End User is leading the Global Veterinary Lasers Business?

Based on the end user, Veterinary hospitals remains the leading segment, with more than 40.9% market share in 2023. Growing number of pet visits for surgical treatments in these hospitals may provide lucrative opportunities for market growth for veterinary lasers.
How can Manufacturers Scale their Businesses in the Veterinary Lasers Business?

  • Develop a comprehensive marketing strategy to reach veterinarians and highlight the benefits of veterinary laser technology.
  • Expand distribution channels and partnerships to reach a wider customer base.
  • Continuously invest in research and development to enhance product offerings and stay ahead of competitors.
  • Provide excellent customer support and training programs to build strong relationships with veterinary professionals.
  • Explore international markets and adapt products to meet the specific needs and regulations of different regions.

Competitive Landscape

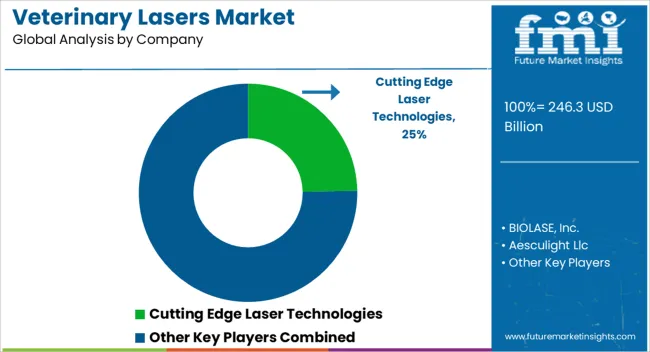
Technological advancements and increasing development of new product lines to provide cost effective devices are the key strategies adopted by manufacturers and integrators for technology transfer and to increase consumer base in different geographies.

Key players are focusing on expansion of their brands and technology in emerging regions by strategic partnerships, and collaborations by key manufacturers to strengthen their market presence.

Key Players

  • Cutting Edge Laser Technologies
  • BIOLASE, Inc.
  • Aesculight Llc
  • LiteCure LLC
  • ERCHONIA CORPORATION
  • Laserex Technologies Pty Ltd
  • Respond Systems, Inc.
  • Technological Medical Advancements, Inc.
  • Pivotal Health Solutions

Novel Breakthroughs and Advancements:

Company Cutting Edge Laser technologies
Strategy Cutting Edge Laser Technologies Forms Partnership with Patterson Veterinary for Laser Distribution
Details In Oct 2017, Cutting Edge Laser technologies entered into a strategic partnership with Patterson Veterinary. Patterson Veterinary may distribute multiwave locked system (MLS) therapy lasers and surgical lasers nationwide
Company LiteCure
Strategy Laser Therapy Powerhouse: LiteCure Teams Up with FYZICAL to Expand Reach
Details In May 2017, LiteCure owned LightForce Therapy Lasers, expanded therapeutic reach by partnering with physical therapy franchise, FYZICAL, as exclusive laser therapy partner to bring their unique rehabilitative and revenue solutions to physical therapists across the country

Key Segments

By Product:

  • Therapeutic Veterinary Lasers
  • Surgical Veterinary Lasers
  • Therapeutic And Surgical Veterinary Lasers

By Laser Type:

  • Class 2 Veterinary Lasers
  • Class 3 Veterinary Lasers
  • Class 4 Veterinary Lasers

By End user:

  • Vet Hospitals
  • Vet Clinics
  • Others

By Region:

  • North America
  • Western Europe
  • Latin America
  • Eastern Europe
  • APECJ
  • China
  • Japan

Frequently Asked Questions

Which End User is Creating a Stage for Expansion?

The veterinary hospitals segment holds high revenue potential.

Which Countries Dominate the Global Market?

Japan, the United States and China are estimated to dominate the global market.

What is the Growth Forecast for Veterinary Lasers Market?

The market is forecast to register a CAGR of 9.4% through 2033.

How is the Historical Performance of the Market?

During 2018 to 2022, the market registered a CAGR of 8.9%.

Which is the Top Trend in the Vertinary Lasers Market?

The growing awareness towards laser therapy is the current market trends.

Table of Content

1. Executive Summary

    1.1. Global Market Outlook

    1.2. Demand-side Trends

    1.3. Supply-side Trends

    1.4. Technology Roadmap Analysis

    1.5. Analysis and Recommendations

2. Market Overview

    2.1. Market Coverage / Taxonomy

    2.2. Market Definition / Scope / Limitations

3. Market Background

    3.1. Market Dynamics

        3.1.1. Drivers

        3.1.2. Restraints

        3.1.3. Opportunity

        3.1.4. Trends

    3.2. Scenario Forecast

        3.2.1. Demand in Optimistic Scenario

        3.2.2. Demand in Likely Scenario

        3.2.3. Demand in Conservative Scenario

    3.3. Opportunity Map Analysis

    3.4. Product Life Cycle Analysis

    3.5. Supply Chain Analysis

        3.5.1. Supply Side Participants and their Roles

            3.5.1.1. Producers

            3.5.1.2. Mid-Level Participants (Traders/ Agents/ Brokers)

            3.5.1.3. Wholesalers and Distributors

        3.5.2. Value Added and Value Created at Node in the Supply Chain

        3.5.3. List of Raw Material Suppliers

        3.5.4. List of Existing and Potential Buyer’s

    3.6. Investment Feasibility Matrix

    3.7. Value Chain Analysis

        3.7.1. Profit Margin Analysis

        3.7.2. Wholesalers and Distributors

        3.7.3. Retailers

    3.8. PESTLE and Porter’s Analysis

    3.9. Regulatory Landscape

        3.9.1. By Key Regions

        3.9.2. By Key Countries

    3.10. Regional Parent Market Outlook

    3.11. Production and Consumption Statistics

    3.12. Import and Export Statistics

4. Global Market Analysis 2018 to 2022 and Forecast, 2023 to 2033

    4.1. Historical Market Size Value (US$ Million) & Volume (Units) Analysis, 2018 to 2022

    4.2. Current and Future Market Size Value (US$ Million) & Volume (Units) Projections, 2023 to 2033

        4.2.1. Y-o-Y Growth Trend Analysis

        4.2.2. Absolute $ Opportunity Analysis

5. Global Market Analysis 2018 to 2022 and Forecast 2023 to 2033, By Product

    5.1. Introduction / Key Findings

    5.2. Historical Market Size Value (US$ Million) & Volume (Units) Analysis By Product, 2018 to 2022

    5.3. Current and Future Market Size Value (US$ Million) & Volume (Units) Analysis and Forecast By Product, 2023 to 2033

        5.3.1. Therapeutic

        5.3.2. Surgical

        5.3.3. Therapeutic And Surgical

    5.4. Y-o-Y Growth Trend Analysis By Product, 2018 to 2022

    5.5. Absolute $ Opportunity Analysis By Product, 2023 to 2033

6. Global Market Analysis 2018 to 2022 and Forecast 2023 to 2033, By Laser Type

    6.1. Introduction / Key Findings

    6.2. Historical Market Size Value (US$ Million) & Volume (Units) Analysis By Laser Type, 2018 to 2022

    6.3. Current and Future Market Size Value (US$ Million) & Volume (Units) Analysis and Forecast By Laser Type, 2023 to 2033

        6.3.1. Class 2

        6.3.2. Class 3

        6.3.3. Class 4

    6.4. Y-o-Y Growth Trend Analysis By Laser Type, 2018 to 2022

    6.5. Absolute $ Opportunity Analysis By Laser Type, 2023 to 2033

7. Global Market Analysis 2018 to 2022 and Forecast 2023 to 2033, By End user

    7.1. Introduction / Key Findings

    7.2. Historical Market Size Value (US$ Million) & Volume (Units) Analysis By End user, 2018 to 2022

    7.3. Current and Future Market Size Value (US$ Million) & Volume (Units) Analysis and Forecast By End user, 2023 to 2033

        7.3.1. Vet Hospitals

        7.3.2. Vet Clinics

        7.3.3. Others

    7.4. Y-o-Y Growth Trend Analysis By End user, 2018 to 2022

    7.5. Absolute $ Opportunity Analysis By End user, 2023 to 2033

8. Global Market Analysis 2018 to 2022 and Forecast 2023 to 2033, By Region

    8.1. Introduction

    8.2. Historical Market Size Value (US$ Million) & Volume (Units) Analysis By Region, 2018 to 2022

    8.3. Current Market Size Value (US$ Million) & Volume (Units) Analysis and Forecast By Region, 2023 to 2033

        8.3.1. North America

        8.3.2. Latin America

        8.3.3. Europe

        8.3.4. South Asia

        8.3.5. East Asia

        8.3.6. Oceania

        8.3.7. MEA

    8.4. Market Attractiveness Analysis By Region

9. North America Market Analysis 2018 to 2022 and Forecast 2023 to 2033, By Country

    9.1. Historical Market Size Value (US$ Million) & Volume (Units) Trend Analysis By Market Taxonomy, 2018 to 2022

    9.2. Market Size Value (US$ Million) & Volume (Units) Forecast By Market Taxonomy, 2023 to 2033

        9.2.1. By Country

            9.2.1.1. The USA

            9.2.1.2. Canada

        9.2.2. By Product

        9.2.3. By Laser Type

        9.2.4. By End user

    9.3. Market Attractiveness Analysis

        9.3.1. By Country

        9.3.2. By Product

        9.3.3. By Laser Type

        9.3.4. By End user

    9.4. Key Takeaways

10. Latin America Market Analysis 2018 to 2022 and Forecast 2023 to 2033, By Country

    10.1. Historical Market Size Value (US$ Million) & Volume (Units) Trend Analysis By Market Taxonomy, 2018 to 2022

    10.2. Market Size Value (US$ Million) & Volume (Units) Forecast By Market Taxonomy, 2023 to 2033

        10.2.1. By Country

            10.2.1.1. Brazil

            10.2.1.2. Mexico

            10.2.1.3. Rest of Latin America

        10.2.2. By Product

        10.2.3. By Laser Type

        10.2.4. By End user

    10.3. Market Attractiveness Analysis

        10.3.1. By Country

        10.3.2. By Product

        10.3.3. By Laser Type

        10.3.4. By End user

    10.4. Key Takeaways

11. Europe Market Analysis 2018 to 2022 and Forecast 2023 to 2033, By Country

    11.1. Historical Market Size Value (US$ Million) & Volume (Units) Trend Analysis By Market Taxonomy, 2018 to 2022

    11.2. Market Size Value (US$ Million) & Volume (Units) Forecast By Market Taxonomy, 2023 to 2033

        11.2.1. By Country

            11.2.1.1. Germany

            11.2.1.2. United Kingdom

            11.2.1.3. France

            11.2.1.4. Spain

            11.2.1.5. Italy

            11.2.1.6. Rest of Europe

        11.2.2. By Product

        11.2.3. By Laser Type

        11.2.4. By End user

    11.3. Market Attractiveness Analysis

        11.3.1. By Country

        11.3.2. By Product

        11.3.3. By Laser Type

        11.3.4. By End user

    11.4. Key Takeaways

12. South Asia Market Analysis 2018 to 2022 and Forecast 2023 to 2033, By Country

    12.1. Historical Market Size Value (US$ Million) & Volume (Units) Trend Analysis By Market Taxonomy, 2018 to 2022

    12.2. Market Size Value (US$ Million) & Volume (Units) Forecast By Market Taxonomy, 2023 to 2033

        12.2.1. By Country

            12.2.1.1. India

            12.2.1.2. Malaysia

            12.2.1.3. Singapore

            12.2.1.4. Thailand

            12.2.1.5. Rest of South Asia

        12.2.2. By Product

        12.2.3. By Laser Type

        12.2.4. By End user

    12.3. Market Attractiveness Analysis

        12.3.1. By Country

        12.3.2. By Product

        12.3.3. By Laser Type

        12.3.4. By End user

    12.4. Key Takeaways

13. East Asia Market Analysis 2018 to 2022 and Forecast 2023 to 2033, By Country

    13.1. Historical Market Size Value (US$ Million) & Volume (Units) Trend Analysis By Market Taxonomy, 2018 to 2022

    13.2. Market Size Value (US$ Million) & Volume (Units) Forecast By Market Taxonomy, 2023 to 2033

        13.2.1. By Country

            13.2.1.1. China

            13.2.1.2. Japan

            13.2.1.3. South Korea

        13.2.2. By Product

        13.2.3. By Laser Type

        13.2.4. By End user

    13.3. Market Attractiveness Analysis

        13.3.1. By Country

        13.3.2. By Product

        13.3.3. By Laser Type

        13.3.4. By End user

    13.4. Key Takeaways

14. Oceania Market Analysis 2018 to 2022 and Forecast 2023 to 2033, By Country

    14.1. Historical Market Size Value (US$ Million) & Volume (Units) Trend Analysis By Market Taxonomy, 2018 to 2022

    14.2. Market Size Value (US$ Million) & Volume (Units) Forecast By Market Taxonomy, 2023 to 2033

        14.2.1. By Country

            14.2.1.1. Australia

            14.2.1.2. New Zealand

        14.2.2. By Product

        14.2.3. By Laser Type

        14.2.4. By End user

    14.3. Market Attractiveness Analysis

        14.3.1. By Country

        14.3.2. By Product

        14.3.3. By Laser Type

        14.3.4. By End user

    14.4. Key Takeaways

15. MEA Market Analysis 2018 to 2022 and Forecast 2023 to 2033, By Country

    15.1. Historical Market Size Value (US$ Million) & Volume (Units) Trend Analysis By Market Taxonomy, 2018 to 2022

    15.2. Market Size Value (US$ Million) & Volume (Units) Forecast By Market Taxonomy, 2023 to 2033

        15.2.1. By Country

            15.2.1.1. GCC Countries

            15.2.1.2. South Africa

            15.2.1.3. Israel

            15.2.1.4. Rest of MEA

        15.2.2. By Product

        15.2.3. By Laser Type

        15.2.4. By End user

    15.3. Market Attractiveness Analysis

        15.3.1. By Country

        15.3.2. By Product

        15.3.3. By Laser Type

        15.3.4. By End user

    15.4. Key Takeaways

16. Key Countries Market Analysis

    16.1. USA

        16.1.1. Pricing Analysis

        16.1.2. Market Share Analysis, 2022

            16.1.2.1. By Product

            16.1.2.2. By Laser Type

            16.1.2.3. By End user

    16.2. Canada

        16.2.1. Pricing Analysis

        16.2.2. Market Share Analysis, 2022

            16.2.2.1. By Product

            16.2.2.2. By Laser Type

            16.2.2.3. By End user

    16.3. Brazil

        16.3.1. Pricing Analysis

        16.3.2. Market Share Analysis, 2022

            16.3.2.1. By Product

            16.3.2.2. By Laser Type

            16.3.2.3. By End user

    16.4. Mexico

        16.4.1. Pricing Analysis

        16.4.2. Market Share Analysis, 2022

            16.4.2.1. By Product

            16.4.2.2. By Laser Type

            16.4.2.3. By End user

    16.5. Germany

        16.5.1. Pricing Analysis

        16.5.2. Market Share Analysis, 2022

            16.5.2.1. By Product

            16.5.2.2. By Laser Type

            16.5.2.3. By End user

    16.6. United Kingdom

        16.6.1. Pricing Analysis

        16.6.2. Market Share Analysis, 2022

            16.6.2.1. By Product

            16.6.2.2. By Laser Type

            16.6.2.3. By End user

    16.7. France

        16.7.1. Pricing Analysis

        16.7.2. Market Share Analysis, 2022

            16.7.2.1. By Product

            16.7.2.2. By Laser Type

            16.7.2.3. By End user

    16.8. Spain

        16.8.1. Pricing Analysis

        16.8.2. Market Share Analysis, 2022

            16.8.2.1. By Product

            16.8.2.2. By Laser Type

            16.8.2.3. By End user

    16.9. Italy

        16.9.1. Pricing Analysis

        16.9.2. Market Share Analysis, 2022

            16.9.2.1. By Product

            16.9.2.2. By Laser Type

            16.9.2.3. By End user

    16.10. China

        16.10.1. Pricing Analysis

        16.10.2. Market Share Analysis, 2022

            16.10.2.1. By Product

            16.10.2.2. By Laser Type

            16.10.2.3. By End user

    16.11. Japan

        16.11.1. Pricing Analysis

        16.11.2. Market Share Analysis, 2022

            16.11.2.1. By Product

            16.11.2.2. By Laser Type

            16.11.2.3. By End user

    16.12. South Korea

        16.12.1. Pricing Analysis

        16.12.2. Market Share Analysis, 2022

            16.12.2.1. By Product

            16.12.2.2. By Laser Type

            16.12.2.3. By End user

    16.13. Singapore

        16.13.1. Pricing Analysis

        16.13.2. Market Share Analysis, 2022

            16.13.2.1. By Product

            16.13.2.2. By Laser Type

            16.13.2.3. By End user

    16.14. Thailand

        16.14.1. Pricing Analysis

        16.14.2. Market Share Analysis, 2022

            16.14.2.1. By Product

            16.14.2.2. By Laser Type

            16.14.2.3. By End user

    16.15. Indonesia

        16.15.1. Pricing Analysis

        16.15.2. Market Share Analysis, 2022

            16.15.2.1. By Product

            16.15.2.2. By Laser Type

            16.15.2.3. By End user

    16.16. Australia

        16.16.1. Pricing Analysis

        16.16.2. Market Share Analysis, 2022

            16.16.2.1. By Product

            16.16.2.2. By Laser Type

            16.16.2.3. By End user

    16.17. New Zealand

        16.17.1. Pricing Analysis

        16.17.2. Market Share Analysis, 2022

            16.17.2.1. By Product

            16.17.2.2. By Laser Type

            16.17.2.3. By End user

    16.18. GCC Countries

        16.18.1. Pricing Analysis

        16.18.2. Market Share Analysis, 2022

            16.18.2.1. By Product

            16.18.2.2. By Laser Type

            16.18.2.3. By End user

    16.19. South Africa

        16.19.1. Pricing Analysis

        16.19.2. Market Share Analysis, 2022

            16.19.2.1. By Product

            16.19.2.2. By Laser Type

            16.19.2.3. By End user

    16.20. Israel

        16.20.1. Pricing Analysis

        16.20.2. Market Share Analysis, 2022

            16.20.2.1. By Product

            16.20.2.2. By Laser Type

            16.20.2.3. By End user

17. Market Structure Analysis

    17.1. Competition Dashboard

    17.2. Competition Benchmarking

    17.3. Market Share Analysis of Top Players

        17.3.1. By Regional

        17.3.2. By Product

        17.3.3. By Laser Type

        17.3.4. By End user

18. Competition Analysis

    18.1. Competition Deep Dive

        18.1.1. Cutting Edge Laser Technologies

            18.1.1.1. Overview

            18.1.1.2. Product Portfolio

            18.1.1.3. Profitability by Market Segments

            18.1.1.4. Sales Footprint

            18.1.1.5. Strategy Overview

                18.1.1.5.1. Marketing Strategy

                18.1.1.5.2. Product Strategy

                18.1.1.5.3. Channel Strategy

        18.1.2. BIOLASE, Inc.

            18.1.2.1. Overview

            18.1.2.2. Product Portfolio

            18.1.2.3. Profitability by Market Segments

            18.1.2.4. Sales Footprint

            18.1.2.5. Strategy Overview

                18.1.2.5.1. Marketing Strategy

                18.1.2.5.2. Product Strategy

                18.1.2.5.3. Channel Strategy

        18.1.3. Aesculight Llc

            18.1.3.1. Overview

            18.1.3.2. Product Portfolio

            18.1.3.3. Profitability by Market Segments

            18.1.3.4. Sales Footprint

            18.1.3.5. Strategy Overview

                18.1.3.5.1. Marketing Strategy

                18.1.3.5.2. Product Strategy

                18.1.3.5.3. Channel Strategy

        18.1.4. LiteCure LLC

            18.1.4.1. Overview

            18.1.4.2. Product Portfolio

            18.1.4.3. Profitability by Market Segments

            18.1.4.4. Sales Footprint

            18.1.4.5. Strategy Overview

                18.1.4.5.1. Marketing Strategy

                18.1.4.5.2. Product Strategy

                18.1.4.5.3. Channel Strategy

        18.1.5. ERCHONIA CORPORATION

            18.1.5.1. Overview

            18.1.5.2. Product Portfolio

            18.1.5.3. Profitability by Market Segments

            18.1.5.4. Sales Footprint

            18.1.5.5. Strategy Overview

                18.1.5.5.1. Marketing Strategy

                18.1.5.5.2. Product Strategy

                18.1.5.5.3. Channel Strategy

        18.1.6. Laserex Technologies Pty Ltd

            18.1.6.1. Overview

            18.1.6.2. Product Portfolio

            18.1.6.3. Profitability by Market Segments

            18.1.6.4. Sales Footprint

            18.1.6.5. Strategy Overview

                18.1.6.5.1. Marketing Strategy

                18.1.6.5.2. Product Strategy

                18.1.6.5.3. Channel Strategy

        18.1.7. Respond Systems, Inc.

            18.1.7.1. Overview

            18.1.7.2. Product Portfolio

            18.1.7.3. Profitability by Market Segments

            18.1.7.4. Sales Footprint

            18.1.7.5. Strategy Overview

                18.1.7.5.1. Marketing Strategy

                18.1.7.5.2. Product Strategy

                18.1.7.5.3. Channel Strategy

        18.1.8. Technological Medical Advancements, Inc.

            18.1.8.1. Overview

            18.1.8.2. Product Portfolio

            18.1.8.3. Profitability by Market Segments

            18.1.8.4. Sales Footprint

            18.1.8.5. Strategy Overview

                18.1.8.5.1. Marketing Strategy

                18.1.8.5.2. Product Strategy

                18.1.8.5.3. Channel Strategy

        18.1.9. Pivotal Health Solutions

            18.1.9.1. Overview

            18.1.9.2. Product Portfolio

            18.1.9.3. Profitability by Market Segments

            18.1.9.4. Sales Footprint

            18.1.9.5. Strategy Overview

                18.1.9.5.1. Marketing Strategy

                18.1.9.5.2. Product Strategy

                18.1.9.5.3. Channel Strategy

        18.1.10. Excel Lasers Limited

            18.1.10.1. Overview

            18.1.10.2. Product Portfolio

            18.1.10.3. Profitability by Market Segments

            18.1.10.4. Sales Footprint

            18.1.10.5. Strategy Overview

                18.1.10.5.1. Marketing Strategy

                18.1.10.5.2. Product Strategy

                18.1.10.5.3. Channel Strategy

19. Assumptions & Acronyms Used

20. Research Methodology

Don't pay for what you don't need

Customize your report by selecting specific countries or regions and save 30%!

List of Tables

Table 1: Global Market Value (US$ Million) Forecast by Region, 2018 to 2033

Table 2: Global Market Volume (Units) Forecast by Region, 2018 to 2033

Table 3: Global Market Value (US$ Million) Forecast by Product, 2018 to 2033

Table 4: Global Market Volume (Units) Forecast by Product, 2018 to 2033

Table 5: Global Market Value (US$ Million) Forecast by Laser Type, 2018 to 2033

Table 6: Global Market Volume (Units) Forecast by Laser Type, 2018 to 2033

Table 7: Global Market Value (US$ Million) Forecast by End user, 2018 to 2033

Table 8: Global Market Volume (Units) Forecast by End user, 2018 to 2033

Table 9: North America Market Value (US$ Million) Forecast by Country, 2018 to 2033

Table 10: North America Market Volume (Units) Forecast by Country, 2018 to 2033

Table 11: North America Market Value (US$ Million) Forecast by Product, 2018 to 2033

Table 12: North America Market Volume (Units) Forecast by Product, 2018 to 2033

Table 13: North America Market Value (US$ Million) Forecast by Laser Type, 2018 to 2033

Table 14: North America Market Volume (Units) Forecast by Laser Type, 2018 to 2033

Table 15: North America Market Value (US$ Million) Forecast by End user, 2018 to 2033

Table 16: North America Market Volume (Units) Forecast by End user, 2018 to 2033

Table 17: Latin America Market Value (US$ Million) Forecast by Country, 2018 to 2033

Table 18: Latin America Market Volume (Units) Forecast by Country, 2018 to 2033

Table 19: Latin America Market Value (US$ Million) Forecast by Product, 2018 to 2033

Table 20: Latin America Market Volume (Units) Forecast by Product, 2018 to 2033

Table 21: Latin America Market Value (US$ Million) Forecast by Laser Type, 2018 to 2033

Table 22: Latin America Market Volume (Units) Forecast by Laser Type, 2018 to 2033

Table 23: Latin America Market Value (US$ Million) Forecast by End user, 2018 to 2033

Table 24: Latin America Market Volume (Units) Forecast by End user, 2018 to 2033

Table 25: Europe Market Value (US$ Million) Forecast by Country, 2018 to 2033

Table 26: Europe Market Volume (Units) Forecast by Country, 2018 to 2033

Table 27: Europe Market Value (US$ Million) Forecast by Product, 2018 to 2033

Table 28: Europe Market Volume (Units) Forecast by Product, 2018 to 2033

Table 29: Europe Market Value (US$ Million) Forecast by Laser Type, 2018 to 2033

Table 30: Europe Market Volume (Units) Forecast by Laser Type, 2018 to 2033

Table 31: Europe Market Value (US$ Million) Forecast by End user, 2018 to 2033

Table 32: Europe Market Volume (Units) Forecast by End user, 2018 to 2033

Table 33: South Asia Market Value (US$ Million) Forecast by Country, 2018 to 2033

Table 34: South Asia Market Volume (Units) Forecast by Country, 2018 to 2033

Table 35: South Asia Market Value (US$ Million) Forecast by Product, 2018 to 2033

Table 36: South Asia Market Volume (Units) Forecast by Product, 2018 to 2033

Table 37: South Asia Market Value (US$ Million) Forecast by Laser Type, 2018 to 2033

Table 38: South Asia Market Volume (Units) Forecast by Laser Type, 2018 to 2033

Table 39: South Asia Market Value (US$ Million) Forecast by End user, 2018 to 2033

Table 40: South Asia Market Volume (Units) Forecast by End user, 2018 to 2033

Table 41: East Asia Market Value (US$ Million) Forecast by Country, 2018 to 2033

Table 42: East Asia Market Volume (Units) Forecast by Country, 2018 to 2033

Table 43: East Asia Market Value (US$ Million) Forecast by Product, 2018 to 2033

Table 44: East Asia Market Volume (Units) Forecast by Product, 2018 to 2033

Table 45: East Asia Market Value (US$ Million) Forecast by Laser Type, 2018 to 2033

Table 46: East Asia Market Volume (Units) Forecast by Laser Type, 2018 to 2033

Table 47: East Asia Market Value (US$ Million) Forecast by End user, 2018 to 2033

Table 48: East Asia Market Volume (Units) Forecast by End user, 2018 to 2033

Table 49: Oceania Market Value (US$ Million) Forecast by Country, 2018 to 2033

Table 50: Oceania Market Volume (Units) Forecast by Country, 2018 to 2033

Table 51: Oceania Market Value (US$ Million) Forecast by Product, 2018 to 2033

Table 52: Oceania Market Volume (Units) Forecast by Product, 2018 to 2033

Table 53: Oceania Market Value (US$ Million) Forecast by Laser Type, 2018 to 2033

Table 54: Oceania Market Volume (Units) Forecast by Laser Type, 2018 to 2033

Table 55: Oceania Market Value (US$ Million) Forecast by End user, 2018 to 2033

Table 56: Oceania Market Volume (Units) Forecast by End user, 2018 to 2033

Table 57: MEA Market Value (US$ Million) Forecast by Country, 2018 to 2033

Table 58: MEA Market Volume (Units) Forecast by Country, 2018 to 2033

Table 59: MEA Market Value (US$ Million) Forecast by Product, 2018 to 2033

Table 60: MEA Market Volume (Units) Forecast by Product, 2018 to 2033

Table 61: MEA Market Value (US$ Million) Forecast by Laser Type, 2018 to 2033

Table 62: MEA Market Volume (Units) Forecast by Laser Type, 2018 to 2033

Table 63: MEA Market Value (US$ Million) Forecast by End user, 2018 to 2033

Table 64: MEA Market Volume (Units) Forecast by End user, 2018 to 2033
Sabyasachi Ghosh
Sabyasachi Ghosh

Principal Consultant

Talk to Analyst

Find your sweet spots for generating winning opportunities in this market.

List of Charts

Figure 1: Global Market Value (US$ Million) by Product, 2023 to 2033

Figure 2: Global Market Value (US$ Million) by Laser Type, 2023 to 2033

Figure 3: Global Market Value (US$ Million) by End user, 2023 to 2033

Figure 4: Global Market Value (US$ Million) by Region, 2023 to 2033

Figure 5: Global Market Value (US$ Million) Analysis by Region, 2018 to 2033

Figure 6: Global Market Volume (Units) Analysis by Region, 2018 to 2033

Figure 7: Global Market Value Share (%) and BPS Analysis by Region, 2023 to 2033

Figure 8: Global Market Y-o-Y Growth (%) Projections by Region, 2023 to 2033

Figure 9: Global Market Value (US$ Million) Analysis by Product, 2018 to 2033

Figure 10: Global Market Volume (Units) Analysis by Product, 2018 to 2033

Figure 11: Global Market Value Share (%) and BPS Analysis by Product, 2023 to 2033

Figure 12: Global Market Y-o-Y Growth (%) Projections by Product, 2023 to 2033

Figure 13: Global Market Value (US$ Million) Analysis by Laser Type, 2018 to 2033

Figure 14: Global Market Volume (Units) Analysis by Laser Type, 2018 to 2033

Figure 15: Global Market Value Share (%) and BPS Analysis by Laser Type, 2023 to 2033

Figure 16: Global Market Y-o-Y Growth (%) Projections by Laser Type, 2023 to 2033

Figure 17: Global Market Value (US$ Million) Analysis by End user, 2018 to 2033

Figure 18: Global Market Volume (Units) Analysis by End user, 2018 to 2033

Figure 19: Global Market Value Share (%) and BPS Analysis by End user, 2023 to 2033

Figure 20: Global Market Y-o-Y Growth (%) Projections by End user, 2023 to 2033

Figure 21: Global Market Attractiveness by Product, 2023 to 2033

Figure 22: Global Market Attractiveness by Laser Type, 2023 to 2033

Figure 23: Global Market Attractiveness by End user, 2023 to 2033

Figure 24: Global Market Attractiveness by Region, 2023 to 2033

Figure 25: North America Market Value (US$ Million) by Product, 2023 to 2033

Figure 26: North America Market Value (US$ Million) by Laser Type, 2023 to 2033

Figure 27: North America Market Value (US$ Million) by End user, 2023 to 2033

Figure 28: North America Market Value (US$ Million) by Country, 2023 to 2033

Figure 29: North America Market Value (US$ Million) Analysis by Country, 2018 to 2033

Figure 30: North America Market Volume (Units) Analysis by Country, 2018 to 2033

Figure 31: North America Market Value Share (%) and BPS Analysis by Country, 2023 to 2033

Figure 32: North America Market Y-o-Y Growth (%) Projections by Country, 2023 to 2033

Figure 33: North America Market Value (US$ Million) Analysis by Product, 2018 to 2033

Figure 34: North America Market Volume (Units) Analysis by Product, 2018 to 2033

Figure 35: North America Market Value Share (%) and BPS Analysis by Product, 2023 to 2033

Figure 36: North America Market Y-o-Y Growth (%) Projections by Product, 2023 to 2033

Figure 37: North America Market Value (US$ Million) Analysis by Laser Type, 2018 to 2033

Figure 38: North America Market Volume (Units) Analysis by Laser Type, 2018 to 2033

Figure 39: North America Market Value Share (%) and BPS Analysis by Laser Type, 2023 to 2033

Figure 40: North America Market Y-o-Y Growth (%) Projections by Laser Type, 2023 to 2033

Figure 41: North America Market Value (US$ Million) Analysis by End user, 2018 to 2033

Figure 42: North America Market Volume (Units) Analysis by End user, 2018 to 2033

Figure 43: North America Market Value Share (%) and BPS Analysis by End user, 2023 to 2033

Figure 44: North America Market Y-o-Y Growth (%) Projections by End user, 2023 to 2033

Figure 45: North America Market Attractiveness by Product, 2023 to 2033

Figure 46: North America Market Attractiveness by Laser Type, 2023 to 2033

Figure 47: North America Market Attractiveness by End user, 2023 to 2033

Figure 48: North America Market Attractiveness by Country, 2023 to 2033

Figure 49: Latin America Market Value (US$ Million) by Product, 2023 to 2033

Figure 50: Latin America Market Value (US$ Million) by Laser Type, 2023 to 2033

Figure 51: Latin America Market Value (US$ Million) by End user, 2023 to 2033

Figure 52: Latin America Market Value (US$ Million) by Country, 2023 to 2033

Figure 53: Latin America Market Value (US$ Million) Analysis by Country, 2018 to 2033

Figure 54: Latin America Market Volume (Units) Analysis by Country, 2018 to 2033

Figure 55: Latin America Market Value Share (%) and BPS Analysis by Country, 2023 to 2033

Figure 56: Latin America Market Y-o-Y Growth (%) Projections by Country, 2023 to 2033

Figure 57: Latin America Market Value (US$ Million) Analysis by Product, 2018 to 2033

Figure 58: Latin America Market Volume (Units) Analysis by Product, 2018 to 2033

Figure 59: Latin America Market Value Share (%) and BPS Analysis by Product, 2023 to 2033

Figure 60: Latin America Market Y-o-Y Growth (%) Projections by Product, 2023 to 2033

Figure 61: Latin America Market Value (US$ Million) Analysis by Laser Type, 2018 to 2033

Figure 62: Latin America Market Volume (Units) Analysis by Laser Type, 2018 to 2033

Figure 63: Latin America Market Value Share (%) and BPS Analysis by Laser Type, 2023 to 2033

Figure 64: Latin America Market Y-o-Y Growth (%) Projections by Laser Type, 2023 to 2033

Figure 65: Latin America Market Value (US$ Million) Analysis by End user, 2018 to 2033

Figure 66: Latin America Market Volume (Units) Analysis by End user, 2018 to 2033

Figure 67: Latin America Market Value Share (%) and BPS Analysis by End user, 2023 to 2033

Figure 68: Latin America Market Y-o-Y Growth (%) Projections by End user, 2023 to 2033

Figure 69: Latin America Market Attractiveness by Product, 2023 to 2033

Figure 70: Latin America Market Attractiveness by Laser Type, 2023 to 2033

Figure 71: Latin America Market Attractiveness by End user, 2023 to 2033

Figure 72: Latin America Market Attractiveness by Country, 2023 to 2033

Figure 73: Europe Market Value (US$ Million) by Product, 2023 to 2033

Figure 74: Europe Market Value (US$ Million) by Laser Type, 2023 to 2033

Figure 75: Europe Market Value (US$ Million) by End user, 2023 to 2033

Figure 76: Europe Market Value (US$ Million) by Country, 2023 to 2033

Figure 77: Europe Market Value (US$ Million) Analysis by Country, 2018 to 2033

Figure 78: Europe Market Volume (Units) Analysis by Country, 2018 to 2033

Figure 79: Europe Market Value Share (%) and BPS Analysis by Country, 2023 to 2033

Figure 80: Europe Market Y-o-Y Growth (%) Projections by Country, 2023 to 2033

Figure 81: Europe Market Value (US$ Million) Analysis by Product, 2018 to 2033

Figure 82: Europe Market Volume (Units) Analysis by Product, 2018 to 2033

Figure 83: Europe Market Value Share (%) and BPS Analysis by Product, 2023 to 2033

Figure 84: Europe Market Y-o-Y Growth (%) Projections by Product, 2023 to 2033

Figure 85: Europe Market Value (US$ Million) Analysis by Laser Type, 2018 to 2033

Figure 86: Europe Market Volume (Units) Analysis by Laser Type, 2018 to 2033

Figure 87: Europe Market Value Share (%) and BPS Analysis by Laser Type, 2023 to 2033

Figure 88: Europe Market Y-o-Y Growth (%) Projections by Laser Type, 2023 to 2033

Figure 89: Europe Market Value (US$ Million) Analysis by End user, 2018 to 2033

Figure 90: Europe Market Volume (Units) Analysis by End user, 2018 to 2033

Figure 91: Europe Market Value Share (%) and BPS Analysis by End user, 2023 to 2033

Figure 92: Europe Market Y-o-Y Growth (%) Projections by End user, 2023 to 2033

Figure 93: Europe Market Attractiveness by Product, 2023 to 2033

Figure 94: Europe Market Attractiveness by Laser Type, 2023 to 2033

Figure 95: Europe Market Attractiveness by End user, 2023 to 2033

Figure 96: Europe Market Attractiveness by Country, 2023 to 2033

Figure 97: South Asia Market Value (US$ Million) by Product, 2023 to 2033

Figure 98: South Asia Market Value (US$ Million) by Laser Type, 2023 to 2033

Figure 99: South Asia Market Value (US$ Million) by End user, 2023 to 2033

Figure 100: South Asia Market Value (US$ Million) by Country, 2023 to 2033

Figure 101: South Asia Market Value (US$ Million) Analysis by Country, 2018 to 2033

Figure 102: South Asia Market Volume (Units) Analysis by Country, 2018 to 2033

Figure 103: South Asia Market Value Share (%) and BPS Analysis by Country, 2023 to 2033

Figure 104: South Asia Market Y-o-Y Growth (%) Projections by Country, 2023 to 2033

Figure 105: South Asia Market Value (US$ Million) Analysis by Product, 2018 to 2033

Figure 106: South Asia Market Volume (Units) Analysis by Product, 2018 to 2033

Figure 107: South Asia Market Value Share (%) and BPS Analysis by Product, 2023 to 2033

Figure 108: South Asia Market Y-o-Y Growth (%) Projections by Product, 2023 to 2033

Figure 109: South Asia Market Value (US$ Million) Analysis by Laser Type, 2018 to 2033

Figure 110: South Asia Market Volume (Units) Analysis by Laser Type, 2018 to 2033

Figure 111: South Asia Market Value Share (%) and BPS Analysis by Laser Type, 2023 to 2033

Figure 112: South Asia Market Y-o-Y Growth (%) Projections by Laser Type, 2023 to 2033

Figure 113: South Asia Market Value (US$ Million) Analysis by End user, 2018 to 2033

Figure 114: South Asia Market Volume (Units) Analysis by End user, 2018 to 2033

Figure 115: South Asia Market Value Share (%) and BPS Analysis by End user, 2023 to 2033

Figure 116: South Asia Market Y-o-Y Growth (%) Projections by End user, 2023 to 2033

Figure 117: South Asia Market Attractiveness by Product, 2023 to 2033

Figure 118: South Asia Market Attractiveness by Laser Type, 2023 to 2033

Figure 119: South Asia Market Attractiveness by End user, 2023 to 2033

Figure 120: South Asia Market Attractiveness by Country, 2023 to 2033

Figure 121: East Asia Market Value (US$ Million) by Product, 2023 to 2033

Figure 122: East Asia Market Value (US$ Million) by Laser Type, 2023 to 2033

Figure 123: East Asia Market Value (US$ Million) by End user, 2023 to 2033

Figure 124: East Asia Market Value (US$ Million) by Country, 2023 to 2033

Figure 125: East Asia Market Value (US$ Million) Analysis by Country, 2018 to 2033

Figure 126: East Asia Market Volume (Units) Analysis by Country, 2018 to 2033

Figure 127: East Asia Market Value Share (%) and BPS Analysis by Country, 2023 to 2033

Figure 128: East Asia Market Y-o-Y Growth (%) Projections by Country, 2023 to 2033

Figure 129: East Asia Market Value (US$ Million) Analysis by Product, 2018 to 2033

Figure 130: East Asia Market Volume (Units) Analysis by Product, 2018 to 2033

Figure 131: East Asia Market Value Share (%) and BPS Analysis by Product, 2023 to 2033

Figure 132: East Asia Market Y-o-Y Growth (%) Projections by Product, 2023 to 2033

Figure 133: East Asia Market Value (US$ Million) Analysis by Laser Type, 2018 to 2033

Figure 134: East Asia Market Volume (Units) Analysis by Laser Type, 2018 to 2033

Figure 135: East Asia Market Value Share (%) and BPS Analysis by Laser Type, 2023 to 2033

Figure 136: East Asia Market Y-o-Y Growth (%) Projections by Laser Type, 2023 to 2033

Figure 137: East Asia Market Value (US$ Million) Analysis by End user, 2018 to 2033

Figure 138: East Asia Market Volume (Units) Analysis by End user, 2018 to 2033

Figure 139: East Asia Market Value Share (%) and BPS Analysis by End user, 2023 to 2033

Figure 140: East Asia Market Y-o-Y Growth (%) Projections by End user, 2023 to 2033

Figure 141: East Asia Market Attractiveness by Product, 2023 to 2033

Figure 142: East Asia Market Attractiveness by Laser Type, 2023 to 2033

Figure 143: East Asia Market Attractiveness by End user, 2023 to 2033

Figure 144: East Asia Market Attractiveness by Country, 2023 to 2033

Figure 145: Oceania Market Value (US$ Million) by Product, 2023 to 2033

Figure 146: Oceania Market Value (US$ Million) by Laser Type, 2023 to 2033

Figure 147: Oceania Market Value (US$ Million) by End user, 2023 to 2033

Figure 148: Oceania Market Value (US$ Million) by Country, 2023 to 2033

Figure 149: Oceania Market Value (US$ Million) Analysis by Country, 2018 to 2033

Figure 150: Oceania Market Volume (Units) Analysis by Country, 2018 to 2033

Figure 151: Oceania Market Value Share (%) and BPS Analysis by Country, 2023 to 2033

Figure 152: Oceania Market Y-o-Y Growth (%) Projections by Country, 2023 to 2033

Figure 153: Oceania Market Value (US$ Million) Analysis by Product, 2018 to 2033

Figure 154: Oceania Market Volume (Units) Analysis by Product, 2018 to 2033

Figure 155: Oceania Market Value Share (%) and BPS Analysis by Product, 2023 to 2033

Figure 156: Oceania Market Y-o-Y Growth (%) Projections by Product, 2023 to 2033

Figure 157: Oceania Market Value (US$ Million) Analysis by Laser Type, 2018 to 2033

Figure 158: Oceania Market Volume (Units) Analysis by Laser Type, 2018 to 2033

Figure 159: Oceania Market Value Share (%) and BPS Analysis by Laser Type, 2023 to 2033

Figure 160: Oceania Market Y-o-Y Growth (%) Projections by Laser Type, 2023 to 2033

Figure 161: Oceania Market Value (US$ Million) Analysis by End user, 2018 to 2033

Figure 162: Oceania Market Volume (Units) Analysis by End user, 2018 to 2033

Figure 163: Oceania Market Value Share (%) and BPS Analysis by End user, 2023 to 2033

Figure 164: Oceania Market Y-o-Y Growth (%) Projections by End user, 2023 to 2033

Figure 165: Oceania Market Attractiveness by Product, 2023 to 2033

Figure 166: Oceania Market Attractiveness by Laser Type, 2023 to 2033

Figure 167: Oceania Market Attractiveness by End user, 2023 to 2033

Figure 168: Oceania Market Attractiveness by Country, 2023 to 2033

Figure 169: MEA Market Value (US$ Million) by Product, 2023 to 2033

Figure 170: MEA Market Value (US$ Million) by Laser Type, 2023 to 2033

Figure 171: MEA Market Value (US$ Million) by End user, 2023 to 2033

Figure 172: MEA Market Value (US$ Million) by Country, 2023 to 2033

Figure 173: MEA Market Value (US$ Million) Analysis by Country, 2018 to 2033

Figure 174: MEA Market Volume (Units) Analysis by Country, 2018 to 2033

Figure 175: MEA Market Value Share (%) and BPS Analysis by Country, 2023 to 2033

Figure 176: MEA Market Y-o-Y Growth (%) Projections by Country, 2023 to 2033

Figure 177: MEA Market Value (US$ Million) Analysis by Product, 2018 to 2033

Figure 178: MEA Market Volume (Units) Analysis by Product, 2018 to 2033

Figure 179: MEA Market Value Share (%) and BPS Analysis by Product, 2023 to 2033

Figure 180: MEA Market Y-o-Y Growth (%) Projections by Product, 2023 to 2033

Figure 181: MEA Market Value (US$ Million) Analysis by Laser Type, 2018 to 2033

Figure 182: MEA Market Volume (Units) Analysis by Laser Type, 2018 to 2033

Figure 183: MEA Market Value Share (%) and BPS Analysis by Laser Type, 2023 to 2033

Figure 184: MEA Market Y-o-Y Growth (%) Projections by Laser Type, 2023 to 2033

Figure 185: MEA Market Value (US$ Million) Analysis by End user, 2018 to 2033

Figure 186: MEA Market Volume (Units) Analysis by End user, 2018 to 2033

Figure 187: MEA Market Value Share (%) and BPS Analysis by End user, 2023 to 2033

Figure 188: MEA Market Y-o-Y Growth (%) Projections by End user, 2023 to 2033

Figure 189: MEA Market Attractiveness by Product, 2023 to 2033

Figure 190: MEA Market Attractiveness by Laser Type, 2023 to 2033

Figure 191: MEA Market Attractiveness by End user, 2023 to 2033

Figure 192: MEA Market Attractiveness by Country, 2023 to 2033

Recommendations

Healthcare

Veterinary Biologics Market

Published : January 2024

Healthcare

Veterinary Pain Management Drugs Market

Published : January 2023

Explore Healthcare Insights

View Reports