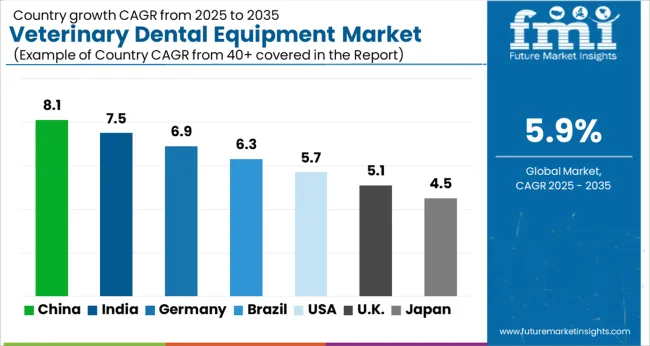
Veterinary Dental Equipment Market Outlook from 2024 to 2034

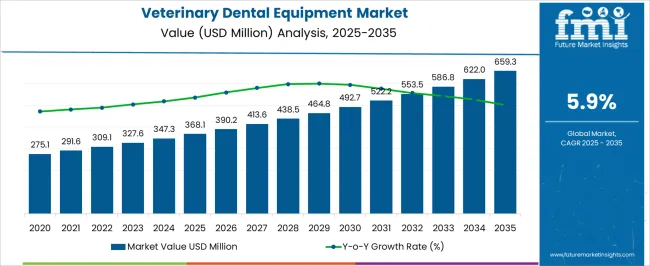
The veterinary dental equipment market is estimated at US$ 347.3 million by 2024. The market valuation is expected to be US$ 621 million by 2034, registering a moderate CAGR of 6%.

The market is witnessing robust growth driven by an increasing awareness of oral health in animals. The market is characterized by a focus on innovation, with a shift towards digital imaging and diagnostic tools.

New entrants and smaller companies are making strides by emphasizing product differentiation and strategic collaborations. Technological advancements and a growing trend in specialized veterinary dental care contribute to the market's dynamism.

As pet ownership continues to rise globally, the market is poised for further expansion, with a constant emphasis on research and development to meet the evolving needs of veterinary practitioners.

Key Market Trends and Highlights

  • Increasing awareness about the importance of oral health in animals is a key driver of market growth.
  • Technological advancements, including the adoption of digital imaging and diagnostic tools, are notable trends in the market.
  • A growing trend towards specialized veterinary dental care is shaping the market, with companies developing tailored products and solutions.
  • The rise in pet ownership globally is a significant factor propelling the demand for veterinary dental equipment.
Attributes Key Insights
Market Estimated Size in 2024 US$ 347.3 Million
Projected Market Size in 2034 US$ 621 Million
Value-based CAGR from 2024 to 2034 6%

Don't pay for what you don't need

Customize your report by selecting specific countries or regions and save 30%!

2019 to 2023 Historical Analysis vs. 2024 to 2034 Market Forecast Projections

The scope for global veterinary dental equipment market insights expanded at a 7.7% CAGR between 2019 and 2023. The market is anticipated to develop at a CAGR of 6% over the forecast period from 2024 to 2034.

Historical CAGR from 2019 to 2023 7.7%
Forecast CAGR from 2024 to 2034 6%

Between 2019 and 2023, the global market demonstrated significant growth, expanding at a CAGR of 7.7%. This period saw substantial advancements and increased adoption of veterinary dental solutions, reflecting a growing awareness of the importance of animal oral health.

Looking ahead, market projections for the period from 2024 to 2034 indicate a continued positive trajectory, albeit at a slightly moderated pace. The anticipated CAGR during this forecast period is 6%, underscoring a sustained demand for veterinary dental equipment.

Factors such as ongoing technological innovations, heightened emphasis on specialized veterinary care, and the global surge in pet ownership contribute to the positive outlook for the market in the coming decade.

Veterinary Dental Equipment Market Driving Factors

Attributes Details
Drivers
  • Increasing awareness regarding the significance of oral health in animals is a primary driver for the market.
  • Ongoing innovations, particularly in digital imaging and diagnostic tools, contribute to the market growth by offering more efficient and advanced solutions.
  • A rising trend in specialized veterinary dental care fuels the demand for advanced equipment tailored to meet specific needs.
  • The continuous increase in global pet ownership is a significant factor in propelling the demand for veterinary dental equipment.
  • Intense competition among key players and expanding market scope into emerging regions drive growth through strategic collaborations and product differentiation.
Sabyasachi Ghosh
Sabyasachi Ghosh

Principal Consultant

Talk to Analyst

Find your sweet spots for generating winning opportunities in this market.

Country-wise Analysis

The table displays CAGRs for five key countries, the United States, Japan, China, the United Kingdom, and South Korea. The market in Japan stands out as dynamic and swiftly progressing, poised for substantial expansion with a projected 7.6% CAGR by the year 2034.

The commitment of the nation to innovation is evident, as it actively contributes to various industries, fostering a thriving landscape in its economic development. This underscores its significant role in the global market, showcasing its current dynamism and potential for future growth.

Countries CAGRs from 2024 to 2034
The United States 6.4%
Japan 7.6%
China 6.8%
The United Kingdom 7.1%
South Korea 4.1%

Utilization of Veterinary Dental Equipment Boosts the United States Market

The United States leads in utilizing veterinary dental equipment due to a well-established veterinary care infrastructure and high awareness among pet owners. A robust pet industry and a growing focus on comprehensive healthcare for companion animals sustain the market growth.
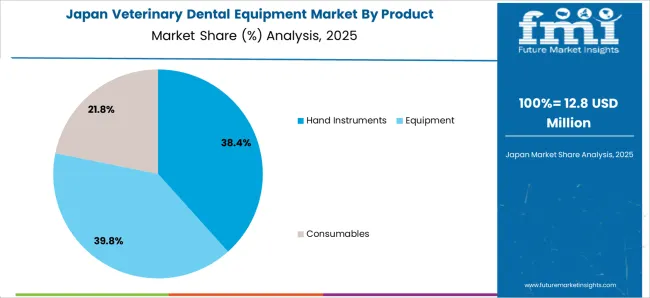
Advanced Technological Landscape Fuels Market Growth in Japan

Japan showcases a dynamic market driven by its advanced technological landscape and a cultural inclination towards pet companionship. The commitment to innovation in various industries extends to veterinary care, contributing to the rapid advancement of the market.

Rise in Awareness of Animal Welfare Inhibits Growth in China

The market in China is experiencing notable growth owing to the increasing trend of pet ownership and a rising awareness of animal welfare. As the middle class expands, there is a greater capacity and willingness to invest in advanced veterinary care, boosting market demand.

Stringent Healthcare Standards Surge the United Kingdom Market

The United Kingdom demonstrates a thriving market for veterinary dental equipment fueled by a strong pet culture, stringent healthcare standards, and a trend toward specialized veterinary services. The commitment to pet well-being and preventive healthcare supports the growth of the market.
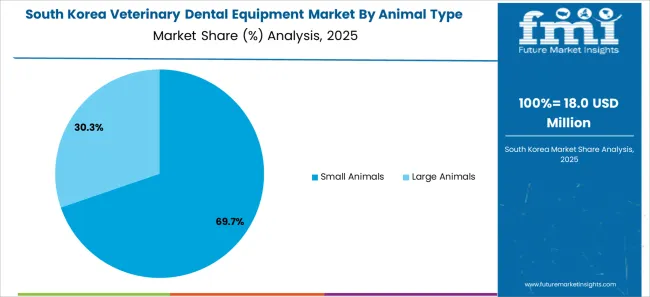
Steady Growth in Veterinary Homes Drives the South Korea Market

While the CAGR in South Korea is relatively moderate, the market here is influenced by a gradual increase in pet ownership and a growing awareness of the importance of oral health in animals. The market is expected to grow steadily as veterinary care becomes more integral to pet owners in the country.

Category-wise Insights

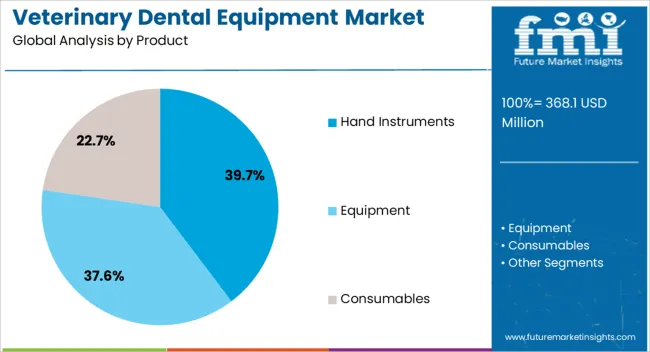
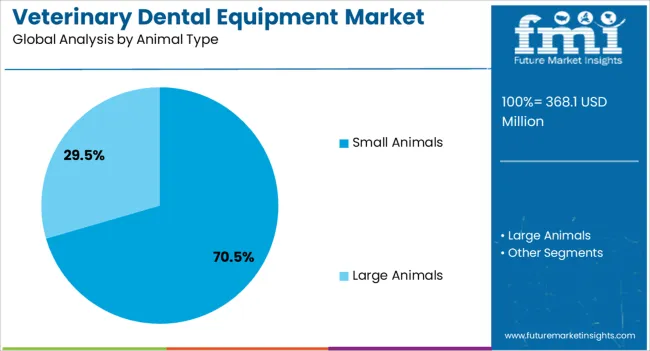
The table below provides an overview of the veterinary dental equipment landscape on the basis of animal type and product type. Large animals are projected to lead the animal type market at a 5.5% CAGR by 2034, while hand instruments in the product type category are likely to expand at a CAGR of 5.8% by 2034.

The increasing awareness and emphasis on oral health in livestock, equines, and other sizable animals primarily drive the dominance of large animals in the market. The substantial growth projected for hand instruments in the market is propelled by the enduring importance of manual tools in dental procedures.

Category CAGR by 2034
Large Animals 5.5%
Hand Instruments 5.8%

Large Animals Hold a Pivotal Position in the Market

In terms of animal type, large animals are anticipated to dominate the market with a projected CAGR of 5.5% by 2034. This suggests a growing demand for dental equipment tailored to the oral health needs of larger animals, indicating a significant market opportunity in this segment.

Hand Instruments Hold a Dominant Position

Hand instruments are poised for substantial growth in the product type category, expected to expand at a CAGR of 5.8% by 2034. This points to a sustained demand for manual dental instruments, showcasing the importance of traditional tools in veterinary dental procedures. The projected growth in large animal-focused equipment and hand instruments reflects the evolving dynamics and preferences within the veterinary dental equipment market.
Get the data you need at a Fraction of the cost

Personalize your report by choosing insights you need
and save 40%!

Competitive landscape

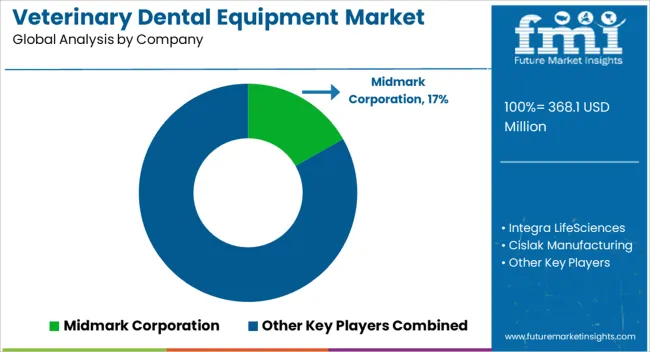
The veterinary dental equipment market is characterized by intense competition, driven by the growing awareness of the importance of oral health in animals and the increasing pet ownership worldwide.

The companies offer a wide range of veterinary dental equipment, including dental machines, instruments, and consumables, catering to the diverse needs of veterinary practitioners.

In addition to traditional players, new entrants and smaller companies are also making a mark in the market by focusing on innovative product development and strategic collaborations.

The market is witnessing technological advancements, shifting towards digital imaging and diagnostic tools. As the demand for specialized veterinary dental care continues to rise, companies are vying for market share through product differentiation, competitive pricing, and expansion into emerging markets.

Some of the recent developments are:

  • In June 2022, iM3 inaugurated its dedicated education center named iM3 ACE in Ireland. The facility is designed to facilitate hands-on training for veterinary professionals worldwide, offering simulated environments for dental procedures.
  • In April 2022, Animalcare introduced Plaqtiv+, a novel range of dental care products tailored for cats and dogs. Specifically formulated to mitigate the formation of calculus, the product line includes a water additive endorsed by the Veterinary Oral Health Council (VOHC).

Report Scope

Attributes Details
Estimated Market Size in 2024 US$ 347.3 million
Projected Market Valuation in 2034 US$ 621 million
CAGR Share from 2024 to 2034 6%
Forecast Period 2024 to 2034
Historical Data Available for 2019 to 2023
Market Analysis Value in US$ million
Key Regions Covered
  • North America
  • Latin America
  • Western Europe
  • Eastern Europe
  • South Asia and Pacific
  • East Asia
  • Middle East and Africa
Key Market Segments Covered
  • By Product
  • By Animal Type
  • By End User
  • By Region
Key Countries Profiled
  • The United States
  • Canada
  • Brazil
  • Mexico
  • Germany
  • The United Kingdom
  • France
  • Spain
  • Italy
  • Poland
  • Russia
  • Czech Republic
  • Romania
  • India
  • Bangladesh
  • Australia
  • New Zealand
  • China
  • Japan
  • South Korea
  • GCC Countries
  • South Africa
  • Israel
Key Companies Profiled
  • Integra LifeSciences
  • Cislak Manufacturing
  • Eickemeyer Veterinary Equipment Inc.
  • MAI Animal Health
  • Dentalaire International
  • Midmark Corporation
  • Planmeca OY
  • J & J Instruments
  • iM3Vet Pty Ltd.
  • Acteon Group Ltd.

Key Segments of Veterinary Dental Equipment Industry Survey

By Product:

  • Hand Instruments
  • Equipment
  • Consumables

By Animal type:

  • Large Animals
  • Small Animals

By End User:

  • Veterinary Hospitals
  • Veterinary Clinics
  • Others

By Region:

  • North America
  • Latin America
  • Western Europe
  • Eastern Europe
  • South Asia and Pacific
  • East Asia
  • Middle East and Africa

Frequently Asked Questions

What is the expected value of the veterinary dental equipment market in 2024?

By 2024, the veterinary dental equipment landscape is anticipated to be valued at US$ 347.3 million.

What is the projected forecast CAGR for the veterinary dental equipment market from 2024 to 2034?

The veterinary dental equipment market is projected to flourish at a CAGR of 6% from 2024 to 2034.

At what value the veterinary dental equipment market is expected to conclude in 2034?

By 2034, the veterinary dental equipment market will generate US$ 621 million in value terms.

Based on animal type, which segment dominates the veterinary dental equipment market?

The large animals segment is anticipated to expand at 5.5% CAGR by 2034.

Based on product type, which segment leads the veterinary dental equipment market?

With a CAGR of 5.8%, hand instruments are expected to dominate the market for veterinary dental equipment.

Table of Content
1. Executive Summary
    1.1. Global Market Outlook
    1.2. Demand-side Trends
    1.3. Supply-side Trends
    1.4. Technology Roadmap Analysis
    1.5. Analysis and Recommendations
2. Market Overview
    2.1. Market Coverage / Taxonomy
    2.2. Market Definition / Scope / Limitations
3. Market Background
    3.1. Market Dynamics
        3.1.1. Drivers
        3.1.2. Restraints
        3.1.3. Opportunity
        3.1.4. Trends
    3.2. Scenario Forecast
        3.2.1. Demand in Optimistic Scenario
        3.2.2. Demand in Likely Scenario
        3.2.3. Demand in Conservative Scenario
    3.3. Opportunity Map Analysis
    3.4. Product Life Cycle Analysis
    3.5. Supply Chain Analysis
        3.5.1. Supply Side Participants and their Roles
            3.5.1.1. Producers
            3.5.1.2. Mid-Level Participants (Traders/ Agents/ Brokers)
            3.5.1.3. Wholesalers and Distributors
        3.5.2. Value Added and Value Created at Node in the Supply Chain
        3.5.3. List of Raw Material Suppliers
        3.5.4. List of Existing and Potential Buyer’s
    3.6. Investment Feasibility Matrix
    3.7. Value Chain Analysis
        3.7.1. Profit Margin Analysis
        3.7.2. Wholesalers and Distributors
        3.7.3. Retailers
    3.8. PESTLE and Porter’s Analysis
    3.9. Regulatory Landscape
        3.9.1. By Key Regions
        3.9.2. By Key Countries
    3.10. Regional Parent Market Outlook
    3.11. Production and Consumption Statistics
    3.12. Import and Export Statistics
4. Global Market Analysis 2019 to 2023 and Forecast, 2024 to 2034
    4.1. Historical Market Size Value (US$ Million) & Volume (Units) Analysis, 2019 to 2023
    4.2. Current and Future Market Size Value (US$ Million) & Volume (Units) Projections, 2024 to 2034
        4.2.1. Y-o-Y Growth Trend Analysis
        4.2.2. Absolute $ Opportunity Analysis
5. Global Market Analysis 2019 to 2023 and Forecast 2024 to 2034, By Product
    5.1. Introduction / Key Findings
    5.2. Historical Market Size Value (US$ Million) & Volume (Units) Analysis By Product, 2019 to 2023
    5.3. Current and Future Market Size Value (US$ Million) & Volume (Units) Analysis and Forecast By Product, 2024 to 2034
        5.3.1. Hand Instruments
        5.3.2. Equipment
        5.3.3. Consumables
    5.4. Y-o-Y Growth Trend Analysis By Product, 2019 to 2023
    5.5. Absolute $ Opportunity Analysis By Product, 2024 to 2034
6. Global Market Analysis 2019 to 2023 and Forecast 2024 to 2034, By Animal Type
    6.1. Introduction / Key Findings
    6.2. Historical Market Size Value (US$ Million) & Volume (Units) Analysis By Animal Type, 2019 to 2023
    6.3. Current and Future Market Size Value (US$ Million) & Volume (Units) Analysis and Forecast By Animal Type, 2024 to 2034
        6.3.1. Large Animals
        6.3.2. Small Animals
    6.4. Y-o-Y Growth Trend Analysis By Animal Type, 2019 to 2023
    6.5. Absolute $ Opportunity Analysis By Animal Type, 2024 to 2034
7. Global Market Analysis 2019 to 2023 and Forecast 2024 to 2034, By End User
    7.1. Introduction / Key Findings
    7.2. Historical Market Size Value (US$ Million) & Volume (Units) Analysis By End User, 2019 to 2023
    7.3. Current and Future Market Size Value (US$ Million) & Volume (Units) Analysis and Forecast By End User, 2024 to 2034
        7.3.1. Veterinary Hospitals
        7.3.2. Veterinary Clinics
        7.3.3. Others
    7.4. Y-o-Y Growth Trend Analysis By End User, 2019 to 2023
    7.5. Absolute $ Opportunity Analysis By End User, 2024 to 2034
8. Global Market Analysis 2019 to 2023 and Forecast 2024 to 2034, By Region
    8.1. Introduction
    8.2. Historical Market Size Value (US$ Million) & Volume (Units) Analysis By Region, 2019 to 2023
    8.3. Current Market Size Value (US$ Million) & Volume (Units) Analysis and Forecast By Region, 2024 to 2034
        8.3.1. North America
        8.3.2. Latin America
        8.3.3. Western Europe
        8.3.4. Eastern Europe
        8.3.5. South Asia and Pacific
        8.3.6. East Asia
        8.3.7. Middle East and Africa
    8.4. Market Attractiveness Analysis By Region
9. North America Market Analysis 2019 to 2023 and Forecast 2024 to 2034, By Country
    9.1. Historical Market Size Value (US$ Million) & Volume (Units) Trend Analysis By Market Taxonomy, 2019 to 2023
    9.2. Market Size Value (US$ Million) & Volume (Units) Forecast By Market Taxonomy, 2024 to 2034
        9.2.1. By Country
            9.2.1.1. USA
            9.2.1.2. Canada
        9.2.2. By Product
        9.2.3. By Animal Type
        9.2.4. By End User
    9.3. Market Attractiveness Analysis
        9.3.1. By Country
        9.3.2. By Product
        9.3.3. By Animal Type
        9.3.4. By End User
    9.4. Key Takeaways
10. Latin America Market Analysis 2019 to 2023 and Forecast 2024 to 2034, By Country
    10.1. Historical Market Size Value (US$ Million) & Volume (Units) Trend Analysis By Market Taxonomy, 2019 to 2023
    10.2. Market Size Value (US$ Million) & Volume (Units) Forecast By Market Taxonomy, 2024 to 2034
        10.2.1. By Country
            10.2.1.1. Brazil
            10.2.1.2. Mexico
            10.2.1.3. Rest of Latin America
        10.2.2. By Product
        10.2.3. By Animal Type
        10.2.4. By End User
    10.3. Market Attractiveness Analysis
        10.3.1. By Country
        10.3.2. By Product
        10.3.3. By Animal Type
        10.3.4. By End User
    10.4. Key Takeaways
11. Western Europe Market Analysis 2019 to 2023 and Forecast 2024 to 2034, By Country
    11.1. Historical Market Size Value (US$ Million) & Volume (Units) Trend Analysis By Market Taxonomy, 2019 to 2023
    11.2. Market Size Value (US$ Million) & Volume (Units) Forecast By Market Taxonomy, 2024 to 2034
        11.2.1. By Country
            11.2.1.1. Germany
            11.2.1.2. UK
            11.2.1.3. France
            11.2.1.4. Spain
            11.2.1.5. Italy
            11.2.1.6. Rest of Western Europe
        11.2.2. By Product
        11.2.3. By Animal Type
        11.2.4. By End User
    11.3. Market Attractiveness Analysis
        11.3.1. By Country
        11.3.2. By Product
        11.3.3. By Animal Type
        11.3.4. By End User
    11.4. Key Takeaways
12. Eastern Europe Market Analysis 2019 to 2023 and Forecast 2024 to 2034, By Country
    12.1. Historical Market Size Value (US$ Million) & Volume (Units) Trend Analysis By Market Taxonomy, 2019 to 2023
    12.2. Market Size Value (US$ Million) & Volume (Units) Forecast By Market Taxonomy, 2024 to 2034
        12.2.1. By Country
            12.2.1.1. Poland
            12.2.1.2. Russia
            12.2.1.3. Czech Republic
            12.2.1.4. Romania
            12.2.1.5. Rest of Eastern Europe
        12.2.2. By Product
        12.2.3. By Animal Type
        12.2.4. By End User
    12.3. Market Attractiveness Analysis
        12.3.1. By Country
        12.3.2. By Product
        12.3.3. By Animal Type
        12.3.4. By End User
    12.4. Key Takeaways
13. South Asia and Pacific Market Analysis 2019 to 2023 and Forecast 2024 to 2034, By Country
    13.1. Historical Market Size Value (US$ Million) & Volume (Units) Trend Analysis By Market Taxonomy, 2019 to 2023
    13.2. Market Size Value (US$ Million) & Volume (Units) Forecast By Market Taxonomy, 2024 to 2034
        13.2.1. By Country
            13.2.1.1. India
            13.2.1.2. Bangladesh
            13.2.1.3. Australia
            13.2.1.4. New Zealand
            13.2.1.5. Rest of South Asia and Pacific
        13.2.2. By Product
        13.2.3. By Animal Type
        13.2.4. By End User
    13.3. Market Attractiveness Analysis
        13.3.1. By Country
        13.3.2. By Product
        13.3.3. By Animal Type
        13.3.4. By End User
    13.4. Key Takeaways
14. East Asia Market Analysis 2019 to 2023 and Forecast 2024 to 2034, By Country
    14.1. Historical Market Size Value (US$ Million) & Volume (Units) Trend Analysis By Market Taxonomy, 2019 to 2023
    14.2. Market Size Value (US$ Million) & Volume (Units) Forecast By Market Taxonomy, 2024 to 2034
        14.2.1. By Country
            14.2.1.1. China
            14.2.1.2. Japan
            14.2.1.3. South Korea
        14.2.2. By Product
        14.2.3. By Animal Type
        14.2.4. By End User
    14.3. Market Attractiveness Analysis
        14.3.1. By Country
        14.3.2. By Product
        14.3.3. By Animal Type
        14.3.4. By End User
    14.4. Key Takeaways
15. Middle East and Africa Market Analysis 2019 to 2023 and Forecast 2024 to 2034, By Country
    15.1. Historical Market Size Value (US$ Million) & Volume (Units) Trend Analysis By Market Taxonomy, 2019 to 2023
    15.2. Market Size Value (US$ Million) & Volume (Units) Forecast By Market Taxonomy, 2024 to 2034
        15.2.1. By Country
            15.2.1.1. GCC Countries
            15.2.1.2. South Africa
            15.2.1.3. Israel
            15.2.1.4. Rest of MEA
        15.2.2. By Product
        15.2.3. By Animal Type
        15.2.4. By End User
    15.3. Market Attractiveness Analysis
        15.3.1. By Country
        15.3.2. By Product
        15.3.3. By Animal Type
        15.3.4. By End User
    15.4. Key Takeaways
16. Key Countries Market Analysis
    16.1. USA
        16.1.1. Pricing Analysis
        16.1.2. Market Share Analysis, 2023
            16.1.2.1. By Product
            16.1.2.2. By Animal Type
            16.1.2.3. By End User
    16.2. Canada
        16.2.1. Pricing Analysis
        16.2.2. Market Share Analysis, 2023
            16.2.2.1. By Product
            16.2.2.2. By Animal Type
            16.2.2.3. By End User
    16.3. Brazil
        16.3.1. Pricing Analysis
        16.3.2. Market Share Analysis, 2023
            16.3.2.1. By Product
            16.3.2.2. By Animal Type
            16.3.2.3. By End User
    16.4. Mexico
        16.4.1. Pricing Analysis
        16.4.2. Market Share Analysis, 2023
            16.4.2.1. By Product
            16.4.2.2. By Animal Type
            16.4.2.3. By End User
    16.5. Germany
        16.5.1. Pricing Analysis
        16.5.2. Market Share Analysis, 2023
            16.5.2.1. By Product
            16.5.2.2. By Animal Type
            16.5.2.3. By End User
    16.6. UK
        16.6.1. Pricing Analysis
        16.6.2. Market Share Analysis, 2023
            16.6.2.1. By Product
            16.6.2.2. By Animal Type
            16.6.2.3. By End User
    16.7. France
        16.7.1. Pricing Analysis
        16.7.2. Market Share Analysis, 2023
            16.7.2.1. By Product
            16.7.2.2. By Animal Type
            16.7.2.3. By End User
    16.8. Spain
        16.8.1. Pricing Analysis
        16.8.2. Market Share Analysis, 2023
            16.8.2.1. By Product
            16.8.2.2. By Animal Type
            16.8.2.3. By End User
    16.9. Italy
        16.9.1. Pricing Analysis
        16.9.2. Market Share Analysis, 2023
            16.9.2.1. By Product
            16.9.2.2. By Animal Type
            16.9.2.3. By End User
    16.10. Poland
        16.10.1. Pricing Analysis
        16.10.2. Market Share Analysis, 2023
            16.10.2.1. By Product
            16.10.2.2. By Animal Type
            16.10.2.3. By End User
    16.11. Russia
        16.11.1. Pricing Analysis
        16.11.2. Market Share Analysis, 2023
            16.11.2.1. By Product
            16.11.2.2. By Animal Type
            16.11.2.3. By End User
    16.12. Czech Republic
        16.12.1. Pricing Analysis
        16.12.2. Market Share Analysis, 2023
            16.12.2.1. By Product
            16.12.2.2. By Animal Type
            16.12.2.3. By End User
    16.13. Romania
        16.13.1. Pricing Analysis
        16.13.2. Market Share Analysis, 2023
            16.13.2.1. By Product
            16.13.2.2. By Animal Type
            16.13.2.3. By End User
    16.14. India
        16.14.1. Pricing Analysis
        16.14.2. Market Share Analysis, 2023
            16.14.2.1. By Product
            16.14.2.2. By Animal Type
            16.14.2.3. By End User
    16.15. Bangladesh
        16.15.1. Pricing Analysis
        16.15.2. Market Share Analysis, 2023
            16.15.2.1. By Product
            16.15.2.2. By Animal Type
            16.15.2.3. By End User
    16.16. Australia
        16.16.1. Pricing Analysis
        16.16.2. Market Share Analysis, 2023
            16.16.2.1. By Product
            16.16.2.2. By Animal Type
            16.16.2.3. By End User
    16.17. New Zealand
        16.17.1. Pricing Analysis
        16.17.2. Market Share Analysis, 2023
            16.17.2.1. By Product
            16.17.2.2. By Animal Type
            16.17.2.3. By End User
    16.18. China
        16.18.1. Pricing Analysis
        16.18.2. Market Share Analysis, 2023
            16.18.2.1. By Product
            16.18.2.2. By Animal Type
            16.18.2.3. By End User
    16.19. Japan
        16.19.1. Pricing Analysis
        16.19.2. Market Share Analysis, 2023
            16.19.2.1. By Product
            16.19.2.2. By Animal Type
            16.19.2.3. By End User
    16.20. South Korea
        16.20.1. Pricing Analysis
        16.20.2. Market Share Analysis, 2023
            16.20.2.1. By Product
            16.20.2.2. By Animal Type
            16.20.2.3. By End User
    16.21. GCC Countries
        16.21.1. Pricing Analysis
        16.21.2. Market Share Analysis, 2023
            16.21.2.1. By Product
            16.21.2.2. By Animal Type
            16.21.2.3. By End User
    16.22. South Africa
        16.22.1. Pricing Analysis
        16.22.2. Market Share Analysis, 2023
            16.22.2.1. By Product
            16.22.2.2. By Animal Type
            16.22.2.3. By End User
    16.23. Israel
        16.23.1. Pricing Analysis
        16.23.2. Market Share Analysis, 2023
            16.23.2.1. By Product
            16.23.2.2. By Animal Type
            16.23.2.3. By End User
17. Market Structure Analysis
    17.1. Competition Dashboard
    17.2. Competition Benchmarking
    17.3. Market Share Analysis of Top Players
        17.3.1. By Regional
        17.3.2. By Product
        17.3.3. By Animal Type
        17.3.4. By End User
18. Competition Analysis
    18.1. Competition Deep Dive
        18.1.1. Integra LifeSciences
            18.1.1.1. Overview
            18.1.1.2. Product Portfolio
            18.1.1.3. Profitability by Market Segments
            18.1.1.4. Sales Footprint
            18.1.1.5. Strategy Overview
                18.1.1.5.1. Marketing Strategy
                18.1.1.5.2. Product Strategy
                18.1.1.5.3. Channel Strategy
        18.1.2. Cislak Manufacturing
            18.1.2.1. Overview
            18.1.2.2. Product Portfolio
            18.1.2.3. Profitability by Market Segments
            18.1.2.4. Sales Footprint
            18.1.2.5. Strategy Overview
                18.1.2.5.1. Marketing Strategy
                18.1.2.5.2. Product Strategy
                18.1.2.5.3. Channel Strategy
        18.1.3. Eickemeyer Veterinary Equipment Inc
            18.1.3.1. Overview
            18.1.3.2. Product Portfolio
            18.1.3.3. Profitability by Market Segments
            18.1.3.4. Sales Footprint
            18.1.3.5. Strategy Overview
                18.1.3.5.1. Marketing Strategy
                18.1.3.5.2. Product Strategy
                18.1.3.5.3. Channel Strategy
        18.1.4. MAI Animal Health
            18.1.4.1. Overview
            18.1.4.2. Product Portfolio
            18.1.4.3. Profitability by Market Segments
            18.1.4.4. Sales Footprint
            18.1.4.5. Strategy Overview
                18.1.4.5.1. Marketing Strategy
                18.1.4.5.2. Product Strategy
                18.1.4.5.3. Channel Strategy
        18.1.5. Dentalaire International
            18.1.5.1. Overview
            18.1.5.2. Product Portfolio
            18.1.5.3. Profitability by Market Segments
            18.1.5.4. Sales Footprint
            18.1.5.5. Strategy Overview
                18.1.5.5.1. Marketing Strategy
                18.1.5.5.2. Product Strategy
                18.1.5.5.3. Channel Strategy
        18.1.6. Midmark Corporation
            18.1.6.1. Overview
            18.1.6.2. Product Portfolio
            18.1.6.3. Profitability by Market Segments
            18.1.6.4. Sales Footprint
            18.1.6.5. Strategy Overview
                18.1.6.5.1. Marketing Strategy
                18.1.6.5.2. Product Strategy
                18.1.6.5.3. Channel Strategy
        18.1.7. Planmeca OY
            18.1.7.1. Overview
            18.1.7.2. Product Portfolio
            18.1.7.3. Profitability by Market Segments
            18.1.7.4. Sales Footprint
            18.1.7.5. Strategy Overview
                18.1.7.5.1. Marketing Strategy
                18.1.7.5.2. Product Strategy
                18.1.7.5.3. Channel Strategy
        18.1.8. J & J Instruments
            18.1.8.1. Overview
            18.1.8.2. Product Portfolio
            18.1.8.3. Profitability by Market Segments
            18.1.8.4. Sales Footprint
            18.1.8.5. Strategy Overview
                18.1.8.5.1. Marketing Strategy
                18.1.8.5.2. Product Strategy
                18.1.8.5.3. Channel Strategy
        18.1.9. iM3Vet Pty Ltd.
            18.1.9.1. Overview
            18.1.9.2. Product Portfolio
            18.1.9.3. Profitability by Market Segments
            18.1.9.4. Sales Footprint
            18.1.9.5. Strategy Overview
                18.1.9.5.1. Marketing Strategy
                18.1.9.5.2. Product Strategy
                18.1.9.5.3. Channel Strategy
        18.1.10. Acteon group ltd.
            18.1.10.1. Overview
            18.1.10.2. Product Portfolio
            18.1.10.3. Profitability by Market Segments
            18.1.10.4. Sales Footprint
            18.1.10.5. Strategy Overview
                18.1.10.5.1. Marketing Strategy
                18.1.10.5.2. Product Strategy
                18.1.10.5.3. Channel Strategy
19. Assumptions & Acronyms Used
20. Research Methodology
Recommendations

Healthcare

Veterinary Vaccines Market

August 2024

REP-GB-409

326 pages

Healthcare

Veterinary Biologics Market

January 2024

REP-GB-2288

232 pages

Healthcare

Veterinary Wound Cleansers Market

July 2023

REP-GB-17793

230 pages

Explore Healthcare Insights

View Reports
Future Market Insights

Veterinary Dental Equipment Market

Schedule a Call