Veterinary Scales Market Size and Share Forecast Outlook 2025 to 2035

The Veterinary Scales Market is estimated to be valued at USD 280.5 million in 2025 and is projected to reach USD 474.6 million by 2035, registering a compound annual growth rate (CAGR) of 5.4% over the forecast period.
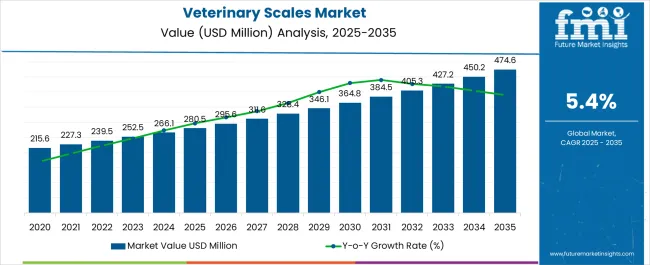
Quick Stats for Veterinary Scales Market

  • Veterinary Scales Market Value (2025): USD 280.5 million
  • Veterinary Scales Market Forecast Value (2035): USD 474.6 million
  • Veterinary Scales Market Forecast CAGR: 5.4%
  • Leading Segment in Veterinary Scales Market in 2025: Electronic Veterinary Weighing Scales (50.3%)
  • Key Growth Regions in Veterinary Scales Market: North America, Asia-Pacific, Europe
  • Top Key Players in Veterinary Scales Market: Avante Animal Health, Adam Equipment, Apexx Veterinary Equipment, Avery Weigh-Tronix, A&D Company Limited, Bosche, Brecknell, Detecto Scales, Kern & Sohn, Marsden Group, Phantom Scales, Rice Lake Weighing Systems

Veterinary Scales Market Market Value Analysis

Veterinary Scales Market Key Takeaways

Metric Value
Veterinary Scales Market Estimated Value in (2025 E) USD 280.5 million
Veterinary Scales Market Forecast Value in (2035 F) USD 474.6 million
Forecast CAGR (2025 to 2035) 5.4%

Why is the Veterinary Scales Market Growing?

The Veterinary Scales market is experiencing steady growth, driven by the increasing demand for accurate and reliable weighing solutions in the livestock and veterinary sectors. Rising awareness of animal health, feed optimization, and weight monitoring has heightened the adoption of advanced weighing technologies. The market is further supported by technological innovations such as electronic veterinary weighing scales, which provide enhanced precision, real-time data capture, and integration capabilities with farm management systems.

These scales improve operational efficiency, reduce human error, and facilitate better herd management practices. The growing focus on disease prevention, proper dosage administration, and nutritional management is also driving adoption, particularly in large-scale livestock operations. Platform configurations that allow easy handling of animals and ensure accurate measurement under various conditions are becoming increasingly preferred.

As veterinary care and livestock management standards evolve, the demand for sophisticated weighing solutions is expected to rise Investments in smart farming technologies, combined with the push for digital monitoring and regulatory compliance, are likely to sustain market expansion in the coming years.

Segmental Analysis:

The veterinary scales market is segmented by technology, configuration type, application, end user, and geographic regions. By technology, veterinary scales market is divided into Electronic Veterinary Weighing Scales and Mechanical Veterinary Weighing Scales. In terms of configuration type, veterinary scales market is classified into Platform, Bench-Top, Portable, and Compact. Based on application, veterinary scales market is segmented into Large Animals - Livestock, Small Animals - Pets, Equines, and Feline. By end user, veterinary scales market is segmented into Veterinary Hospitals, Veterinary Clinics, Home Use, and Others. Regionally, the veterinary scales industry is classified into North America, Latin America, Western Europe, Eastern Europe, Balkan & Baltic Countries, Russia & Belarus, Central Asia, East Asia, South Asia & Pacific, and the Middle East & Africa.

Insights into the Electronic Veterinary Weighing Scales Technology Segment

The electronic veterinary weighing scales segment is projected to hold 50.3% of the market revenue in 2025, establishing it as the leading technology type. Growth in this segment is being driven by the precision, automation, and data management capabilities offered by electronic systems compared with traditional mechanical scales. Real-time measurement, digital display, and connectivity options allow veterinarians and livestock managers to record, monitor, and analyze animal weights efficiently.

These features support improved herd health management, feed optimization, and treatment planning. Electronic scales are preferred in modern veterinary practices and large-scale farms due to their reliability, ease of use, and compatibility with software platforms for integrated monitoring.

The ability to generate accurate, traceable records for regulatory and operational purposes further reinforces adoption With increasing emphasis on productivity, animal welfare, and technological integration in agricultural operations, the electronic veterinary weighing scales segment is expected to maintain its leading position, supported by continuous innovation and growing demand for efficient weight management solutions.

Insights into the Platform Configuration Type Segment

The platform configuration segment is anticipated to account for 40.7% of the market revenue in 2025, making it the leading configuration type. Its growth is driven by the ability to accommodate a wide range of animal sizes while ensuring stability and accurate weight measurement. Platforms provide ease of loading, reducing stress for both animals and handlers, and enabling safer weighing operations.

Integration with digital readouts, sensors, and software platforms allows for seamless data collection and analysis, supporting informed veterinary and management decisions. This configuration is particularly favored in large livestock operations and veterinary facilities where high throughput and operational efficiency are critical.

The durability, adaptability, and precision offered by platform scales enhance their preference among end users As the need for accurate, real-time weight monitoring continues to rise, the platform configuration segment is expected to sustain its market leadership, bolstered by ongoing improvements in scale design, data management integration, and animal handling efficiency.

Insights into the Large Animals - Livestock Application Segment

The large animals - livestock application segment is projected to hold 37.5% of the market revenue in 2025, establishing it as the leading application area. Growth is being driven by the critical need for accurate weight monitoring to support animal health management, nutritional planning, and growth tracking in cattle, horses, and other large livestock. Accurate weighing facilitates effective dosing of medications, feed allocation, and early detection of health issues, contributing to overall herd productivity and welfare.

The adoption of electronic and platform-based scales in large animal management ensures precise measurement under challenging conditions, including varying terrain and animal behavior. Integration with farm management systems enables automated record-keeping, trend analysis, and regulatory compliance reporting.

The increasing scale of commercial livestock farming and emphasis on efficiency, productivity, and animal welfare are reinforcing demand for large animal weighing solutions As farms and veterinary facilities continue to prioritize accurate, efficient, and safe weight measurement, the large animals - livestock application segment is expected to remain a key driver of market growth.

Market Overview

Veterinary Scales: Market Insights

Veterinary weighing scale, in general is a measuring instrument that is used for performing primary physical examination of different animals. These are the essential devices that are easily found in almost every veterinary clinic for weighing animals. A weighing machine constitutes a weighing platform that comprises of an indicator, rubber mat, adapter and the operating manual.

The veterinary scales must be operated in accordance with the appropriate regulations for safe use of devices to ensure no harm to the device and animals as well. Veterinary scales may get damaged due to overloading of the weighing machine, use of damaged power adapters, operation from other power supply other than mains electricity supply. Veterinary scales deals with the diagnosis and monitoring the weight of large animals – livestock, small pets, equines, felines and others.

Veterinary scales in common find applications in veterinary clinics, offices, zoo or the farms to carry out lab testing, medicines preparation, and monitoring weight and food portions for different animals. They are solid, easy to clean and are made up of removable stainless steel depending upon the requirement of veterinary specialist, pet owners or animal groomers.

The veterinary weighing devices have been developed with an interface to restore the weight of a particular animal that can be used later for different study. Different types of veterinary scales are used in the veterinary clinics and some of the major configurations include platform scales, bench top scales, portable scales and compact veterinary scales.

They have been categorized on the basis of technology as well that consists electronic/digital veterinary weighing scales and mechanical weighing scales. Veterinary Scales are utilized in weight monitoring of a distinct number of animals having distinct weight ranges. The digital scales are designed such that they hold the weight reading on display enabling the veterinary specialist to carry out easy monitoring.

The portable weighing scales however offers flexibility leading to accurate weight measurement in lab testing procedures. Thus the rising demand for technologically advanced veterinary scales is expected to drive the revenue generation in global veterinary scales market. The digital weighing scales are incorporated with tare function to calibrate the machine before using and LED display that enables weight reading in low light.

There are several restraining factors associated with veterinary scales that would hamper the growth for veterinary scales market. Some of these limiting factors include lack of precision and unresponsiveness. However, with the increased overall spending in pet care coupled with innovations in animal care industry, veterinary scales market registers a robust growth.

Veterinary Scales market offers products for various types of animals that involves dogs, cats, large animals such as livestock, canines, felines, equines and others. The veterinary scales market lately has been categorized on the basis of end users that include veterinary clinics, hospitals, home use and others.
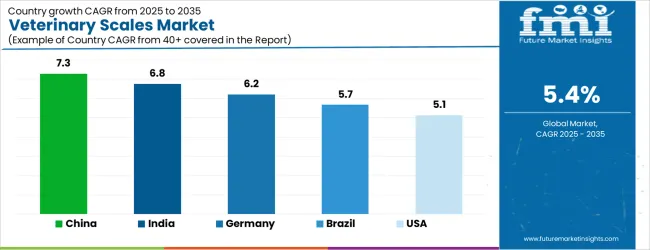
Analysis of Veterinary Scales Market By Key Countries

Veterinary Scales Market Cagr Analysis By Country

Country CAGR
China 7.3%
India 6.8%
Germany 6.2%
Brazil 5.7%
USA 5.1%
U.K. 4.6%
Japan 4.1%

Country-wise Analysis

The Veterinary Scales Market is expected to register a CAGR of 5.4% during the forecast period, exhibiting varied country level momentum. China leads with the highest CAGR of 7.3%, followed by India at 6.8%. Developed markets such as Germany, France, and the U.K. continue to expand steadily, while the U.S. is likely to grow at consistent rates. Japan posts the lowest CAGR at 4.1%, yet still underscores a broadly positive trajectory for the global Veterinary Scales Market. In 2024, Germany held a dominant revenue in the Western Europe market and is expected to grow with a CAGR of 6.2%. The U.S. Veterinary Scales Market is estimated to be valued at USD 100.0 million in 2025 and is anticipated to reach a valuation of USD 100.0 million by 2035. Sales are projected to rise at a CAGR of 0.0% over the forecast period between 2025 and 2035. While Japan and South Korea markets are estimated to be valued at USD 13.1 million and USD 9.1 million respectively in 2025.
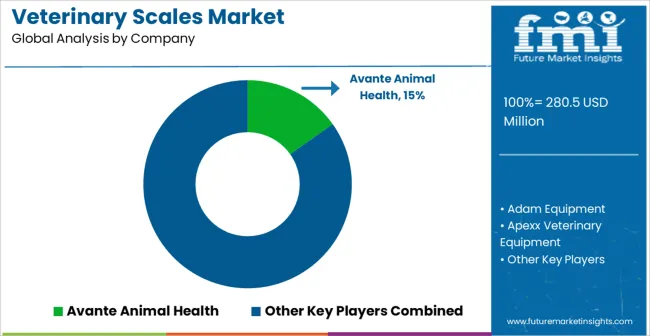
Key Players in the Veterinary Scales Market

Veterinary Scales Market Analysis By Company

  • Avante Animal Health
  • Adam Equipment
  • Apexx Veterinary Equipment
  • Avery Weigh-Tronix
  • A&D Company Limited
  • Bosche
  • Brecknell
  • Detecto Scales
  • Kern & Sohn
  • Marsden Group
  • Phantom Scales
  • Rice Lake Weighing Systems

Scope of the Report

Item Value
Quantitative Units USD 280.5 Million
Technology Electronic Veterinary Weighing Scales and Mechanical Veterinary Weighing Scales
Configuration Type Platform, Bench-Top, Portable, and Compact
Application Large Animals - Livestock, Small Animals - Pets, Equines, and Feline
End User Veterinary Hospitals, Veterinary Clinics, Home Use, and Others
Regions Covered North America, Europe, Asia-Pacific, Latin America, Middle East & Africa
Country Covered United States, Canada, Germany, France, United Kingdom, China, Japan, India, Brazil, South Africa
Key Companies Profiled Avante Animal Health, Adam Equipment, Apexx Veterinary Equipment, Avery Weigh-Tronix, A&D Company Limited, Bosche, Brecknell, Detecto Scales, Kern & Sohn, Marsden Group, Phantom Scales, and Rice Lake Weighing Systems

Veterinary Scales Market by Segments

Technology:

  • Electronic Veterinary Weighing Scales
  • Mechanical Veterinary Weighing Scales

Configuration Type:

  • Platform
  • Bench-Top
  • Portable
  • Compact

Application:

  • Large Animals - Livestock
  • Small Animals - Pets
  • Equines
  • Feline

End User:

  • Veterinary Hospitals
  • Veterinary Clinics
  • Home Use
  • Others

Region:

  • North America
    • U.S.
    • Canada
    • Mexico
  • Latin America
    • Brazil
    • Chile
    • Rest of Latin America
  • Western Europe
    • Germany
    • U.K.
    • Italy
    • Spain
    • France
    • Nordic
    • BENELUX
    • Rest of Western Europe
  • Eastern Europe
    • Russia
    • Poland
    • Hungary
    • Balkan & Baltic
    • Rest of Eastern Europe
  • East Asia
    • China
    • Japan
    • South Korea
  • South Asia and Pacific
    • India
    • ASEAN
    • Australia & New Zealand
    • Rest of South Asia and Pacific
  • Middle East & Africa
    • Kingdom of Saudi Arabia
    • Other GCC Countries
    • Turkiye
    • South Africa
    • Other African Union
    • Rest of Middle East & Africa

Table of Content

  1. Executive Summary
    • Global Market Outlook
    • Demand-side Trends
    • Supply-side Trends
    • Technology Roadmap Analysis
    • Analysis and Recommendations
  2. Market Overview
    • Market Coverage / Taxonomy
    • Market Definition / Scope / Limitations
  3. Market Background
    • Market Dynamics
      • Drivers
      • Restraints
      • Opportunity
      • Trends
    • Scenario Forecast
      • Demand in Optimistic Scenario
      • Demand in Likely Scenario
      • Demand in Conservative Scenario
    • Opportunity Map Analysis
    • Product Life Cycle Analysis
    • Supply Chain Analysis
    • Investment Feasibility Matrix
    • Value Chain Analysis
    • PESTLE and Porter’s Analysis
    • Regulatory Landscape
    • Regional Parent Market Outlook
    • Production and Consumption Statistics
    • Import and Export Statistics
  4. Global Market Analysis 2020 to 2024 and Forecast, 2025 to 2035
    • Historical Market Size Value (USD Million) Analysis, 2020 to 2024
    • Current and Future Market Size Value (USD Million) Projections, 2025 to 2035
      • Y-o-Y Growth Trend Analysis
      • Absolute $ Opportunity Analysis
  5. Global Market Pricing Analysis 2020 to 2024 and Forecast 2025 to 2035
  6. Global Market Analysis 2020 to 2024 and Forecast 2025 to 2035, By Technology
    • Introduction / Key Findings
    • Historical Market Size Value (USD Million) Analysis By Technology , 2020 to 2024
    • Current and Future Market Size Value (USD Million) Analysis and Forecast By Technology , 2025 to 2035
      • Electronic Veterinary Weighing Scales
      • Mechanical Veterinary Weighing Scales
    • Y-o-Y Growth Trend Analysis By Technology , 2020 to 2024
    • Absolute $ Opportunity Analysis By Technology , 2025 to 2035
  7. Global Market Analysis 2020 to 2024 and Forecast 2025 to 2035, By Configuration Type
    • Introduction / Key Findings
    • Historical Market Size Value (USD Million) Analysis By Configuration Type, 2020 to 2024
    • Current and Future Market Size Value (USD Million) Analysis and Forecast By Configuration Type, 2025 to 2035
      • Platform
      • Bench-Top
      • Portable
      • Compact
    • Y-o-Y Growth Trend Analysis By Configuration Type, 2020 to 2024
    • Absolute $ Opportunity Analysis By Configuration Type, 2025 to 2035
  8. Global Market Analysis 2020 to 2024 and Forecast 2025 to 2035, By Application
    • Introduction / Key Findings
    • Historical Market Size Value (USD Million) Analysis By Application, 2020 to 2024
    • Current and Future Market Size Value (USD Million) Analysis and Forecast By Application, 2025 to 2035
      • Large Animals - Livestock
      • Small Animals - Pets
      • Equines
      • Feline
    • Y-o-Y Growth Trend Analysis By Application, 2020 to 2024
    • Absolute $ Opportunity Analysis By Application, 2025 to 2035
  9. Global Market Analysis 2020 to 2024 and Forecast 2025 to 2035, By End User
    • Introduction / Key Findings
    • Historical Market Size Value (USD Million) Analysis By End User, 2020 to 2024
    • Current and Future Market Size Value (USD Million) Analysis and Forecast By End User, 2025 to 2035
      • Veterinary Hospitals
      • Veterinary Clinics
      • Home Use
      • Others
    • Y-o-Y Growth Trend Analysis By End User, 2020 to 2024
    • Absolute $ Opportunity Analysis By End User, 2025 to 2035
  10. Global Market Analysis 2020 to 2024 and Forecast 2025 to 2035, By Region
    • Introduction
    • Historical Market Size Value (USD Million) Analysis By Region, 2020 to 2024
    • Current Market Size Value (USD Million) Analysis and Forecast By Region, 2025 to 2035
      • North America
      • Latin America
      • Western Europe
      • Eastern Europe
      • East Asia
      • South Asia and Pacific
      • Middle East & Africa
    • Market Attractiveness Analysis By Region
  11. North America Market Analysis 2020 to 2024 and Forecast 2025 to 2035, By Country
    • Historical Market Size Value (USD Million) Trend Analysis By Market Taxonomy, 2020 to 2024
    • Market Size Value (USD Million) Forecast By Market Taxonomy, 2025 to 2035
      • By Country
        • USA
        • Canada
        • Mexico
      • By Technology
      • By Configuration Type
      • By Application
      • By End User
    • Market Attractiveness Analysis
      • By Country
      • By Technology
      • By Configuration Type
      • By Application
      • By End User
    • Key Takeaways
  12. Latin America Market Analysis 2020 to 2024 and Forecast 2025 to 2035, By Country
    • Historical Market Size Value (USD Million) Trend Analysis By Market Taxonomy, 2020 to 2024
    • Market Size Value (USD Million) Forecast By Market Taxonomy, 2025 to 2035
      • By Country
        • Brazil
        • Chile
        • Rest of Latin America
      • By Technology
      • By Configuration Type
      • By Application
      • By End User
    • Market Attractiveness Analysis
      • By Country
      • By Technology
      • By Configuration Type
      • By Application
      • By End User
    • Key Takeaways
  13. Western Europe Market Analysis 2020 to 2024 and Forecast 2025 to 2035, By Country
    • Historical Market Size Value (USD Million) Trend Analysis By Market Taxonomy, 2020 to 2024
    • Market Size Value (USD Million) Forecast By Market Taxonomy, 2025 to 2035
      • By Country
        • Germany
        • UK
        • Italy
        • Spain
        • France
        • Nordic
        • BENELUX
        • Rest of Western Europe
      • By Technology
      • By Configuration Type
      • By Application
      • By End User
    • Market Attractiveness Analysis
      • By Country
      • By Technology
      • By Configuration Type
      • By Application
      • By End User
    • Key Takeaways
  14. Eastern Europe Market Analysis 2020 to 2024 and Forecast 2025 to 2035, By Country
    • Historical Market Size Value (USD Million) Trend Analysis By Market Taxonomy, 2020 to 2024
    • Market Size Value (USD Million) Forecast By Market Taxonomy, 2025 to 2035
      • By Country
        • Russia
        • Poland
        • Hungary
        • Balkan & Baltic
        • Rest of Eastern Europe
      • By Technology
      • By Configuration Type
      • By Application
      • By End User
    • Market Attractiveness Analysis
      • By Country
      • By Technology
      • By Configuration Type
      • By Application
      • By End User
    • Key Takeaways
  15. East Asia Market Analysis 2020 to 2024 and Forecast 2025 to 2035, By Country
    • Historical Market Size Value (USD Million) Trend Analysis By Market Taxonomy, 2020 to 2024
    • Market Size Value (USD Million) Forecast By Market Taxonomy, 2025 to 2035
      • By Country
        • China
        • Japan
        • South Korea
      • By Technology
      • By Configuration Type
      • By Application
      • By End User
    • Market Attractiveness Analysis
      • By Country
      • By Technology
      • By Configuration Type
      • By Application
      • By End User
    • Key Takeaways
  16. South Asia and Pacific Market Analysis 2020 to 2024 and Forecast 2025 to 2035, By Country
    • Historical Market Size Value (USD Million) Trend Analysis By Market Taxonomy, 2020 to 2024
    • Market Size Value (USD Million) Forecast By Market Taxonomy, 2025 to 2035
      • By Country
        • India
        • ASEAN
        • Australia & New Zealand
        • Rest of South Asia and Pacific
      • By Technology
      • By Configuration Type
      • By Application
      • By End User
    • Market Attractiveness Analysis
      • By Country
      • By Technology
      • By Configuration Type
      • By Application
      • By End User
    • Key Takeaways
  17. Middle East & Africa Market Analysis 2020 to 2024 and Forecast 2025 to 2035, By Country
    • Historical Market Size Value (USD Million) Trend Analysis By Market Taxonomy, 2020 to 2024
    • Market Size Value (USD Million) Forecast By Market Taxonomy, 2025 to 2035
      • By Country
        • Kingdom of Saudi Arabia
        • Other GCC Countries
        • Turkiye
        • South Africa
        • Other African Union
        • Rest of Middle East & Africa
      • By Technology
      • By Configuration Type
      • By Application
      • By End User
    • Market Attractiveness Analysis
      • By Country
      • By Technology
      • By Configuration Type
      • By Application
      • By End User
    • Key Takeaways
  18. Key Countries Market Analysis
    • USA
      • Pricing Analysis
      • Market Share Analysis, 2024
        • By Technology
        • By Configuration Type
        • By Application
        • By End User
    • Canada
      • Pricing Analysis
      • Market Share Analysis, 2024
        • By Technology
        • By Configuration Type
        • By Application
        • By End User
    • Mexico
      • Pricing Analysis
      • Market Share Analysis, 2024
        • By Technology
        • By Configuration Type
        • By Application
        • By End User
    • Brazil
      • Pricing Analysis
      • Market Share Analysis, 2024
        • By Technology
        • By Configuration Type
        • By Application
        • By End User
    • Chile
      • Pricing Analysis
      • Market Share Analysis, 2024
        • By Technology
        • By Configuration Type
        • By Application
        • By End User
    • Germany
      • Pricing Analysis
      • Market Share Analysis, 2024
        • By Technology
        • By Configuration Type
        • By Application
        • By End User
    • UK
      • Pricing Analysis
      • Market Share Analysis, 2024
        • By Technology
        • By Configuration Type
        • By Application
        • By End User
    • Italy
      • Pricing Analysis
      • Market Share Analysis, 2024
        • By Technology
        • By Configuration Type
        • By Application
        • By End User
    • Spain
      • Pricing Analysis
      • Market Share Analysis, 2024
        • By Technology
        • By Configuration Type
        • By Application
        • By End User
    • France
      • Pricing Analysis
      • Market Share Analysis, 2024
        • By Technology
        • By Configuration Type
        • By Application
        • By End User
    • India
      • Pricing Analysis
      • Market Share Analysis, 2024
        • By Technology
        • By Configuration Type
        • By Application
        • By End User
    • ASEAN
      • Pricing Analysis
      • Market Share Analysis, 2024
        • By Technology
        • By Configuration Type
        • By Application
        • By End User
    • Australia & New Zealand
      • Pricing Analysis
      • Market Share Analysis, 2024
        • By Technology
        • By Configuration Type
        • By Application
        • By End User
    • China
      • Pricing Analysis
      • Market Share Analysis, 2024
        • By Technology
        • By Configuration Type
        • By Application
        • By End User
    • Japan
      • Pricing Analysis
      • Market Share Analysis, 2024
        • By Technology
        • By Configuration Type
        • By Application
        • By End User
    • South Korea
      • Pricing Analysis
      • Market Share Analysis, 2024
        • By Technology
        • By Configuration Type
        • By Application
        • By End User
    • Russia
      • Pricing Analysis
      • Market Share Analysis, 2024
        • By Technology
        • By Configuration Type
        • By Application
        • By End User
    • Poland
      • Pricing Analysis
      • Market Share Analysis, 2024
        • By Technology
        • By Configuration Type
        • By Application
        • By End User
    • Hungary
      • Pricing Analysis
      • Market Share Analysis, 2024
        • By Technology
        • By Configuration Type
        • By Application
        • By End User
    • Kingdom of Saudi Arabia
      • Pricing Analysis
      • Market Share Analysis, 2024
        • By Technology
        • By Configuration Type
        • By Application
        • By End User
    • Turkiye
      • Pricing Analysis
      • Market Share Analysis, 2024
        • By Technology
        • By Configuration Type
        • By Application
        • By End User
    • South Africa
      • Pricing Analysis
      • Market Share Analysis, 2024
        • By Technology
        • By Configuration Type
        • By Application
        • By End User
  19. Market Structure Analysis
    • Competition Dashboard
    • Competition Benchmarking
    • Market Share Analysis of Top Players
      • By Regional
      • By Technology
      • By Configuration Type
      • By Application
      • By End User
  20. Competition Analysis
    • Competition Deep Dive
      • Avante Animal Health
        • Overview
        • Product Portfolio
        • Profitability by Market Segments (Product/Age /Sales Channel/Region)
        • Sales Footprint
        • Strategy Overview
          • Marketing Strategy
          • Product Strategy
          • Channel Strategy
      • Adam Equipment
      • Apexx Veterinary Equipment
      • Avery Weigh-Tronix
      • A&D Company Limited
      • Bosche
      • Brecknell
      • Detecto Scales
      • Kern & Sohn
      • Marsden Group
      • Phantom Scales
      • Rice Lake Weighing Systems
  21. Assumptions & Acronyms Used
  22. Research Methodology

List of Tables

  • Table 1: Global Market Value (USD Million) Forecast by Region, 2020-2035
  • Table 2: Global Market Value (USD Million) Forecast by Technology , 2020-2035
  • Table 3: Global Market Value (USD Million) Forecast by Configuration Type, 2020-2035
  • Table 4: Global Market Value (USD Million) Forecast by Application, 2020-2035
  • Table 5: Global Market Value (USD Million) Forecast by End User, 2020-2035
  • Table 6: North America Market Value (USD Million) Forecast by Country, 2020-2035
  • Table 7: North America Market Value (USD Million) Forecast by Technology , 2020-2035
  • Table 8: North America Market Value (USD Million) Forecast by Configuration Type, 2020-2035
  • Table 9: North America Market Value (USD Million) Forecast by Application, 2020-2035
  • Table 10: North America Market Value (USD Million) Forecast by End User, 2020-2035
  • Table 11: Latin America Market Value (USD Million) Forecast by Country, 2020-2035
  • Table 12: Latin America Market Value (USD Million) Forecast by Technology , 2020-2035
  • Table 13: Latin America Market Value (USD Million) Forecast by Configuration Type, 2020-2035
  • Table 14: Latin America Market Value (USD Million) Forecast by Application, 2020-2035
  • Table 15: Latin America Market Value (USD Million) Forecast by End User, 2020-2035
  • Table 16: Western Europe Market Value (USD Million) Forecast by Country, 2020-2035
  • Table 17: Western Europe Market Value (USD Million) Forecast by Technology , 2020-2035
  • Table 18: Western Europe Market Value (USD Million) Forecast by Configuration Type, 2020-2035
  • Table 19: Western Europe Market Value (USD Million) Forecast by Application, 2020-2035
  • Table 20: Western Europe Market Value (USD Million) Forecast by End User, 2020-2035
  • Table 21: Eastern Europe Market Value (USD Million) Forecast by Country, 2020-2035
  • Table 22: Eastern Europe Market Value (USD Million) Forecast by Technology , 2020-2035
  • Table 23: Eastern Europe Market Value (USD Million) Forecast by Configuration Type, 2020-2035
  • Table 24: Eastern Europe Market Value (USD Million) Forecast by Application, 2020-2035
  • Table 25: Eastern Europe Market Value (USD Million) Forecast by End User, 2020-2035
  • Table 26: East Asia Market Value (USD Million) Forecast by Country, 2020-2035
  • Table 27: East Asia Market Value (USD Million) Forecast by Technology , 2020-2035
  • Table 28: East Asia Market Value (USD Million) Forecast by Configuration Type, 2020-2035
  • Table 29: East Asia Market Value (USD Million) Forecast by Application, 2020-2035
  • Table 30: East Asia Market Value (USD Million) Forecast by End User, 2020-2035
  • Table 31: South Asia and Pacific Market Value (USD Million) Forecast by Country, 2020-2035
  • Table 32: South Asia and Pacific Market Value (USD Million) Forecast by Technology , 2020-2035
  • Table 33: South Asia and Pacific Market Value (USD Million) Forecast by Configuration Type, 2020-2035
  • Table 34: South Asia and Pacific Market Value (USD Million) Forecast by Application, 2020-2035
  • Table 35: South Asia and Pacific Market Value (USD Million) Forecast by End User, 2020-2035
  • Table 36: Middle East & Africa Market Value (USD Million) Forecast by Country, 2020-2035
  • Table 37: Middle East & Africa Market Value (USD Million) Forecast by Technology , 2020-2035
  • Table 38: Middle East & Africa Market Value (USD Million) Forecast by Configuration Type, 2020-2035
  • Table 39: Middle East & Africa Market Value (USD Million) Forecast by Application, 2020-2035
  • Table 40: Middle East & Africa Market Value (USD Million) Forecast by End User, 2020-2035

List of Figures

  • Figure 1: Global Market Pricing Analysis
  • Figure 2: Global Market Value (USD Million) Forecast 2020-2035
  • Figure 3: Global Market Value Share and BPS Analysis by Technology , 2025 and 2035
  • Figure 4: Global Market Y-o-Y Growth Comparison by Technology , 2025-2035
  • Figure 5: Global Market Attractiveness Analysis by Technology
  • Figure 6: Global Market Value Share and BPS Analysis by Configuration Type, 2025 and 2035
  • Figure 7: Global Market Y-o-Y Growth Comparison by Configuration Type, 2025-2035
  • Figure 8: Global Market Attractiveness Analysis by Configuration Type
  • Figure 9: Global Market Value Share and BPS Analysis by Application, 2025 and 2035
  • Figure 10: Global Market Y-o-Y Growth Comparison by Application, 2025-2035
  • Figure 11: Global Market Attractiveness Analysis by Application
  • Figure 12: Global Market Value Share and BPS Analysis by End User, 2025 and 2035
  • Figure 13: Global Market Y-o-Y Growth Comparison by End User, 2025-2035
  • Figure 14: Global Market Attractiveness Analysis by End User
  • Figure 15: Global Market Value (USD Million) Share and BPS Analysis by Region, 2025 and 2035
  • Figure 16: Global Market Y-o-Y Growth Comparison by Region, 2025-2035
  • Figure 17: Global Market Attractiveness Analysis by Region
  • Figure 18: North America Market Incremental Dollar Opportunity, 2025-2035
  • Figure 19: Latin America Market Incremental Dollar Opportunity, 2025-2035
  • Figure 20: Western Europe Market Incremental Dollar Opportunity, 2025-2035
  • Figure 21: Eastern Europe Market Incremental Dollar Opportunity, 2025-2035
  • Figure 22: East Asia Market Incremental Dollar Opportunity, 2025-2035
  • Figure 23: South Asia and Pacific Market Incremental Dollar Opportunity, 2025-2035
  • Figure 24: Middle East & Africa Market Incremental Dollar Opportunity, 2025-2035
  • Figure 25: North America Market Value Share and BPS Analysis by Country, 2025 and 2035
  • Figure 26: North America Market Value Share and BPS Analysis by Technology , 2025 and 2035
  • Figure 27: North America Market Y-o-Y Growth Comparison by Technology , 2025-2035
  • Figure 28: North America Market Attractiveness Analysis by Technology
  • Figure 29: North America Market Value Share and BPS Analysis by Configuration Type, 2025 and 2035
  • Figure 30: North America Market Y-o-Y Growth Comparison by Configuration Type, 2025-2035
  • Figure 31: North America Market Attractiveness Analysis by Configuration Type
  • Figure 32: North America Market Value Share and BPS Analysis by Application, 2025 and 2035
  • Figure 33: North America Market Y-o-Y Growth Comparison by Application, 2025-2035
  • Figure 34: North America Market Attractiveness Analysis by Application
  • Figure 35: North America Market Value Share and BPS Analysis by End User, 2025 and 2035
  • Figure 36: North America Market Y-o-Y Growth Comparison by End User, 2025-2035
  • Figure 37: North America Market Attractiveness Analysis by End User
  • Figure 38: Latin America Market Value Share and BPS Analysis by Country, 2025 and 2035
  • Figure 39: Latin America Market Value Share and BPS Analysis by Technology , 2025 and 2035
  • Figure 40: Latin America Market Y-o-Y Growth Comparison by Technology , 2025-2035
  • Figure 41: Latin America Market Attractiveness Analysis by Technology
  • Figure 42: Latin America Market Value Share and BPS Analysis by Configuration Type, 2025 and 2035
  • Figure 43: Latin America Market Y-o-Y Growth Comparison by Configuration Type, 2025-2035
  • Figure 44: Latin America Market Attractiveness Analysis by Configuration Type
  • Figure 45: Latin America Market Value Share and BPS Analysis by Application, 2025 and 2035
  • Figure 46: Latin America Market Y-o-Y Growth Comparison by Application, 2025-2035
  • Figure 47: Latin America Market Attractiveness Analysis by Application
  • Figure 48: Latin America Market Value Share and BPS Analysis by End User, 2025 and 2035
  • Figure 49: Latin America Market Y-o-Y Growth Comparison by End User, 2025-2035
  • Figure 50: Latin America Market Attractiveness Analysis by End User
  • Figure 51: Western Europe Market Value Share and BPS Analysis by Country, 2025 and 2035
  • Figure 52: Western Europe Market Value Share and BPS Analysis by Technology , 2025 and 2035
  • Figure 53: Western Europe Market Y-o-Y Growth Comparison by Technology , 2025-2035
  • Figure 54: Western Europe Market Attractiveness Analysis by Technology
  • Figure 55: Western Europe Market Value Share and BPS Analysis by Configuration Type, 2025 and 2035
  • Figure 56: Western Europe Market Y-o-Y Growth Comparison by Configuration Type, 2025-2035
  • Figure 57: Western Europe Market Attractiveness Analysis by Configuration Type
  • Figure 58: Western Europe Market Value Share and BPS Analysis by Application, 2025 and 2035
  • Figure 59: Western Europe Market Y-o-Y Growth Comparison by Application, 2025-2035
  • Figure 60: Western Europe Market Attractiveness Analysis by Application
  • Figure 61: Western Europe Market Value Share and BPS Analysis by End User, 2025 and 2035
  • Figure 62: Western Europe Market Y-o-Y Growth Comparison by End User, 2025-2035
  • Figure 63: Western Europe Market Attractiveness Analysis by End User
  • Figure 64: Eastern Europe Market Value Share and BPS Analysis by Country, 2025 and 2035
  • Figure 65: Eastern Europe Market Value Share and BPS Analysis by Technology , 2025 and 2035
  • Figure 66: Eastern Europe Market Y-o-Y Growth Comparison by Technology , 2025-2035
  • Figure 67: Eastern Europe Market Attractiveness Analysis by Technology
  • Figure 68: Eastern Europe Market Value Share and BPS Analysis by Configuration Type, 2025 and 2035
  • Figure 69: Eastern Europe Market Y-o-Y Growth Comparison by Configuration Type, 2025-2035
  • Figure 70: Eastern Europe Market Attractiveness Analysis by Configuration Type
  • Figure 71: Eastern Europe Market Value Share and BPS Analysis by Application, 2025 and 2035
  • Figure 72: Eastern Europe Market Y-o-Y Growth Comparison by Application, 2025-2035
  • Figure 73: Eastern Europe Market Attractiveness Analysis by Application
  • Figure 74: Eastern Europe Market Value Share and BPS Analysis by End User, 2025 and 2035
  • Figure 75: Eastern Europe Market Y-o-Y Growth Comparison by End User, 2025-2035
  • Figure 76: Eastern Europe Market Attractiveness Analysis by End User
  • Figure 77: East Asia Market Value Share and BPS Analysis by Country, 2025 and 2035
  • Figure 78: East Asia Market Value Share and BPS Analysis by Technology , 2025 and 2035
  • Figure 79: East Asia Market Y-o-Y Growth Comparison by Technology , 2025-2035
  • Figure 80: East Asia Market Attractiveness Analysis by Technology
  • Figure 81: East Asia Market Value Share and BPS Analysis by Configuration Type, 2025 and 2035
  • Figure 82: East Asia Market Y-o-Y Growth Comparison by Configuration Type, 2025-2035
  • Figure 83: East Asia Market Attractiveness Analysis by Configuration Type
  • Figure 84: East Asia Market Value Share and BPS Analysis by Application, 2025 and 2035
  • Figure 85: East Asia Market Y-o-Y Growth Comparison by Application, 2025-2035
  • Figure 86: East Asia Market Attractiveness Analysis by Application
  • Figure 87: East Asia Market Value Share and BPS Analysis by End User, 2025 and 2035
  • Figure 88: East Asia Market Y-o-Y Growth Comparison by End User, 2025-2035
  • Figure 89: East Asia Market Attractiveness Analysis by End User
  • Figure 90: South Asia and Pacific Market Value Share and BPS Analysis by Country, 2025 and 2035
  • Figure 91: South Asia and Pacific Market Value Share and BPS Analysis by Technology , 2025 and 2035
  • Figure 92: South Asia and Pacific Market Y-o-Y Growth Comparison by Technology , 2025-2035
  • Figure 93: South Asia and Pacific Market Attractiveness Analysis by Technology
  • Figure 94: South Asia and Pacific Market Value Share and BPS Analysis by Configuration Type, 2025 and 2035
  • Figure 95: South Asia and Pacific Market Y-o-Y Growth Comparison by Configuration Type, 2025-2035
  • Figure 96: South Asia and Pacific Market Attractiveness Analysis by Configuration Type
  • Figure 97: South Asia and Pacific Market Value Share and BPS Analysis by Application, 2025 and 2035
  • Figure 98: South Asia and Pacific Market Y-o-Y Growth Comparison by Application, 2025-2035
  • Figure 99: South Asia and Pacific Market Attractiveness Analysis by Application
  • Figure 100: South Asia and Pacific Market Value Share and BPS Analysis by End User, 2025 and 2035
  • Figure 101: South Asia and Pacific Market Y-o-Y Growth Comparison by End User, 2025-2035
  • Figure 102: South Asia and Pacific Market Attractiveness Analysis by End User
  • Figure 103: Middle East & Africa Market Value Share and BPS Analysis by Country, 2025 and 2035
  • Figure 104: Middle East & Africa Market Value Share and BPS Analysis by Technology , 2025 and 2035
  • Figure 105: Middle East & Africa Market Y-o-Y Growth Comparison by Technology , 2025-2035
  • Figure 106: Middle East & Africa Market Attractiveness Analysis by Technology
  • Figure 107: Middle East & Africa Market Value Share and BPS Analysis by Configuration Type, 2025 and 2035
  • Figure 108: Middle East & Africa Market Y-o-Y Growth Comparison by Configuration Type, 2025-2035
  • Figure 109: Middle East & Africa Market Attractiveness Analysis by Configuration Type
  • Figure 110: Middle East & Africa Market Value Share and BPS Analysis by Application, 2025 and 2035
  • Figure 111: Middle East & Africa Market Y-o-Y Growth Comparison by Application, 2025-2035
  • Figure 112: Middle East & Africa Market Attractiveness Analysis by Application
  • Figure 113: Middle East & Africa Market Value Share and BPS Analysis by End User, 2025 and 2035
  • Figure 114: Middle East & Africa Market Y-o-Y Growth Comparison by End User, 2025-2035
  • Figure 115: Middle East & Africa Market Attractiveness Analysis by End User
  • Figure 116: Global Market - Tier Structure Analysis
  • Figure 117: Global Market - Company Share Analysis

Frequently Asked Questions

How big is the veterinary scales market in 2025?

The global veterinary scales market is estimated to be valued at USD 280.5 million in 2025.

What will be the size of veterinary scales market in 2035?

The market size for the veterinary scales market is projected to reach USD 474.6 million by 2035.

How much will be the veterinary scales market growth between 2025 and 2035?

The veterinary scales market is expected to grow at a 5.4% CAGR between 2025 and 2035.

What are the key product types in the veterinary scales market?

The key product types in veterinary scales market are electronic veterinary weighing scales and mechanical veterinary weighing scales.

Which configuration type segment to contribute significant share in the veterinary scales market in 2025?

In terms of configuration type, platform segment to command 40.7% share in the veterinary scales market in 2025.

Explore Similar Insights

Future Market Insights

Veterinary Scales Market

Chat With MaRIA

Chat With

MaRIA

Hi There, I am MaRIA, Your Market Research Intelligence Assistant. How may I help you?