The Cardiac Ambulatory Monitoring Market is estimated to be valued at USD 15.9 billion in 2025 and is projected to reach USD 24.6 billion by 2035, registering a compound annual growth rate (CAGR) of 4.5% over the forecast period.
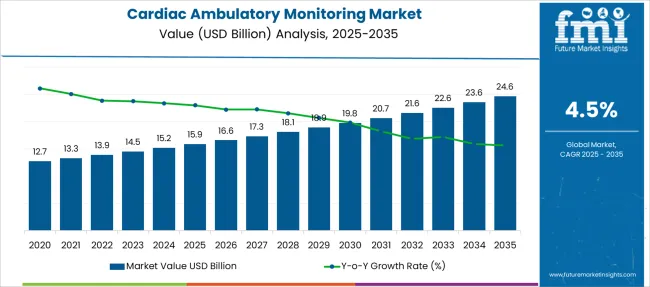
| Metric | Value |
|---|---|
| Cardiac Ambulatory Monitoring Market Estimated Value in (2025 E) | USD 15.9 billion |
| Cardiac Ambulatory Monitoring Market Forecast Value in (2035 F) | USD 24.6 billion |
| Forecast CAGR (2025 to 2035) | 4.5% |
The cardiac ambulatory monitoring market is experiencing steady expansion due to rising cardiovascular disease prevalence, increased focus on preventive diagnostics, and the shift toward outpatient care. Healthcare systems are prioritizing early detection and continuous monitoring to improve long-term cardiac outcomes, supported by growing reimbursement coverage and the expansion of telehealth infrastructure.
The market is further driven by the aging global population and growing awareness among patients regarding minimally disruptive, wearable diagnostic tools. Technological integration with cloud-based platforms and AI-enabled rhythm analysis is enhancing real-time monitoring accuracy and clinical decision-making.
Additionally, the rise in at-home cardiac care and remote patient management strategies is creating long-term growth opportunities for device manufacturers and service providers. Continued collaboration between medtech firms and cardiology networks is expected to strengthen product innovation and delivery efficiency.
The market is segmented by Product and End User and region. By Product, the market is divided into ECG Devices, Holter Monitors, Event Monitors, Implantable Loop Recorders, and Mobile Cardiac Telemetry. In terms of End User, the market is classified into Hospitals, Ambulatory Surgical Centers, Specialty Clinics, Cardiac Care Centers, and Home Care Setting. Regionally, the market is classified into North America, Latin America, Western Europe, Eastern Europe, Balkan & Baltic Countries, Russia & Belarus, Central Asia, East Asia, South Asia & Pacific, and the Middle East & Africa.
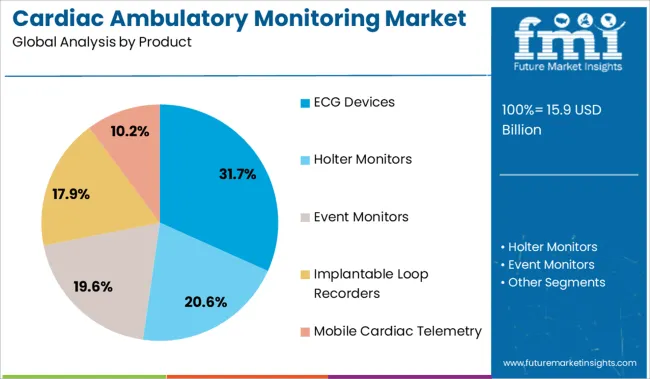
ECG devices are projected to hold 31.7% of the total cardiac ambulatory monitoring market share in 2025, making them the leading product category. Their dominance is being supported by widespread clinical acceptance, diagnostic reliability, and ease of use across a range of ambulatory care settings.
The ability to capture arrhythmias, ischemic episodes, and conduction abnormalities during daily activity has positioned ECG monitoring as a frontline tool for cardiologists. Recent advancements have enhanced portability, battery life, and wireless data transmission, enabling broader adoption in outpatient and home-based settings.
Integration with AI algorithms for rhythm classification and real-time event detection is improving diagnostic turnaround and patient compliance. As the need for non-invasive, continuous cardiac diagnostics grows, ECG devices are expected to remain a foundational component of ambulatory cardiac monitoring programs.
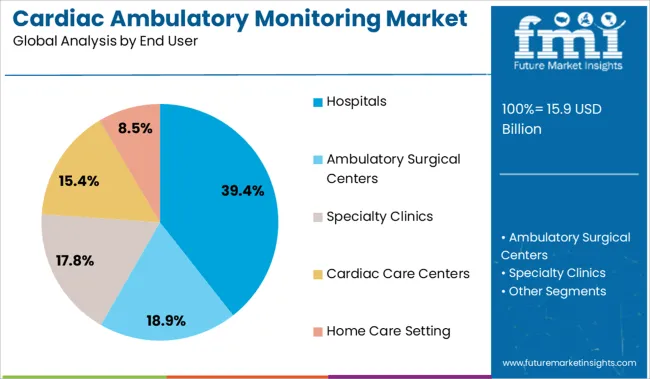
Hospitals are expected to account for 39.4% of the total revenue in the cardiac ambulatory monitoring market by 2025, placing them as the top end user segment. This leadership is being driven by their role in post-discharge monitoring, outpatient diagnostic services, and integration with cardiac care units.
Hospitals increasingly rely on ambulatory monitoring tools to reduce readmission rates and support follow-up care for patients with heart failure, arrhythmias, and syncope. The availability of skilled personnel, advanced EHR integration, and centralized data management infrastructure enables seamless use of monitoring technologies at scale.
Hospitals also serve as primary evaluation centers for device eligibility and long-term cardiac risk assessment, contributing to higher utilization rates. As value-based care models and remote cardiac care strategies expand, hospitals will continue to play a pivotal role in sustaining growth in this segment.
Between 2020 and 2024, the cardiac ambulatory monitoring market grew at a CAGR of 5.2%.
The global market for cardiac ambulatory monitoring held around 59.1% share within the global cardiac monitoring devices market, worth around USD 15.2 Billion, in 2024.
Some of the most important CVD (cardiovascular disease) risk factors are family history, ethnicity, and age. Diabetes, inactivity, tobacco use, a poor diet, high cholesterol, obesity, high blood pressure (hypertension), and alcohol consumption are all risk factors. The prevalence of diseases like hypertension, diabetes, dyslipidemia, and obesity has increased due to changes in lifestyle, which also contributes to the global rise in the risk of CVD.
In the European Union, more than 15.2 million people have cardiovascular disease, and about 13 million new cases are diagnosed each year, according to statistics published by the European Society of Cardiology in June 2024. The market for cardiac ambulatory monitoring is anticipated to expand as a result of the rising prevalence of cardiovascular illnesses and the consequent rise in the demand for patient monitoring systems.
As per the data provided by WHO, cardiovascular diseases are the most common cause of death worldwide, claiming an average of 17.9 million lives yearly. Furthermore, according to the same data from the WHO, stroke and heart attacks account for the majority of deaths than other cardiovascular disease deaths, and the majority of these deaths are reported to happen before the age of 70. The majority of CVD deaths occur in growing economies.
The development of the market is anticipated to be fuelled by advanced product launches and strategic initiatives by major market competitors. For instance, in June 2024, AliveCor purchased CardioLabs, an industry-leading provider of monitoring and cardiac diagnostic services, from an independent diagnostic testing facility (IDTF). The acquisition was a key component of AliveCor's objective to offer a full range of cardiac diagnostic services to patients for whom their doctors have prescribed monitoring devices.
Thus, the above-mentioned factors are expected to act as possible market drivers to propel the global cardiac ambulatory monitoring market during the forecast period.
One of the main drivers of the growth of the cardiac ambulatory monitoring market is the usage of the most cutting-edge and minimally invasive surgical techniques to enhance patients' heart activity and amplify the results of various cardiac surgeries.
Furthermore, the market for cardiac ambulatory monitoring is predicted to grow as demand for advanced cardiac devices such as implantable loop recorders, event monitors, mobile cardiac telemetry, and Holter monitors grows. Additionally, favorable reimbursement practices, rising public and private healthcare spending, and other key aspects are driving the cardiac ambulatory monitoring market.
Cardiovascular monitoring devices have significantly improved as a result of recent advancements in heart monitoring equipment, particularly mobile cardiac telemetry (MCT) systems.
Moreover, to enhance CIED (cardiac implantable electronic devices) stability in the subcutaneous pocket and elute the antibiotics minocycline and rifampin, Medtronic offers an absorbable, multifilament mesh envelope (TYRX Absorbable Antibacterial Envelope).
Implantable cardioverter defibrillators (ICDs) and pacemakers are only a couple of examples of CIEDs that can be used with these envelopes. The envelope reduced the incidence of infection by 40% when compared to regular infection prevention alone.
The abovementioned factors are capable of serving as some lucrative opportunities for manufacturers operating in the cardiac ambulatory monitoring market.
When used to treat cardiac arrhythmias, CIEDs are linked to improved quality of life and survival rates. However, a significant risk factor for using these devices is CIED-associated infections. Patients with implantable cardioverter defibrillators or cardiac resynchronization therapy defibrillators are most likely to get CIED infections. The rate of CIED infections was 1.19% for pacemakers, 1.91% for implantable cardioverter-defibrillators, 2.18% for cardiac resynchronization therapy pacemakers (CRT-Ps), and 3.35% for CRT defibrillators, according to the European Heart Journal (CRTDs).
Medical device cybersecurity issues, particularly those in CIEDs that could be reprogrammed or rendered useless, are a major source of concern for both patients and healthcare professionals.
Mobile phones and mp3 players, metal detectors, magnets, high-voltage electrical wires, and electrical devices like toothbrushes, shavers, and microwaves can also hamper signals if the monitoring devices are in close proximity.
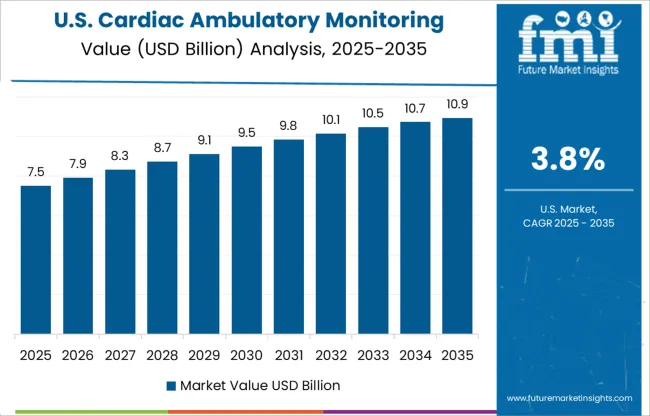
A growing number of cardiovascular surgeries has led to the use of ambulatory cardiac monitoring devices to continuously monitor cardiovascular patients in the USA. Ambulatory cardiac monitoring devices are currently required to track and monitor the heart to prevent fatal outcomes from cardiovascular diseases. Approximately 40,000 children in the USA. undergo congenital heart surgery each year, according to an article published in October 2024 titled, National Variation in Congenital Heart Surgery Outcomes.
ECG devices record heartbeats using electrical impulses, amplified and displayed on an ECG display. They are used to diagnose heart diseases and arrhythmias in a person and to help determine the most appropriate treatment. Electrocardiograms can be obtained at home with a portable ECG device, thanks to advances in technology. More than 60% of the global population suffers from cardiovascular diseases, according to the World Health Organization.
The ambulatory cardiac monitoring devices market in the USA. is consolidated, with the presence of a small number of leading players. Several companies are investing heavily in research and development activities, mainly to introduce advanced ambulatory cardiac monitoring devices to the market. To increase revenue and market share, key players form strategic alliances. They also diversify their product portfolios and acquire other companies.
There are several prominent players operating in the USA, ambulatory cardiac monitoring devices market, including Abbott Laboratories, Biotronik, Boston Scientific Corporation, Hill-Rom Holdings, GE Healthcare, Koninklijke Philips N.V., Medtronic, and Nihon Kohden Corporation.
The Portrait Mobile wireless patient monitoring system, announced by GE Healthcare in June 2025, provides continuous monitoring throughout a patientń.6;s stay. The system helps clinicians detect the deterioration of the patient. In addition to reducing the length of stay and ICU admissions, early detection of patient deterioration may improve patient outcomes.
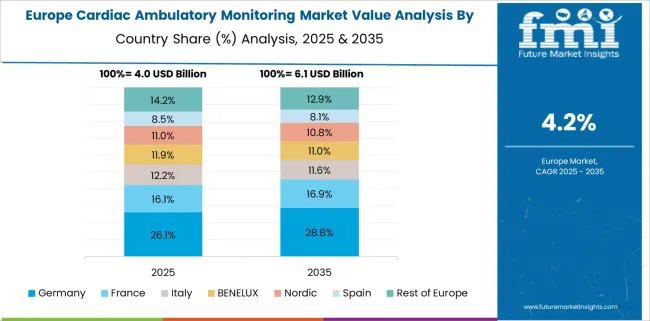
Germany dominates the European cardiac ambulatory monitoring market by achieving a valuation of USD 15.9 Billion. This is despite retaining a market share of about 5.6% in the global market, in 2025. Europe is one of the largest markets for cardiac ambulatory monitoring across the globe. As the population ages, cardiac issues are on the rise.
Additionally, wearable devices for ambulatory cardiac monitors that incorporate advanced software, analytical tools, and artificial intelligence have been introduced to satisfy the increasing demand for holistic, multi-input, and patient-driven devices for complex physiology. As an example, Cambridge Heartware, a United Kingdom-based healthcare company, has introduced a wearable heart monitor that sends recorded data to the cloud so adaptive artificial intelligence algorithms can diagnose irregular heart rates that are clinically relevant.
Moreover, minimally invasive diagnostic tools and preventative healthcare devices are driving the market. In addition, governments in the region are creating awareness of cardiovascular disorders, which is driving the market forward.
Due to a large number of large, medium, and small players, the European cardiac monitoring market is extremely fragmented and specialized. To improve their market position, multinational players hold a substantial share of the cardiac monitoring market. To enhance their market presence, companies are focusing on several growth strategies, including mergers and acquisitions, partnerships, collaborations, and geographical expansions.
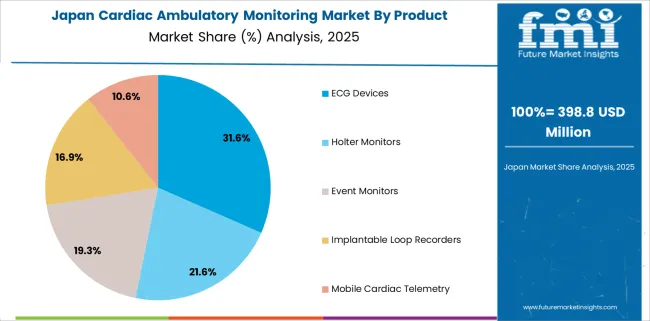
According to the forecast, Japan’s cardiac ambulatory monitoring market may grow at a CAGR of 3.1% in the forecasted period. The increasing cardiovascular disease burden and the increased adoption of minimally invasive procedures are driving the market growth in Japan's cardiac ambulatory monitoring market.
In December 2024, the National Cerebral and Cardiovascular Center, Japan, estimated that approximately 15.2 million Japanese people would suffer from heart failure by 2024. Additionally, based on the same source, heart failure patients are expected to increase in Japan, where people live to be 100 years old. This is because cardiovascular disease prevalence increases with age. Heart failure is one of the most prevalent conditions in Japan, which is expected to drive the adoption of cardiovascular devices.
Japan is also one of the nations with the fastest-aging population in the world. According to World Data 2025, there were 28% of people aged 65 and above in 2024 and 29% in 2024. The increase in the geriatric population in Japan is expected to drive market growth because geriatric people are more likely to suffer from chronic diseases like cardiovascular diseases.
Increased initiatives from key players in the market are also expected to drive market growth in Japan due to the rise in sales of cardiac ambulatory monitoring products. A distribution agreement between Rampart IC and Japan Lifeline (JLL) was signed in March 2025, securing distribution in the Japanese market. In addition to being designed for interventional cardiologists, the Rampart M1128 has been applied to a variety of interventional specialties.
As a result of these distribution partnerships, cardiovascular devices may be adopted more widely, driving market growth. For instance, As of January 2025, Medtronic's Micra AV Transcatheter Pacing System (TPS) has been approved and reimbursed by Japan's Ministry of Health, Labor, and Welfare. The company is preparing to launch the device.
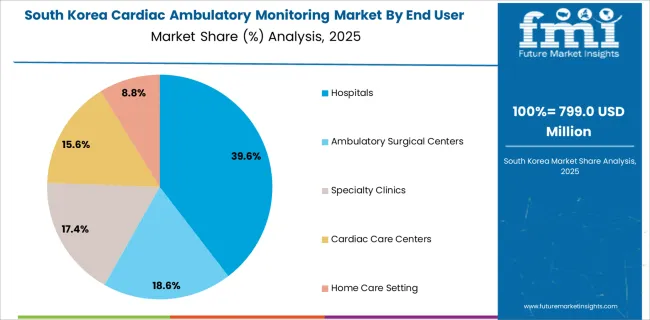
The increasing prevalence of chronic diseases such as cardiovascular diseases among the population is expected to increase the demand for cardiac ambulatory monitoring devices, thereby propelling the cardiac ambulatory monitoring market growth in Korea. In addition, the growing geriatric population is also contributing to the market's growth.
According to the United Nations Population Fund's 2025 statistics, in Korea, 71% of the population is aged 15-64, which constitutes a large proportion of the living population. Additionally, according to the same source, 17% of the population will be 65 years or older by 2025. Thus, chronic disease is more likely to develop in the geriatric population.
Furthermore, the rising product launches and company activities in Korea are also expected to boost the cardiac ambulatory monitoring market over the forecast period. A South Korean healthcare start-up, Sky Labs, launched a wearable, ring-type heart rhythm monitoring device in November 2024 that detects atrial fibrillation (AF) and prevents heart-related problems. Additionally, Samsung launched in Korea a Health Monitoring Application, which can monitor blood pressure and ECGs.
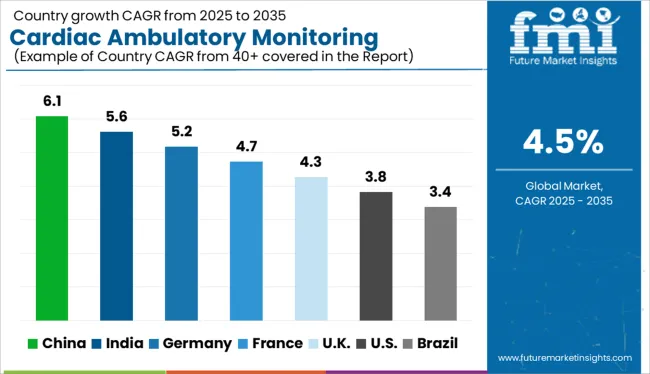
As of 2024, the USA. held the greatest share of the global market at about 315.2% and generated revenue of around USD 15.2 Billion. The country is anticipated to experience significant expansion as a result of positive government efforts, increased technological advancements, rising cardiovascular disease prevalence, and rapid economic growth. For instance, the geriatric population in the USA. is 16.8% of the total population, according to details published by the Organization for Economic Co-operation and Development in 2024. The market is expected to expand as a result of the rise in demand for cardiac pacemakers brought on by the aging population due to increasing incidences of cardiovascular issues.
In the European region, Germany dominates the cardiac ambulatory monitoring market by achieving a valuation of USD 0.75 Billion withholding a market share of about 5.6% in the global market, in 2024. According to data published by the European Society of Cardiology in June 2024, more than 60 million people in the European Union have cardiovascular disease, and about 13 million new cases are diagnosed each year. The cardiac ambulatory monitoring market is anticipated to expand as a result of the rising incidence of cardiovascular disorders and the consequent rise in the requirement for cardiac ambulatory monitoring devices.
At the end of 2024, China held a market share of about 9.2% in the global cardiac ambulatory monitoring market. Cardiac ambulatory monitoring device adoption is particularly high in China. According to a study that was published in the Radcliffe Cardiology journal, heart failure is a serious health concern in China, where it appears to be more common than in Western nations. The market in the region is being driven by an increase in awareness of heart failure and the danger of sudden cardiac arrest associated with this disease.
In 2024, the ECG category contributed about 42.2% share of the global market 2024. This is explained by the fact that, as compared to other short- and long-term monitoring equipment, these devices provide a quicker and more accurate diagnosis of cardiac health. Additionally, compared to other devices, ECG devices have relatively lower pricing. These devices can also be utilized in medical operations, along with a variety of other cardiac diagnostic tests, telemetry monitoring equipment, and other tools.
Hospitals hold about USD 15.2 Billion in revenue with 35.0% of the majority of the global market share in 2024. The rising incidence of CVDs, the rising number of hospital visits, the rising number of cardiac device implantation procedures, and the availability of reimbursement for these procedures, propel the expansion of this segment.
According to CDC (centers for disease control and prevention) report, in the USA., hospitals see about 6.9% of patients with ischemic heart disease, coronary artery disease, or a history of myocardial infarction each year, whereas emergency rooms see about 7.2% of patients with heart diseases.
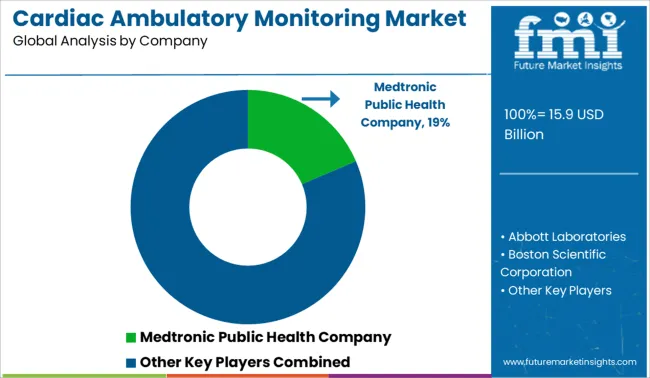
The existence of numerous industry rivals has led to a slight fragmentation and concentration of the cardiac ambulatory monitoring market. Cardiac ambulatory monitoring devices offer a new paradigm in healthcare by gathering and analyzing long-term data for accurate diagnosis. These devices are becoming increasingly used for monitoring chronic heart disease.
The key manufacturers' strategic initiatives and the introduction of advanced products are anticipated to fuel the industry's expansion throughout the forecast period.
For Instance:
Similarly, recent developments related to companies manufacturing cardiac ambulatory monitoring products have been tracked by the team at Future Market Insights, which are available in the full report.
| Attribute | Details |
|---|---|
| Forecast Period | 2025 to 2035 |
| Historical Data Available for | 2020 to 2024 |
| Market Analysis | USD Billion for Value, Volume (Units) |
| Key Regions Covered | North America; Latin America; Europe; East Asia; South Asia; Oceania; and Middle East & Africa (MEA). |
| Key Countries Covered | USA, Canada, Brazil, Mexico, Argentina, Rest of Latin America, United Kingdom, Germany, Italy, Russia, Spain, France, BENELUX, Rest of Europe, Japan, China, South Korea, India, Thailand, Indonesia, Malaysia, Australia, New Zealand, Turkey, GCC Countries, South Africa, North Africa and Rest of Middle East and Africa(MEA). |
| Key Market Segments Covered | Product, end users, and regions |
| Key Companies Profiled | Medtronic plc; Abbott Laboratories; Boston Scientific Corporation; GE Healthcare; iRhythm Technologies Inc; Biotronik; Schiller; Medicomp Inc.; Koninklijke Philips N.V.; Applied Cardiac System; MicroPort |
| Pricing | Available upon Request |
The global cardiac ambulatory monitoring market is estimated to be valued at USD 15.9 billion in 2025.
The market size for the cardiac ambulatory monitoring market is projected to reach USD 24.6 billion by 2035.
The cardiac ambulatory monitoring market is expected to grow at a 4.5% CAGR between 2025 and 2035.
The key product types in cardiac ambulatory monitoring market are ecg devices, holter monitors, event monitors, implantable loop recorders and mobile cardiac telemetry.
In terms of end user, hospitals segment to command 39.4% share in the cardiac ambulatory monitoring market in 2025.


Our Research Products

The "Full Research Suite" delivers actionable market intel, deep dives on markets or technologies, so clients act faster, cut risk, and unlock growth.

The Leaderboard benchmarks and ranks top vendors, classifying them as Established Leaders, Leading Challengers, or Disruptors & Challengers.

Locates where complements amplify value and substitutes erode it, forecasting net impact by horizon

We deliver granular, decision-grade intel: market sizing, 5-year forecasts, pricing, adoption, usage, revenue, and operational KPIs—plus competitor tracking, regulation, and value chains—across 60 countries broadly.

Spot the shifts before they hit your P&L. We track inflection points, adoption curves, pricing moves, and ecosystem plays to show where demand is heading, why it is changing, and what to do next across high-growth markets and disruptive tech

Real-time reads of user behavior. We track shifting priorities, perceptions of today’s and next-gen services, and provider experience, then pace how fast tech moves from trial to adoption, blending buyer, consumer, and channel inputs with social signals (#WhySwitch, #UX).

Partner with our analyst team to build a custom report designed around your business priorities. From analysing market trends to assessing competitors or crafting bespoke datasets, we tailor insights to your needs.
Supplier Intelligence
Discovery & Profiling
Capacity & Footprint
Performance & Risk
Compliance & Governance
Commercial Readiness
Who Supplies Whom
Scorecards & Shortlists
Playbooks & Docs
Category Intelligence
Definition & Scope
Demand & Use Cases
Cost Drivers
Market Structure
Supply Chain Map
Trade & Policy
Operating Norms
Deliverables
Buyer Intelligence
Account Basics
Spend & Scope
Procurement Model
Vendor Requirements
Terms & Policies
Entry Strategy
Pain Points & Triggers
Outputs
Pricing Analysis
Benchmarks
Trends
Should-Cost
Indexation
Landed Cost
Commercial Terms
Deliverables
Brand Analysis
Positioning & Value Prop
Share & Presence
Customer Evidence
Go-to-Market
Digital & Reputation
Compliance & Trust
KPIs & Gaps
Outputs
Full Research Suite comprises of:
Market outlook & trends analysis
Interviews & case studies
Strategic recommendations
Vendor profiles & capabilities analysis
5-year forecasts
8 regions and 60+ country-level data splits
Market segment data splits
12 months of continuous data updates
DELIVERED AS:
PDF EXCEL ONLINE
Cardiac Rehabilitation Market Size and Share Forecast Outlook 2025 to 2035
Cardiac Rhythm Management Devices Market Size and Share Forecast Outlook 2025 to 2035
Cardiac Valvulotome Market Size and Share Forecast Outlook 2025 to 2035
Cardiac Ultrasound Systems Market - Trends & Forecast 2025 to 2035
Cardiac Assist Devices Market Growth – Trends & Forecast 2025 to 2035
Cardiac Biomarker Diagnostic Test Kits Market Analysis – Trends & Forecast 2025 to 2035
Cardiac Surgery Devices Market Analysis – Trends & Forecast 2024-2034
Cardiac Rhythm Management Market Insights - Trends & Forecast 2024 to 2034
Cardiac Reader System Market Growth – Trends & Forecast 2019 to 2027
Cardiac Medical Device Market
Cardiac Monitoring And Cardiac Rhythm Management Devices Market Size and Share Forecast Outlook 2025 to 2035
Cardiac Rhythm Remote Monitoring Devices Market Size and Share Forecast Outlook 2025 to 2035
Intracardiac Echocardiography Market Insights - Growth & Forecast 2025 to 2035
Intracardiac Imaging Market Trends – Industry Growth & Forecast 2024-2034
Mobile Cardiac Telemetry System Market Size and Share Forecast Outlook 2025 to 2035
MRI-Guided Cardiac Ablation Market Size and Share Forecast Outlook 2025 to 2035
Continuous Cardiac Monitoring Devices Market Size and Share Forecast Outlook 2025 to 2035
Companion Animal Cardiac Drugs Market Size and Share Forecast Outlook 2025 to 2035
Ambulatory Polysomnography (PSG) Systems Market Analysis - Size, Share, and Forecast 2025 to 2035
Ambulatory Aids Market Size and Share Forecast Outlook 2025 to 2035

Thank you!
You will receive an email from our Business Development Manager. Please be sure to check your SPAM/JUNK folder too.
Chat With
MaRIA