Reports

- Global Locations -

Headquarters

Future Market Insights, Inc.

Christiana Corporate, 200
Continental Drive, Suite 401,
Newark, Delaware - 19713,
United States

T: +1-845-579-5705

Americas

Future Market Insights, Inc.

616 Corporate Way, Suite 2-9018,
Valley Cottage, NY 10989, United States

T: +1-347-918-3531

MEA

Future Market Insights

1602-6 Jumeirah Bay X2 Tower, Plot No: JLT-PH2-X2A,
Jumeirah Lakes Towers, Dubai,
United Arab Emirates

Europe

Future Market Insights

3rd Floor, 207 Regent Street,
W1B 3HH London
United Kingdom

T: + 44 (0) 20 8123 9659
D: +44 (0) 20 3287 4268

Asia Pacific

Future Market Insights

IndiaLand Global Tech Park, Unit UG-1, Behind Grand HighStreet, Phase 1, Hinjawadi, MH, Pune – 411057, India

Mobile Cardiac Telemetry System Market Outlook

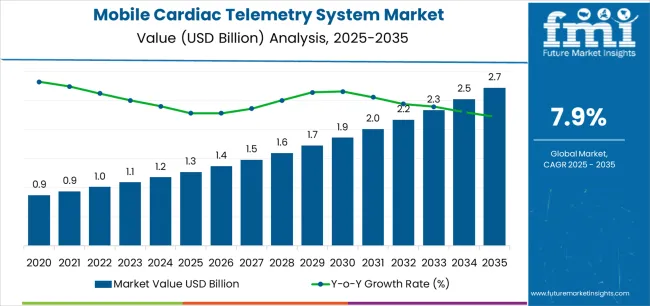
In a recently updated edition, trends infer a valuation of US$ 1,175.10 million for the mobile cardiac telemetry system market in 2024. Looking ahead to 2034, the current forecast projects a CAGR of 8.30%. Current projections of mobile cardiac telemetry device market imply a valuation of US$ 2,608.30 million by 2034

Patients have a healthy demand for mobile cardiac telemetry systems because of their amplified diagnostic yield contrary to industry regulations regarding cardiac monitoring equipment. The promptly emerging geriatric population sprouts the intensifying demand for cardiac monitoring home health care spaces. The mobile cardiac telemetry device providers experience tremendous opportunities for enhancement regarding the soaring cardiovascular sickness pervasiveness.

  • According to WHO estimates, cardiovascular disorders take up the lives of up to 17.5 million people each year, globally.

The MCT system market has had numerous emerging manufacturers penetrate the market. The costs of mobile cardiac telemetry devices are set to cut down through 2034, which amplifies the adoption of mobile cardiac telemetry (MCT) systems.

Attributes Details
Market Value for 2024 US$ 1,175.10 million
Market Value for 2034 US$ 2,608.30 million
Market CAGR from 2024 to 2034 8.30%

Don't pay for what you don't need

Customize your report by selecting specific countries or regions and save 30%!

Deterrents to the Demand Growth of Mobile Cardiac Telemetry Systems

The MCT device market growth is impeded by pitfalls like expensive devices, the demand for prolonged observation, and the reliance on exterior wires.

  • As mentioned in the Journal of Telemedicine and Telecare review, the cost per patient for device purchases, and monitoring fluctuates from US$ 275 to US$ 7,963. It was inferred that maintaining track of several vital signs was more expensive than monitoring one.

Owing to escalating concerns about low patient comfort, the market witnesses hardships between 2024 and 2034. The MCT device market has a deceleration in revenue growth because of the rigorous bylaws and product recalls assignable to product failure.

Attributes Details
Market Value for 2019 US$ 543.46 million
Market Value for 2023 US$ 1,044.50 million
Market CAGR from 2019 to 2023 14.00%

Comparative View of Adjacent Mobile Cardiac Telemetry Device Market

The cardiac rhythm remote monitoring device market and the cardiac ambulatory monitoring market have both been studied by Future Market Insights (FMI).

The data depict the projected growth of the mobile cardiac telemetry system market from 2024 to 2034 with regard to other markets. It showcases the potential for revenue in the additional markets shown below.

Mobile Cardiac Telemetry System Market:

Attributes Mobile Cardiac Telemetry (MCT) System Industry
Value-based CAGR (2024 to 2034) 8.30%
Growth Factor
  • The surging predominance of cardiovascular diseases accelerates demand for mobile cardiac telemetry systems.
  • Technological innovations enabling real-time monitoring spur mobile cardiac telemetry system market growth.
Market Trend
  • The booming preference for remote patient monitoring boosts the adoption of mobile cardiac telemetry solutions.
  • The augmenting aging population soaring sales of mobile cardiac telemetry devices.
Market Restraint
  • The significant cost of MCT systems constrains adoption of mobile cardiac telemetry devices.
  • The data security and privacy concerns impede mobile cardiac telemetry system market growth.

Cardiac Rhythm Remote Monitoring Device Market:

Attributes Cardiac Rhythm Remote Monitoring Device Market
Value-based CAGR (2024 to 2034) 5.30%
Growth Factor
  • The demand escalation for continuous monitoring to prevent unanticipated cardiac events sustains cardiac rhythm remote monitoring device demand.
  • Integration of AI and machine learning augments diagnostic abilities, booming cardiac rhythm remote monitoring device market growth.
Market Trend
  • The aging population and shooting up acceptance of cardiovascular diseases present demand for cardiac rhythm remote monitoring device.
Market Restraint
  • The opposition from healthcare providers to adopt fresh technologies inhibits cardiac rhythm remote monitoring device market expansion.

Cardiac Ambulatory Monitoring Market:

Attributes Cardiac Ambulatory Monitoring Market
Value-based CAGR (2024 to 2034) 5.20%
Growth Factor
  • The accelerating awareness about early detection and deterrence of cardiac events propels the demand for cardiac ambulatory monitoring solutions.
Market Trend
  • Technological innovations sustaining remote monitoring and real-time data transmission support sales of cardiac ambulatory monitoring.
Market Restraint
  • The dearth of organized protocols constrains seamless integration into existing healthcare structures, hindering the cardiac ambulatory monitoring market growth.
Sabyasachi Ghosh
Sabyasachi Ghosh

Principal Consultant

Talk to Analyst

Find your sweet spots for generating winning opportunities in this market.

Category-wise Outlook

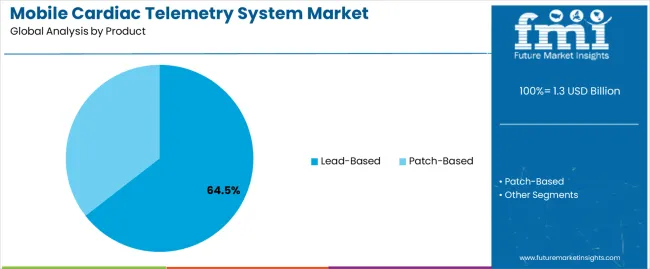
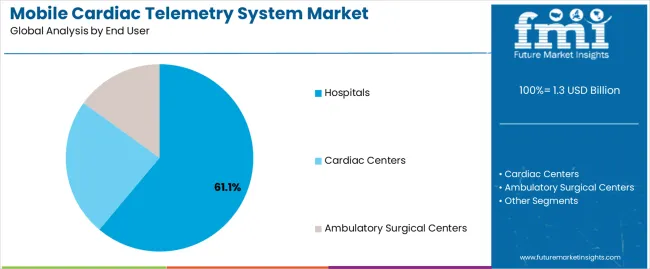
The segmented mobile cardiac telemetry system market analysis is mentioned in the following subsection. Based on comprehensive studies, the lead-based sector is leading the product type category. Similarly, the hospitals segment is commanding the end user category.

Lead-based Segment Stimulates the Market Growth of Mobile Cardiac Telemetry System

Segment Lead based
Share (2024) 64.50%

By product type category, the lead-based segment governs the global market, acquiring a substantial market share through 2034. Skin preparation, electrode, and lead placement, patient supervision, and equipment preservation are essential for telemetry precision.

Electrodes and multi-lead electrocardiography (ECG) recording are used in telemetry surveillance, making the lead-based segment a prominent catalyst for MCT device market growth. There are some constraints linked with lead-based mobile cardiac telemetry systems such as lead failure and telemetry disruption which hinder the growth.

Hospital Segment Dominate the Demand for Mobile Cardiac Telemetry Systems

Segment Hospitals
Share (2024) 61.10%

The mobile cardiac telemetry device market growth is thrust by the escalation in minimally invasive procedures performed and the availability of surgeons. Hospitals are widely available, making them more prominent than other types of medical facilities. It is anticipated that favorable reimbursement policies will spur demand for hospital segment.

Country-wise Analysis

The mobile cardiac telemetry device market can be observed in the subsequent tables, which focus on the leading regions in North America, Europe, and Asia Pacific. A comprehensive evaluation demonstrates that Asia Pacific has enormous opportunities for mobile cardiac telemetry system market.

Demand Analysis of Mobile Cardiac Telemetry Devices in North America

Countries CAGR (2024 to 2034)
Canada 3.60%
United States 2.10%

Canada Industry Outlook

Booming cognizance regarding the preventive healthcare measure concerns and demand for constant cardiac monitoring ushers the demand for mobile cardiac telemetry systems in Canada, escalating healthcare providers to look out for digital health solutions. The government strategies to support telemedicine related to a flourishing aging population prone to cardiovascular diseases thrive mobile cardiac telemetry system market expansion in Canada.

United States Industry Outlook

The escalating adoption of mobile cardiac telemetry devices, especially among the elderly population and people with chronic heart problems, intensifies the approachability to healthcare services. Strict regulations and the existence of established mobile cardiac telemetry systems manufacturers indicate the competition in the United States, emphasizing assuring product efficiency and patient safety.

  • BioTelemetry headquartered in the United States acquired Geneva Healthcare, Inc. in January 2019, which is the leading remote monitoring provider for cardiac devices. The acquisition fortifies its dominant position in remote cardiac monitoring and pulsates well with the United States population.

Opportunities for Mobile Cardiac Telemetry System Market in Europe

Countries CAGR (2024 to 2034)
France 4.30%
Italy 3.70%
Spain 3.40%
Germany 3.20%
United Kingdom 2.90%

France Industry Outlook

The surging senior population and thriving healthcare costs are major factors that strengthen sales of mobile cardiac telemetry devices in France. Strict regulations safeguarding patient data privacy and security reshape the France mobile cardiac telemetry system market.

Italy Industry Outlook

Italy tops the pathway in the adoption of mobile cardiac telemetry (MCT) systems owing to government measures ushering in remote patient monitoring and digital health solutions. The Italy mobile cardiac telemetry device market is evolving because of booming investments in healthcare infrastructure and the incorporation of telemedicine technology.

Spain Industry Outlook

The escalation of demand for mobile cardiac telemetry systems in Spain as people are aware of the advantages of early identification and intervention in heart problems. In Spain, the efficiency and accuracy of diagnoses are improved by the integration of AI and machine learning algorithms into mobile cardiac monitoring systems.

Germany Industry Outlook

Favorable reimbursement policies for telemedicine and developing healthcare expenditure amplify the MCT systems adoption in Germany. The proliferating focus on preventive healthcare and proactive management of chronic diseases augment the sales of mobile cardiac telemetry systems.

United Kingdom Industry Outlook

The national plans sustaining telehealth and remote patient monitoring are advancing the mobile cardiac telemetry (MCT) systems demand in the United Kingdom. The amalgamation of cloud-based platforms and wearable technologies prospers the capabilities and MCT systems adoption in the United Kingdom healthcare sector.

Potential in the Asia Pacific Mobile Cardiac Telemetry (MCT) System Industry

Countries CAGR (2024 to 2034)
India 5.80%
Malaysia 4.60%
Singapore 4.30%
Indonesia 3.90%

India Industry Outlook

The developing cognizance regarding preventive healthcare and telemedicine infrastructure innovation exhibits growth potential in the Indian mobile cardiac telemetry device market. The booming population and widening middle-class segment propound lucrative opportunities for mobile cardiac telemetry (MCT) system vendors in India.

Malaysia Industry Outlook

The augmenting healthcare expenses and investments in telemedicine solutions propel sales of mobile cardiac telemetry (MCT) systems in Malaysia. Regulatory initiatives focused on advocating digital health solutions expedite market growth and adoption of MCT systems in Malaysia.
Get the data you need at a Fraction of the cost

Personalize your report by choosing insights you need
and save 40%!

Competitive Overview

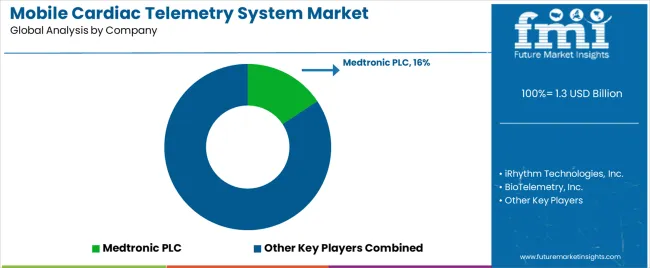
Several key mobile cardiac telemetry (MCT) system vendors are prominent contributors to innovation and healthcare transformation. Medtronic PLC, BioTelemetry, Inc., ScottCare, Airtricity Inc., and Welch Allyn are the major mobile cardiac telemetry system manufacturers influencing the industry's growth trajectory. Applied Cardiac Systems Inc., Medicomp Inc., and Preventice Solutions play meaningful roles, ushering in unique offerings.

Telerhythmics LLC and Zoll Medical Corporation ameliorate the competitive landscape with their expert solutions, while iRhythm Technologies, Inc. adds unparalleled strength. This mobile cardiac telemetry (MCT) system manufactures thrust progression in mobile cardiac telemetry systems, delivering to the transitioning requirements of healthcare providers and patients.

As pathfinders in remote patient monitoring, these MCT system producers continually innovate to augment cardiac telemetry solutions' authenticity, accuracy, and effectiveness. Their contributions catapult progression in technology and stimulate greater adoption of mobile cardiac monitoring devices.

The competition nurtures innovation, inducing continuous evolution in mobile cardiac telemetry technology. Each mobile cardiac telemetry device vendor brings its expertise, adding to the growth and market expansion. As the industry transitions, these manufacturers carve the future of MCT systems and encourage positive results for heart patients.

Noteworthy Breakthroughs

Company Details
VitalConnect VitalConnect, based in the United States, revealed VitalPatch RTM, a mobile cardiac telemetry device, in May 2022. The solution's configurable and versatile platform satisfies several cardiac monitoring needs.
Biotelemetry Biotelemetry, headquartered in the United States, acquired ADEA Medical AB in July 2019. The purchase aligns with BioTelemetry's long-term plan to evolve its global audience base in Nordic and other European countries.
Biotricity In July 2020, Biotricity, based in the United States, and Verizon signed a partnered agreement to generate Bioflux-powered EMS solutions for first responders. The high-accuracy, single-unit mobile cardiac telemetry (MCT) system Bioflux propagates and keeps track of patients' ECG data in real-time.
Medicomp, Inc. Lenox Hill Hospital, rooted in New York and a component of the Northwell Health system, and Medicomp, Inc. collaborated in April 2020. After the collaboration, patients who have been prescribed specific drugs for the treatment are able to gauge their heart's electrical conduction for abnormalities by using Lenox Hill Hospital's TelePatch mobile cardiac telemetry (MCT) monitor.
G Medical Innovations Holdings In April 2020, the FDA sanctioned G Medical Innovations Holdings' Prizma medical smartphone cover. With Prizma, users employ their smartphone as a portable medical monitor to assess blood oxygen saturation, heart rate, temperature, and other pivotal signs that are used to identify infection and chronic diseases symptoms.

Essential Mobile Cardiac Telemetry System Manufacturers

  • Medtronic PLC
  • BioTelemetry, Inc.
  • ScottCare, Airtricity Inc.
  • Welch Allyn
  • Applied Cardiac Systems Inc.
  • Medicomp Inc.
  • Preventice Solutions
  • Telerhythmics LLC
  • Zoll Medical Corporation
  • iRhythm Technologies, Inc.

Key Coverage in Mobile Cardiac Telemetry (MCT) System Market Report

  • Adjacent Study on Mobile Cardiac Telemetry System Market, Cardiac Rhythm Remote Monitoring Device Market, and Cardiac Ambulatory Monitoring Market
  • Mobile Cardiac Telemetry System Market Segment Analysis by Product Type between Lead-Based, and Patch-Based
  • Emerging Trends in Mobile Cardiac Telemetry Systems in the United States
  • Opportunities in the Mobile Cardiac Telemetry Device Market in France
  • Overview of Mobile Cardiac Telemetry System Vendor Landscape

Key Segments

By Product:

  • Lead-Based
  • Patch-Based

By End User:

  • Hospitals
  • Cardiac Centers
  • Ambulatory Surgical Centers

By Region:

  • North America
  • Latin America
  • Europe
  • East Asia
  • South Asia
  • Oceania
  • The Middle East and Africa (MEA)

Frequently Asked Questions

What is Current Mobile Cardiac Telemetry System Market Valuation?

The mobile cardiac telemetry device market to possess a worth US$ 1,175.10 million in 2024.

How Big Can the Mobile Cardiac Telemetry System Market Be by 2034?

The mobile cardiac telemetry device market has the potential to acquire a valuation of US$ 2,608.30 million by 2034.

What is the Growth Potential of the Mobile Cardiac Telemetry System Market?

The mobile cardiac telemetry device market indicates a robust CAGR of 8.30% through 2034.

What Was the Historical Outlook of The Mobile Cardiac Telemetry System (MCT) Market?

From 2019 to 2023, the mobile cardiac telemetry device market evolved at a 14.00% CAGR.

Which Product Type Segment to Dominate in the Mobile Cardiac Telemetry System Market?

The lead-based sector is set to achieve a global MCT device market share of 64.50% in 2024.

Which End User Segment to Lead the Mobile Cardiac Telemetry System Market?

The hospital segment to possess a global mobile cardiac telemetry (MCT) device market share of 61.10% in 2024.

Table of Content

1. Executive Summary

    1.1. Global Market Outlook

    1.2. Demand-side Trends

    1.3. Supply-side Trends

    1.4. Technology Roadmap Analysis

    1.5. Analysis and Recommendations

2. Market Overview

    2.1. Market Coverage / Taxonomy

    2.2. Market Definition / Scope / Limitations

3. Market Background

    3.1. Market Dynamics

        3.1.1. Drivers

        3.1.2. Restraints

        3.1.3. Opportunity

        3.1.4. Trends

    3.2. Scenario Forecast

        3.2.1. Demand in Optimistic Scenario

        3.2.2. Demand in Likely Scenario

        3.2.3. Demand in Conservative Scenario

    3.3. Opportunity Map Analysis

    3.4. Product Life Cycle Analysis

    3.5. Supply Chain Analysis

        3.5.1. Supply Side Participants and their Roles

            3.5.1.1. Manufacturer

            3.5.1.2. Mid-Level Participants

        3.5.2. Value Added and Value Created at Node in the Supply Chain

        3.5.3. List of Raw Material Suppliers

        3.5.4. List of Existing and Potential Buyer’s

    3.6. Investment Feasibility Matrix

    3.7. Value Chain Analysis

        3.7.1. Profit Margin Analysis

    3.8. PESTLE and Porter’s Analysis

    3.9. Regulatory Landscape

        3.9.1. By Key Regions

        3.9.2. By Key Countries

    3.10. Regional Parent Market Outlook

    3.11. Production and Consumption Statistics

    3.12. Import and Export Statistics

4. Global Market Analysis 2019 to 2023 and Forecast, 2024 to 2034

    4.1. Historical Market Size Value (US$ Million) & Volume (Units) Analysis, 2019 to 2023

    4.2. Current and Future Market Size Value (US$ Million) & Volume (Units) Projections, 2024 to 2034

        4.2.1. Y-o-Y Growth Trend Analysis

        4.2.2. Absolute $ Opportunity Analysis

5. Global Market Analysis 2019 to 2023 and Forecast 2024 to 2034, By Product

    5.1. Introduction / Key Findings

    5.2. Historical Market Size Value (US$ Million) & Volume (Units) Analysis By Product, 2019 to 2023

    5.3. Current and Future Market Size Value (US$ Million) & Volume (Units) Analysis and Forecast By Product, 2024 to 2034

        5.3.1. Lead-Based

        5.3.2. Patch-Based

    5.4. Y-o-Y Growth Trend Analysis By Product, 2019 to 2023

    5.5. Absolute $ Opportunity Analysis By Product, 2024 to 2034

6. Global Market Analysis 2019 to 2023 and Forecast 2024 to 2034, By End User

    6.1. Introduction / Key Findings

    6.2. Historical Market Size Value (US$ Million) & Volume (Units) Analysis By End User, 2019 to 2023

    6.3. Current and Future Market Size Value (US$ Million) & Volume (Units) Analysis and Forecast By End User, 2024 to 2034

        6.3.1. Hospitals

        6.3.2. Cardiac Centres

        6.3.3. Ambulatory Surgical Centres

    6.4. Y-o-Y Growth Trend Analysis By End User, 2019 to 2023

    6.5. Absolute $ Opportunity Analysis By End User, 2024 to 2034

7. Global Market Analysis 2019 to 2023 and Forecast 2024 to 2034, By Region

    7.1. Introduction

    7.2. Historical Market Size Value (US$ Million) & Volume (Units) Analysis By Region, 2019 to 2023

    7.3. Current Market Size Value (US$ Million) & Volume (Units) Analysis and Forecast By Region, 2024 to 2034

        7.3.1. North America

        7.3.2. Latin America

        7.3.3. Western Europe

        7.3.4. Eastern Europe

        7.3.5. South Asia and Pacific

        7.3.6. East Asia

        7.3.7. Middle East and Africa

    7.4. Market Attractiveness Analysis By Region

8. North America Market Analysis 2019 to 2023 and Forecast 2024 to 2034, By Country

    8.1. Historical Market Size Value (US$ Million) & Volume (Units) Trend Analysis By Market Taxonomy, 2019 to 2023

    8.2. Market Size Value (US$ Million) & Volume (Units) Forecast By Market Taxonomy, 2024 to 2034

        8.2.1. By Country

            8.2.1.1. USA

            8.2.1.2. Canada

        8.2.2. By Product

        8.2.3. By End User

    8.3. Market Attractiveness Analysis

        8.3.1. By Country

        8.3.2. By Product

        8.3.3. By End User

    8.4. Key Takeaways

9. Latin America Market Analysis 2019 to 2023 and Forecast 2024 to 2034, By Country

    9.1. Historical Market Size Value (US$ Million) & Volume (Units) Trend Analysis By Market Taxonomy, 2019 to 2023

    9.2. Market Size Value (US$ Million) & Volume (Units) Forecast By Market Taxonomy, 2024 to 2034

        9.2.1. By Country

            9.2.1.1. Brazil

            9.2.1.2. Mexico

            9.2.1.3. Rest of Latin America

        9.2.2. By Product

        9.2.3. By End User

    9.3. Market Attractiveness Analysis

        9.3.1. By Country

        9.3.2. By Product

        9.3.3. By End User

    9.4. Key Takeaways

10. Western Europe Market Analysis 2019 to 2023 and Forecast 2024 to 2034, By Country

    10.1. Historical Market Size Value (US$ Million) & Volume (Units) Trend Analysis By Market Taxonomy, 2019 to 2023

    10.2. Market Size Value (US$ Million) & Volume (Units) Forecast By Market Taxonomy, 2024 to 2034

        10.2.1. By Country

            10.2.1.1. Germany

            10.2.1.2. UK

            10.2.1.3. France

            10.2.1.4. Spain

            10.2.1.5. Italy

            10.2.1.6. Rest of Western Europe

        10.2.2. By Product

        10.2.3. By End User

    10.3. Market Attractiveness Analysis

        10.3.1. By Country

        10.3.2. By Product

        10.3.3. By End User

    10.4. Key Takeaways

11. Eastern Europe Market Analysis 2019 to 2023 and Forecast 2024 to 2034, By Country

    11.1. Historical Market Size Value (US$ Million) & Volume (Units) Trend Analysis By Market Taxonomy, 2019 to 2023

    11.2. Market Size Value (US$ Million) & Volume (Units) Forecast By Market Taxonomy, 2024 to 2034

        11.2.1. By Country

            11.2.1.1. Poland

            11.2.1.2. Russia

            11.2.1.3. Czech Republic

            11.2.1.4. Romania

            11.2.1.5. Rest of Eastern Europe

        11.2.2. By Product

        11.2.3. By End User

    11.3. Market Attractiveness Analysis

        11.3.1. By Country

        11.3.2. By Product

        11.3.3. By End User

    11.4. Key Takeaways

12. South Asia and Pacific Market Analysis 2019 to 2023 and Forecast 2024 to 2034, By Country

    12.1. Historical Market Size Value (US$ Million) & Volume (Units) Trend Analysis By Market Taxonomy, 2019 to 2023

    12.2. Market Size Value (US$ Million) & Volume (Units) Forecast By Market Taxonomy, 2024 to 2034

        12.2.1. By Country

            12.2.1.1. India

            12.2.1.2. Bangladesh

            12.2.1.3. Australia

            12.2.1.4. New Zealand

            12.2.1.5. Rest of South Asia and Pacific

        12.2.2. By Product

        12.2.3. By End User

    12.3. Market Attractiveness Analysis

        12.3.1. By Country

        12.3.2. By Product

        12.3.3. By End User

    12.4. Key Takeaways

13. East Asia Market Analysis 2019 to 2023 and Forecast 2024 to 2034, By Country

    13.1. Historical Market Size Value (US$ Million) & Volume (Units) Trend Analysis By Market Taxonomy, 2019 to 2023

    13.2. Market Size Value (US$ Million) & Volume (Units) Forecast By Market Taxonomy, 2024 to 2034

        13.2.1. By Country

            13.2.1.1. China

            13.2.1.2. Japan

            13.2.1.3. South Korea

        13.2.2. By Product

        13.2.3. By End User

    13.3. Market Attractiveness Analysis

        13.3.1. By Country

        13.3.2. By Product

        13.3.3. By End User

    13.4. Key Takeaways

14. Middle East and Africa Market Analysis 2019 to 2023 and Forecast 2024 to 2034, By Country

    14.1. Historical Market Size Value (US$ Million) & Volume (Units) Trend Analysis By Market Taxonomy, 2019 to 2023

    14.2. Market Size Value (US$ Million) & Volume (Units) Forecast By Market Taxonomy, 2024 to 2034

        14.2.1. By Country

            14.2.1.1. GCC Countries

            14.2.1.2. South Africa

            14.2.1.3. Israel

            14.2.1.4. Rest of MEA

        14.2.2. By Product

        14.2.3. By End User

    14.3. Market Attractiveness Analysis

        14.3.1. By Country

        14.3.2. By Product

        14.3.3. By End User

    14.4. Key Takeaways

15. Key Countries Market Analysis

    15.1. USA

        15.1.1. Pricing Analysis

        15.1.2. Market Share Analysis, 2023

            15.1.2.1. By Product

            15.1.2.2. By End User

    15.2. Canada

        15.2.1. Pricing Analysis

        15.2.2. Market Share Analysis, 2023

            15.2.2.1. By Product

            15.2.2.2. By End User

    15.3. Brazil

        15.3.1. Pricing Analysis

        15.3.2. Market Share Analysis, 2023

            15.3.2.1. By Product

            15.3.2.2. By End User

    15.4. Mexico

        15.4.1. Pricing Analysis

        15.4.2. Market Share Analysis, 2023

            15.4.2.1. By Product

            15.4.2.2. By End User

    15.5. Germany

        15.5.1. Pricing Analysis

        15.5.2. Market Share Analysis, 2023

            15.5.2.1. By Product

            15.5.2.2. By End User

    15.6. UK

        15.6.1. Pricing Analysis

        15.6.2. Market Share Analysis, 2023

            15.6.2.1. By Product

            15.6.2.2. By End User

    15.7. France

        15.7.1. Pricing Analysis

        15.7.2. Market Share Analysis, 2023

            15.7.2.1. By Product

            15.7.2.2. By End User

    15.8. Spain

        15.8.1. Pricing Analysis

        15.8.2. Market Share Analysis, 2023

            15.8.2.1. By Product

            15.8.2.2. By End User

    15.9. Italy

        15.9.1. Pricing Analysis

        15.9.2. Market Share Analysis, 2023

            15.9.2.1. By Product

            15.9.2.2. By End User

    15.10. Poland

        15.10.1. Pricing Analysis

        15.10.2. Market Share Analysis, 2023

            15.10.2.1. By Product

            15.10.2.2. By End User

    15.11. Russia

        15.11.1. Pricing Analysis

        15.11.2. Market Share Analysis, 2023

            15.11.2.1. By Product

            15.11.2.2. By End User

    15.12. Czech Republic

        15.12.1. Pricing Analysis

        15.12.2. Market Share Analysis, 2023

            15.12.2.1. By Product

            15.12.2.2. By End User

    15.13. Romania

        15.13.1. Pricing Analysis

        15.13.2. Market Share Analysis, 2023

            15.13.2.1. By Product

            15.13.2.2. By End User

    15.14. India

        15.14.1. Pricing Analysis

        15.14.2. Market Share Analysis, 2023

            15.14.2.1. By Product

            15.14.2.2. By End User

    15.15. Bangladesh

        15.15.1. Pricing Analysis

        15.15.2. Market Share Analysis, 2023

            15.15.2.1. By Product

            15.15.2.2. By End User

    15.16. Australia

        15.16.1. Pricing Analysis

        15.16.2. Market Share Analysis, 2023

            15.16.2.1. By Product

            15.16.2.2. By End User

    15.17. New Zealand

        15.17.1. Pricing Analysis

        15.17.2. Market Share Analysis, 2023

            15.17.2.1. By Product

            15.17.2.2. By End User

    15.18. China

        15.18.1. Pricing Analysis

        15.18.2. Market Share Analysis, 2023

            15.18.2.1. By Product

            15.18.2.2. By End User

    15.19. Japan

        15.19.1. Pricing Analysis

        15.19.2. Market Share Analysis, 2023

            15.19.2.1. By Product

            15.19.2.2. By End User

    15.20. South Korea

        15.20.1. Pricing Analysis

        15.20.2. Market Share Analysis, 2023

            15.20.2.1. By Product

            15.20.2.2. By End User

    15.21. GCC Countries

        15.21.1. Pricing Analysis

        15.21.2. Market Share Analysis, 2023

            15.21.2.1. By Product

            15.21.2.2. By End User

    15.22. South Africa

        15.22.1. Pricing Analysis

        15.22.2. Market Share Analysis, 2023

            15.22.2.1. By Product

            15.22.2.2. By End User

    15.23. Israel

        15.23.1. Pricing Analysis

        15.23.2. Market Share Analysis, 2023

            15.23.2.1. By Product

            15.23.2.2. By End User

16. Market Structure Analysis

    16.1. Competition Dashboard

    16.2. Competition Benchmarking

    16.3. Market Share Analysis of Top Players

        16.3.1. By Regional

        16.3.2. By Product

        16.3.3. By End User

17. Competition Analysis

    17.1. Competition Deep Dive

        17.1.1. Medtronic PLC

            17.1.1.1. Overview

            17.1.1.2. Product Portfolio

            17.1.1.3. Profitability by Market Segments

            17.1.1.4. Sales Footprint

            17.1.1.5. Strategy Overview

                17.1.1.5.1. Marketing Strategy

                17.1.1.5.2. Product Strategy

                17.1.1.5.3. Channel Strategy

        17.1.2. BioTelemetry, Inc

            17.1.2.1. Overview

            17.1.2.2. Product Portfolio

            17.1.2.3. Profitability by Market Segments

            17.1.2.4. Sales Footprint

            17.1.2.5. Strategy Overview

                17.1.2.5.1. Marketing Strategy

                17.1.2.5.2. Product Strategy

                17.1.2.5.3. Channel Strategy

        17.1.3. ScottCare

            17.1.3.1. Overview

            17.1.3.2. Product Portfolio

            17.1.3.3. Profitability by Market Segments

            17.1.3.4. Sales Footprint

            17.1.3.5. Strategy Overview

                17.1.3.5.1. Marketing Strategy

                17.1.3.5.2. Product Strategy

                17.1.3.5.3. Channel Strategy

        17.1.4. Airtricity Inc

            17.1.4.1. Overview

            17.1.4.2. Product Portfolio

            17.1.4.3. Profitability by Market Segments

            17.1.4.4. Sales Footprint

            17.1.4.5. Strategy Overview

                17.1.4.5.1. Marketing Strategy

                17.1.4.5.2. Product Strategy

                17.1.4.5.3. Channel Strategy

        17.1.5. Welch Allyn

            17.1.5.1. Overview

            17.1.5.2. Product Portfolio

            17.1.5.3. Profitability by Market Segments

            17.1.5.4. Sales Footprint

            17.1.5.5. Strategy Overview

                17.1.5.5.1. Marketing Strategy

                17.1.5.5.2. Product Strategy

                17.1.5.5.3. Channel Strategy

        17.1.6. Applied Cardiac Systems Inc.

            17.1.6.1. Overview

            17.1.6.2. Product Portfolio

            17.1.6.3. Profitability by Market Segments

            17.1.6.4. Sales Footprint

            17.1.6.5. Strategy Overview

                17.1.6.5.1. Marketing Strategy

                17.1.6.5.2. Product Strategy

                17.1.6.5.3. Channel Strategy

        17.1.7. Medicomp Inc

            17.1.7.1. Overview

            17.1.7.2. Product Portfolio

            17.1.7.3. Profitability by Market Segments

            17.1.7.4. Sales Footprint

            17.1.7.5. Strategy Overview

                17.1.7.5.1. Marketing Strategy

                17.1.7.5.2. Product Strategy

                17.1.7.5.3. Channel Strategy

        17.1.8. Preventice Solutions

            17.1.8.1. Overview

            17.1.8.2. Product Portfolio

            17.1.8.3. Profitability by Market Segments

            17.1.8.4. Sales Footprint

            17.1.8.5. Strategy Overview

                17.1.8.5.1. Marketing Strategy

                17.1.8.5.2. Product Strategy

                17.1.8.5.3. Channel Strategy

        17.1.9. Telerhythmics LLC

            17.1.9.1. Overview

            17.1.9.2. Product Portfolio

            17.1.9.3. Profitability by Market Segments

            17.1.9.4. Sales Footprint

            17.1.9.5. Strategy Overview

                17.1.9.5.1. Marketing Strategy

                17.1.9.5.2. Product Strategy

                17.1.9.5.3. Channel Strategy

        17.1.10. Zoll Medical Corporation

            17.1.10.1. Overview

            17.1.10.2. Product Portfolio

            17.1.10.3. Profitability by Market Segments

            17.1.10.4. Sales Footprint

            17.1.10.5. Strategy Overview

                17.1.10.5.1. Marketing Strategy

                17.1.10.5.2. Product Strategy

                17.1.10.5.3. Channel Strategy

18. Assumptions & Acronyms Used

19. Research Methodology

Don't pay for what you don't need

Customize your report by selecting specific countries or regions and save 30%!

List of Tables

Table 1: Global Market Value (US$ Million) Forecast by Region, 2019 to 2034

Table 2: Global Market Volume (Units) Forecast by Region, 2019 to 2034

Table 3: Global Market Value (US$ Million) Forecast by Product, 2019 to 2034

Table 4: Global Market Volume (Units) Forecast by Product, 2019 to 2034

Table 5: Global Market Value (US$ Million) Forecast by End User, 2019 to 2034

Table 6: Global Market Volume (Units) Forecast by End User, 2019 to 2034

Table 7: North America Market Value (US$ Million) Forecast by Country, 2019 to 2034

Table 8: North America Market Volume (Units) Forecast by Country, 2019 to 2034

Table 9: North America Market Value (US$ Million) Forecast by Product, 2019 to 2034

Table 10: North America Market Volume (Units) Forecast by Product, 2019 to 2034

Table 11: North America Market Value (US$ Million) Forecast by End User, 2019 to 2034

Table 12: North America Market Volume (Units) Forecast by End User, 2019 to 2034

Table 13: Latin America Market Value (US$ Million) Forecast by Country, 2019 to 2034

Table 14: Latin America Market Volume (Units) Forecast by Country, 2019 to 2034

Table 15: Latin America Market Value (US$ Million) Forecast by Product, 2019 to 2034

Table 16: Latin America Market Volume (Units) Forecast by Product, 2019 to 2034

Table 17: Latin America Market Value (US$ Million) Forecast by End User, 2019 to 2034

Table 18: Latin America Market Volume (Units) Forecast by End User, 2019 to 2034

Table 19: Western Europe Market Value (US$ Million) Forecast by Country, 2019 to 2034

Table 20: Western Europe Market Volume (Units) Forecast by Country, 2019 to 2034

Table 21: Western Europe Market Value (US$ Million) Forecast by Product, 2019 to 2034

Table 22: Western Europe Market Volume (Units) Forecast by Product, 2019 to 2034

Table 23: Western Europe Market Value (US$ Million) Forecast by End User, 2019 to 2034

Table 24: Western Europe Market Volume (Units) Forecast by End User, 2019 to 2034

Table 25: Eastern Europe Market Value (US$ Million) Forecast by Country, 2019 to 2034

Table 26: Eastern Europe Market Volume (Units) Forecast by Country, 2019 to 2034

Table 27: Eastern Europe Market Value (US$ Million) Forecast by Product, 2019 to 2034

Table 28: Eastern Europe Market Volume (Units) Forecast by Product, 2019 to 2034

Table 29: Eastern Europe Market Value (US$ Million) Forecast by End User, 2019 to 2034

Table 30: Eastern Europe Market Volume (Units) Forecast by End User, 2019 to 2034

Table 31: South Asia and Pacific Market Value (US$ Million) Forecast by Country, 2019 to 2034

Table 32: South Asia and Pacific Market Volume (Units) Forecast by Country, 2019 to 2034

Table 33: South Asia and Pacific Market Value (US$ Million) Forecast by Product, 2019 to 2034

Table 34: South Asia and Pacific Market Volume (Units) Forecast by Product, 2019 to 2034

Table 35: South Asia and Pacific Market Value (US$ Million) Forecast by End User, 2019 to 2034

Table 36: South Asia and Pacific Market Volume (Units) Forecast by End User, 2019 to 2034

Table 37: East Asia Market Value (US$ Million) Forecast by Country, 2019 to 2034

Table 38: East Asia Market Volume (Units) Forecast by Country, 2019 to 2034

Table 39: East Asia Market Value (US$ Million) Forecast by Product, 2019 to 2034

Table 40: East Asia Market Volume (Units) Forecast by Product, 2019 to 2034

Table 41: East Asia Market Value (US$ Million) Forecast by End User, 2019 to 2034

Table 42: East Asia Market Volume (Units) Forecast by End User, 2019 to 2034

Table 43: Middle East and Africa Market Value (US$ Million) Forecast by Country, 2019 to 2034

Table 44: Middle East and Africa Market Volume (Units) Forecast by Country, 2019 to 2034

Table 45: Middle East and Africa Market Value (US$ Million) Forecast by Product, 2019 to 2034

Table 46: Middle East and Africa Market Volume (Units) Forecast by Product, 2019 to 2034

Table 47: Middle East and Africa Market Value (US$ Million) Forecast by End User, 2019 to 2034

Table 48: Middle East and Africa Market Volume (Units) Forecast by End User, 2019 to 2034
Sabyasachi Ghosh
Sabyasachi Ghosh

Principal Consultant

Talk to Analyst

Find your sweet spots for generating winning opportunities in this market.

List of Charts

Figure 1: Global Market Value (US$ Million) by Product, 2024 to 2034

Figure 2: Global Market Value (US$ Million) by End User, 2024 to 2034

Figure 3: Global Market Value (US$ Million) by Region, 2024 to 2034

Figure 4: Global Market Value (US$ Million) Analysis by Region, 2019 to 2034

Figure 5: Global Market Volume (Units) Analysis by Region, 2019 to 2034

Figure 6: Global Market Value Share (%) and BPS Analysis by Region, 2024 to 2034

Figure 7: Global Market Y-o-Y Growth (%) Projections by Region, 2024 to 2034

Figure 8: Global Market Value (US$ Million) Analysis by Product, 2019 to 2034

Figure 9: Global Market Volume (Units) Analysis by Product, 2019 to 2034

Figure 10: Global Market Value Share (%) and BPS Analysis by Product, 2024 to 2034

Figure 11: Global Market Y-o-Y Growth (%) Projections by Product, 2024 to 2034

Figure 12: Global Market Value (US$ Million) Analysis by End User, 2019 to 2034

Figure 13: Global Market Volume (Units) Analysis by End User, 2019 to 2034

Figure 14: Global Market Value Share (%) and BPS Analysis by End User, 2024 to 2034

Figure 15: Global Market Y-o-Y Growth (%) Projections by End User, 2024 to 2034

Figure 16: Global Market Attractiveness by Product, 2024 to 2034

Figure 17: Global Market Attractiveness by End User, 2024 to 2034

Figure 18: Global Market Attractiveness by Region, 2024 to 2034

Figure 19: North America Market Value (US$ Million) by Product, 2024 to 2034

Figure 20: North America Market Value (US$ Million) by End User, 2024 to 2034

Figure 21: North America Market Value (US$ Million) by Country, 2024 to 2034

Figure 22: North America Market Value (US$ Million) Analysis by Country, 2019 to 2034

Figure 23: North America Market Volume (Units) Analysis by Country, 2019 to 2034

Figure 24: North America Market Value Share (%) and BPS Analysis by Country, 2024 to 2034

Figure 25: North America Market Y-o-Y Growth (%) Projections by Country, 2024 to 2034

Figure 26: North America Market Value (US$ Million) Analysis by Product, 2019 to 2034

Figure 27: North America Market Volume (Units) Analysis by Product, 2019 to 2034

Figure 28: North America Market Value Share (%) and BPS Analysis by Product, 2024 to 2034

Figure 29: North America Market Y-o-Y Growth (%) Projections by Product, 2024 to 2034

Figure 30: North America Market Value (US$ Million) Analysis by End User, 2019 to 2034

Figure 31: North America Market Volume (Units) Analysis by End User, 2019 to 2034

Figure 32: North America Market Value Share (%) and BPS Analysis by End User, 2024 to 2034

Figure 33: North America Market Y-o-Y Growth (%) Projections by End User, 2024 to 2034

Figure 34: North America Market Attractiveness by Product, 2024 to 2034

Figure 35: North America Market Attractiveness by End User, 2024 to 2034

Figure 36: North America Market Attractiveness by Country, 2024 to 2034

Figure 37: Latin America Market Value (US$ Million) by Product, 2024 to 2034

Figure 38: Latin America Market Value (US$ Million) by End User, 2024 to 2034

Figure 39: Latin America Market Value (US$ Million) by Country, 2024 to 2034

Figure 40: Latin America Market Value (US$ Million) Analysis by Country, 2019 to 2034

Figure 41: Latin America Market Volume (Units) Analysis by Country, 2019 to 2034

Figure 42: Latin America Market Value Share (%) and BPS Analysis by Country, 2024 to 2034

Figure 43: Latin America Market Y-o-Y Growth (%) Projections by Country, 2024 to 2034

Figure 44: Latin America Market Value (US$ Million) Analysis by Product, 2019 to 2034

Figure 45: Latin America Market Volume (Units) Analysis by Product, 2019 to 2034

Figure 46: Latin America Market Value Share (%) and BPS Analysis by Product, 2024 to 2034

Figure 47: Latin America Market Y-o-Y Growth (%) Projections by Product, 2024 to 2034

Figure 48: Latin America Market Value (US$ Million) Analysis by End User, 2019 to 2034

Figure 49: Latin America Market Volume (Units) Analysis by End User, 2019 to 2034

Figure 50: Latin America Market Value Share (%) and BPS Analysis by End User, 2024 to 2034

Figure 51: Latin America Market Y-o-Y Growth (%) Projections by End User, 2024 to 2034

Figure 52: Latin America Market Attractiveness by Product, 2024 to 2034

Figure 53: Latin America Market Attractiveness by End User, 2024 to 2034

Figure 54: Latin America Market Attractiveness by Country, 2024 to 2034

Figure 55: Western Europe Market Value (US$ Million) by Product, 2024 to 2034

Figure 56: Western Europe Market Value (US$ Million) by End User, 2024 to 2034

Figure 57: Western Europe Market Value (US$ Million) by Country, 2024 to 2034

Figure 58: Western Europe Market Value (US$ Million) Analysis by Country, 2019 to 2034

Figure 59: Western Europe Market Volume (Units) Analysis by Country, 2019 to 2034

Figure 60: Western Europe Market Value Share (%) and BPS Analysis by Country, 2024 to 2034

Figure 61: Western Europe Market Y-o-Y Growth (%) Projections by Country, 2024 to 2034

Figure 62: Western Europe Market Value (US$ Million) Analysis by Product, 2019 to 2034

Figure 63: Western Europe Market Volume (Units) Analysis by Product, 2019 to 2034

Figure 64: Western Europe Market Value Share (%) and BPS Analysis by Product, 2024 to 2034

Figure 65: Western Europe Market Y-o-Y Growth (%) Projections by Product, 2024 to 2034

Figure 66: Western Europe Market Value (US$ Million) Analysis by End User, 2019 to 2034

Figure 67: Western Europe Market Volume (Units) Analysis by End User, 2019 to 2034

Figure 68: Western Europe Market Value Share (%) and BPS Analysis by End User, 2024 to 2034

Figure 69: Western Europe Market Y-o-Y Growth (%) Projections by End User, 2024 to 2034

Figure 70: Western Europe Market Attractiveness by Product, 2024 to 2034

Figure 71: Western Europe Market Attractiveness by End User, 2024 to 2034

Figure 72: Western Europe Market Attractiveness by Country, 2024 to 2034

Figure 73: Eastern Europe Market Value (US$ Million) by Product, 2024 to 2034

Figure 74: Eastern Europe Market Value (US$ Million) by End User, 2024 to 2034

Figure 75: Eastern Europe Market Value (US$ Million) by Country, 2024 to 2034

Figure 76: Eastern Europe Market Value (US$ Million) Analysis by Country, 2019 to 2034

Figure 77: Eastern Europe Market Volume (Units) Analysis by Country, 2019 to 2034

Figure 78: Eastern Europe Market Value Share (%) and BPS Analysis by Country, 2024 to 2034

Figure 79: Eastern Europe Market Y-o-Y Growth (%) Projections by Country, 2024 to 2034

Figure 80: Eastern Europe Market Value (US$ Million) Analysis by Product, 2019 to 2034

Figure 81: Eastern Europe Market Volume (Units) Analysis by Product, 2019 to 2034

Figure 82: Eastern Europe Market Value Share (%) and BPS Analysis by Product, 2024 to 2034

Figure 83: Eastern Europe Market Y-o-Y Growth (%) Projections by Product, 2024 to 2034

Figure 84: Eastern Europe Market Value (US$ Million) Analysis by End User, 2019 to 2034

Figure 85: Eastern Europe Market Volume (Units) Analysis by End User, 2019 to 2034

Figure 86: Eastern Europe Market Value Share (%) and BPS Analysis by End User, 2024 to 2034

Figure 87: Eastern Europe Market Y-o-Y Growth (%) Projections by End User, 2024 to 2034

Figure 88: Eastern Europe Market Attractiveness by Product, 2024 to 2034

Figure 89: Eastern Europe Market Attractiveness by End User, 2024 to 2034

Figure 90: Eastern Europe Market Attractiveness by Country, 2024 to 2034

Figure 91: South Asia and Pacific Market Value (US$ Million) by Product, 2024 to 2034

Figure 92: South Asia and Pacific Market Value (US$ Million) by End User, 2024 to 2034

Figure 93: South Asia and Pacific Market Value (US$ Million) by Country, 2024 to 2034

Figure 94: South Asia and Pacific Market Value (US$ Million) Analysis by Country, 2019 to 2034

Figure 95: South Asia and Pacific Market Volume (Units) Analysis by Country, 2019 to 2034

Figure 96: South Asia and Pacific Market Value Share (%) and BPS Analysis by Country, 2024 to 2034

Figure 97: South Asia and Pacific Market Y-o-Y Growth (%) Projections by Country, 2024 to 2034

Figure 98: South Asia and Pacific Market Value (US$ Million) Analysis by Product, 2019 to 2034

Figure 99: South Asia and Pacific Market Volume (Units) Analysis by Product, 2019 to 2034

Figure 100: South Asia and Pacific Market Value Share (%) and BPS Analysis by Product, 2024 to 2034

Figure 101: South Asia and Pacific Market Y-o-Y Growth (%) Projections by Product, 2024 to 2034

Figure 102: South Asia and Pacific Market Value (US$ Million) Analysis by End User, 2019 to 2034

Figure 103: South Asia and Pacific Market Volume (Units) Analysis by End User, 2019 to 2034

Figure 104: South Asia and Pacific Market Value Share (%) and BPS Analysis by End User, 2024 to 2034

Figure 105: South Asia and Pacific Market Y-o-Y Growth (%) Projections by End User, 2024 to 2034

Figure 106: South Asia and Pacific Market Attractiveness by Product, 2024 to 2034

Figure 107: South Asia and Pacific Market Attractiveness by End User, 2024 to 2034

Figure 108: South Asia and Pacific Market Attractiveness by Country, 2024 to 2034

Figure 109: East Asia Market Value (US$ Million) by Product, 2024 to 2034

Figure 110: East Asia Market Value (US$ Million) by End User, 2024 to 2034

Figure 111: East Asia Market Value (US$ Million) by Country, 2024 to 2034

Figure 112: East Asia Market Value (US$ Million) Analysis by Country, 2019 to 2034

Figure 113: East Asia Market Volume (Units) Analysis by Country, 2019 to 2034

Figure 114: East Asia Market Value Share (%) and BPS Analysis by Country, 2024 to 2034

Figure 115: East Asia Market Y-o-Y Growth (%) Projections by Country, 2024 to 2034

Figure 116: East Asia Market Value (US$ Million) Analysis by Product, 2019 to 2034

Figure 117: East Asia Market Volume (Units) Analysis by Product, 2019 to 2034

Figure 118: East Asia Market Value Share (%) and BPS Analysis by Product, 2024 to 2034

Figure 119: East Asia Market Y-o-Y Growth (%) Projections by Product, 2024 to 2034

Figure 120: East Asia Market Value (US$ Million) Analysis by End User, 2019 to 2034

Figure 121: East Asia Market Volume (Units) Analysis by End User, 2019 to 2034

Figure 122: East Asia Market Value Share (%) and BPS Analysis by End User, 2024 to 2034

Figure 123: East Asia Market Y-o-Y Growth (%) Projections by End User, 2024 to 2034

Figure 124: East Asia Market Attractiveness by Product, 2024 to 2034

Figure 125: East Asia Market Attractiveness by End User, 2024 to 2034

Figure 126: East Asia Market Attractiveness by Country, 2024 to 2034

Figure 127: Middle East and Africa Market Value (US$ Million) by Product, 2024 to 2034

Figure 128: Middle East and Africa Market Value (US$ Million) by End User, 2024 to 2034

Figure 129: Middle East and Africa Market Value (US$ Million) by Country, 2024 to 2034

Figure 130: Middle East and Africa Market Value (US$ Million) Analysis by Country, 2019 to 2034

Figure 131: Middle East and Africa Market Volume (Units) Analysis by Country, 2019 to 2034

Figure 132: Middle East and Africa Market Value Share (%) and BPS Analysis by Country, 2024 to 2034

Figure 133: Middle East and Africa Market Y-o-Y Growth (%) Projections by Country, 2024 to 2034

Figure 134: Middle East and Africa Market Value (US$ Million) Analysis by Product, 2019 to 2034

Figure 135: Middle East and Africa Market Volume (Units) Analysis by Product, 2019 to 2034

Figure 136: Middle East and Africa Market Value Share (%) and BPS Analysis by Product, 2024 to 2034

Figure 137: Middle East and Africa Market Y-o-Y Growth (%) Projections by Product, 2024 to 2034

Figure 138: Middle East and Africa Market Value (US$ Million) Analysis by End User, 2019 to 2034

Figure 139: Middle East and Africa Market Volume (Units) Analysis by End User, 2019 to 2034

Figure 140: Middle East and Africa Market Value Share (%) and BPS Analysis by End User, 2024 to 2034

Figure 141: Middle East and Africa Market Y-o-Y Growth (%) Projections by End User, 2024 to 2034

Figure 142: Middle East and Africa Market Attractiveness by Product, 2024 to 2034

Figure 143: Middle East and Africa Market Attractiveness by End User, 2024 to 2034

Figure 144: Middle East and Africa Market Attractiveness by Country, 2024 to 2034

Recommendations

Healthcare

Cardiac Assist Devices Market

Published : June 2023

Healthcare

Cardiac Ambulatory Monitoring Market

Published : October 2022

Explore Healthcare Insights

View Reports

Mobile Cardiac Telemetry System Market