Mobile Application Testing Solution Market Outlook for 2025 to 2035

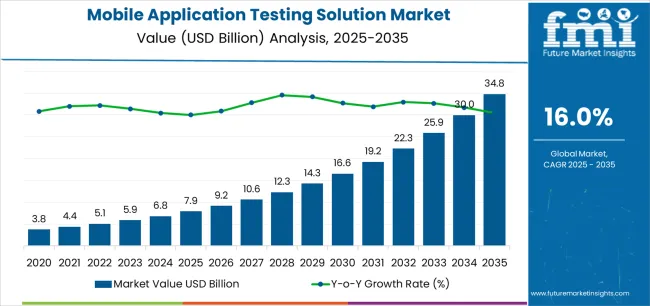
The Mobile Application Testing Solution Market is estimated to be valued at USD 7.9 billion in 2025 and is projected to reach USD 34.8 billion by 2035, registering a compound annual growth rate (CAGR) of 16.0% over the forecast period.

The mobile application testing solution market is experiencing strong growth driven by the rapid proliferation of mobile applications, increasing demand for seamless user experiences, and the need for quality assurance across diverse devices and operating systems. Market participants are focusing on improving test accuracy, scalability, and automation capabilities to address complex application ecosystems.

The current scenario reflects a shift toward continuous testing models integrated within agile and DevOps environments, enabling faster release cycles and higher product reliability. The future outlook remains positive as organizations prioritize digital transformation, cloud-based testing frameworks, and artificial intelligence-driven testing tools to optimize performance and minimize defects.

Growth rationale is anchored in the rising complexity of mobile architectures, increasing adoption of hybrid and cross-platform apps, and growing enterprise focus on security and compliance testing These factors collectively reinforce the importance of efficient testing solutions that ensure functionality, stability, and superior end-user experiences across global markets.
Quick Stats for Mobile Application Testing Solution Market

  • Mobile Application Testing Solution Market Industry Value (2025): USD 7.9 billion
  • Mobile Application Testing Solution Market Forecast Value (2035): USD 34.8 billion
  • Mobile Application Testing Solution Market Forecast CAGR: 16.0%
  • Leading Segment in Mobile Application Testing Solution Market in 2025: Services (59.4%)
  • Key Growth Region in Mobile Application Testing Solution Market: North America, Asia-Pacific, Europe
  • Top Key Players in Mobile Application Testing Solution Market: IBM Corporation, Oracle Corporation, Hewlett Packard Enterprise, Microsoft Corporation, Cognizant Technology Solution Corp., SAP SE, Wipro Limited, CA Technologies, Symantec Corporation, Capgemini

Mobile Application Testing Solution Market Market Value Analysis

Metric Value
Mobile Application Testing Solution Market Estimated Value in (2025 E) USD 7.9 billion
Mobile Application Testing Solution Market Forecast Value in (2035 F) USD 34.8 billion
Forecast CAGR (2025 to 2035) 16.0%

Segmental Analysis:

The market is segmented by Solution, Testing Type, Platform, Device, and End User and region. By Solution, the market is divided into Services and Testing Tools. In terms of Testing Type, the market is classified into Automated Testing and Interactive Testing. Based on Platform, the market is segmented into Android, iOS, Windows, and Other Platforms. By Device, the market is divided into Smartphone and Tablet. By End User, the market is segmented into Corporate and Residential. Regionally, the market is classified into North America, Latin America, Western Europe, Eastern Europe, Balkan & Baltic Countries, Russia & Belarus, Central Asia, East Asia, South Asia & Pacific, and the Middle East & Africa.
Insights into the Solution Segment:

Mobile Application Testing Solution Market Analysis By Solution

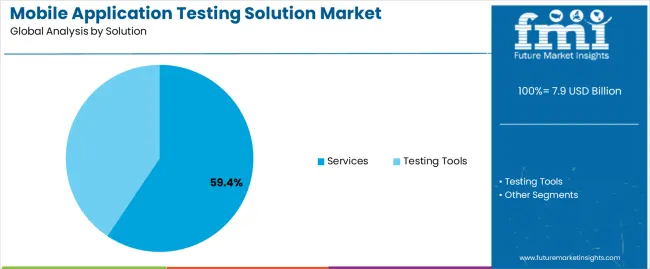
The services segment, accounting for 59.40% of the solution category, has emerged as the leading component due to its integral role in providing end-to-end testing support, from test design and execution to maintenance and continuous optimization. Market dominance is being reinforced by the growing reliance of enterprises on third-party service providers to manage complex testing environments.

Service providers are leveraging automation frameworks, cloud infrastructure, and advanced analytics to deliver faster and more reliable testing outcomes. Demand has been further strengthened by the scalability and flexibility these services offer to accommodate diverse client requirements.

Strategic partnerships and managed testing models have enhanced service quality and reduced operational costs As digital ecosystems expand, the service segment is expected to maintain its leadership through continuous innovation, strong domain expertise, and value-added testing capabilities tailored to dynamic application landscapes.
Insights into the Testing Type Segment:

Mobile Application Testing Solution Market Analysis By Testing Type

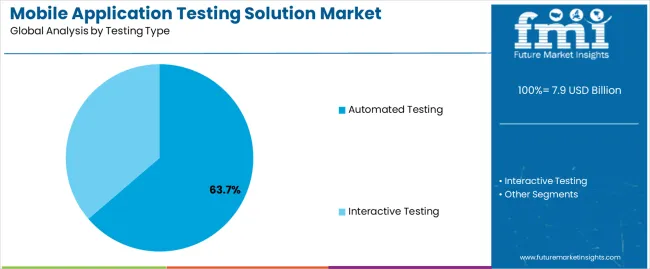
The automated testing segment, holding 63.70% of the testing type category, has secured its leading position due to its ability to accelerate testing cycles, enhance accuracy, and support large-scale mobile deployments. Growing adoption of agile and DevOps methodologies has necessitated the integration of automation to ensure rapid release and continuous improvement.

The segment’s expansion is being supported by advancements in AI and machine learning, enabling intelligent test creation, predictive analysis, and adaptive testing strategies. Cost efficiency and reduced human error are key benefits driving market preference.

Automated frameworks compatible with multiple platforms and environments have also improved test coverage and reusability As the complexity of mobile applications increases, automated testing is expected to remain indispensable for ensuring performance, reliability, and compliance, thereby solidifying its dominant role in the overall testing ecosystem.
Insights into the Platform Segment:

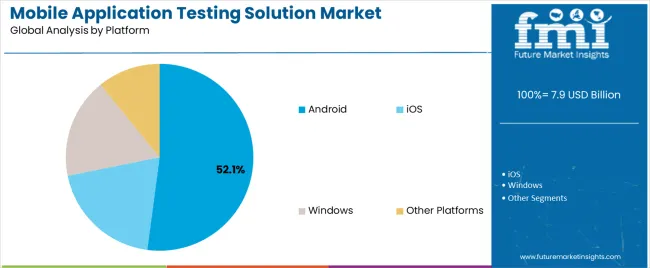
Mobile Application Testing Solution Market Analysis By Platform

The Android segment, representing 52.10% of the platform category, has maintained its dominance due to the widespread use of Android devices globally and the diversity of hardware configurations requiring comprehensive testing. The segment benefits from the open-source nature of the Android ecosystem, which allows extensive customization and scalability for testing frameworks.

High market share is also attributed to the growing demand for Android-based enterprise and consumer applications, necessitating continuous validation for compatibility, performance, and security. The availability of cloud-based Android testing platforms has improved efficiency by enabling parallel testing across multiple devices.

Continuous updates to the operating system and varying device specifications have intensified the need for advanced testing solutions With expanding mobile penetration and developer adoption, the Android segment is expected to sustain its leadership, supported by innovations in test automation and continuous integration processes.

Mobile Application Testing Solution Market Trends & Analysis

  • The ever-rising threats and complexities in the case of mobile applications are motivating enterprises to improve mobile application test coverage for their business suite. Both public and private organizations are finding it critical to develop required frameworks and strategize test automation processes.
  • The demand for automated mobile application testing solutions is rising rapidly as the solution assures efficient functionality and performs tests frequently to obtain desired outcomes under varied situations. Such mobile application testing solutions incorporate various use cases and scenarios for efficient testing purposes.

Global Mobile Application Testing Solution Market Historical Analysis Vs Forecast Outlook

The global mobile app testing solution market was valued at USD 3.8 billion in 2020. The sales of mobile application testing solutions grew at a rate of 13.9% between 2020 and 2025. The overall market value was about USD 7.9 billion by 2025.

The mobile application testing solutions market was nearly 45% of the global application testing market until 2025. The market's growth during this period can be attributed to the increased demand for regression testing and addressing faults and malfunctions in applications across numerous devices.

Attributes Details
Mobile Application Testing Solution Market Value (2020) USD 3.8 billion
Market Revenue (2025) USD 7.9 billion
Market Historical Growth Rate (CAGR 2020 to 2025) 13.9% CAGR

Key Factors for the Global Mobile Application Testing Solution Market Growth

Applications and data are becoming increasingly open and visible to external constituents, particularly customers, as a result of digital business and customer experience. Mobile testing trends and tactics change regularly to keep up with the changing demands of tech-savvy consumers and technological breakthroughs.

The expansion of the mobile application testing solutions market is being fueled by the increased popularity of m-commerce and the resulting increase in demand for mobile applications.

Applications from banking and financial institutes are likely to boost the adoption of mobile application testing services as several countries are initiating plans to digitize their economy through the adoption of mobile payment solutions.

Country-wise Insights

The table below lists the countries with the most lucrative opportunities for mobile application testing solution providers.

Regional Market Comparison CAGR (2025 to 2035)
United States 13.7%
Germany 4.3%
Japan 5.6%
Australia & New Zealand 20.3%
China 17.3%

The United States Leads in Technological Advancement of Software Testing Tools

The mobile application testing services (MATS) market in the United States is anticipated to expand at a robust CAGR of 13.7% from 2025 to 2035. The country is also expected to account for over 89.5% of the total market share in the North American region.

  • The United States is one of the leaders in the mobile industry owing to significant investments in the technology sector.
  • The country is quick to embrace new technologies such as IoT and AI which is also driving the growth of the mobile app quality assurance market. For instance, in June 2020, Oracle released Oracle Mobile Application Framework (MAF) 2.5.1.

Greater Prospects for Mobile Application Testing Solutions Unfolding in Germany

Overall mobile application testing solutions spending in Germany is likely to increase at a rate of 4.3% from 2025 to 2035.

  • Germany is currently the favored center for software or mobile application developing companies operating in the Europe market.
  • Usage of m-commerce distribution channels is estimated to increase with the rise in users opting for online wallets and e-Payment features in Germany.

Huge Smartphone User Base Presents Enough Opportunities for Chinese Companies

The mobile application testing solution industry in China is projected to expand at a CAGR of 17.3% through the projected years.

  • China already has a huge base of smartphone users.
  • As there has been a steep rise in the development of Chinese mobile apps, testing solution providers in the country have witnessed enormous growth opportunities.

The evolving Financial Sector is driving the MATS Market in Japan

Demand for mobile application testing solutions in Japan is anticipated to thrive with a 5.6% CAGR in the upcoming ten years.

  • Growing adoption of smartphones and tablets among Japanese people.
  • Developers in the country are offering advanced testing for mobile applications used for banking and financial services.

The Australia and New Zealand are emerging to be the Lucrative Markets

The combined region of Australia and New Zealand is expected to showcase an impressive CAGR of 20.3% over the forecast period.

  • Australia and New Zealand are found to be emerging markets with increasing adoption of new technologies and a rising number of IoT-connected devices.
  • Favorable market laws are attracting global software companies to get established in these two countries.

Category-wise Insights

Mobile Application Testing Tools are in Greater Demand than Services

Based on the solution type, the testing tool segment is estimated to garner a revenue of around 62% in 2025.

Attributes Details
Top Solution Type or Segment Testing Tool
Market Share in 2025 62%
  • Demand for automated mobile application testing tools is rising as testing of mobile applications is performed at a granular level, based on the various use cases.
  • Smartphones having unique dimensions are anticipated to continue to make mobile application testing tools more complicated.

Android Applications are More Popular than Other Operating Platforms

Based on platforms, the Android mobile device segment is expected to generate a business opportunity of 38.9% in 2025.

Attributes Details
Top Platform Type or Segment Android devices
Market Share in 2025 38.9%
  • Android developers are strategizing test automation frameworks designed in ways that would make mobile applications more responsive, compatible, and reliable across a diverse range of smartphone devices.
  • Currently, the marketplace is concentrated on new smartphone handsets having diverse operating systems or platforms, configurations, and specifications.

Competitive Landscape for Mobile Application Testing Solution Market

Mobile Application Testing Solution Market Analysis By Company

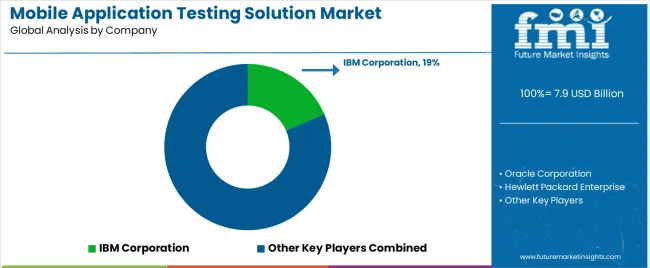
The overall market is moderately competitive as the leading software testing solution providers capture more than half of the market share. Leading developers are offering mobile application testing automation solutions that facilitate full visibility, which in turn enables testing teams to gain transparency across each issue in the application being tested.

Key providers of mobile application testing solutions are focusing on adding new innovative capabilities to their current testing solutions. This is helping them to enhance and upgrade their mobile application testing solutions portfolio.

Recent Developments in the Global Mobile Application Testing Solution Market

In April 2025, software testing platform Sofy introduced a novel mobile app testing solution SofySense. This new solution improves on Sofy's previous platform and combines artificial intelligence (AI) with no-code automation. It uses intelligent software testing with GPT integration to help with quality assurance (QA).

The platform's intelligent generative AI chatbot, Sofybot, provides precise and timely answers to particular test requests. The new tool can streamline software testing for software engineers freeing up testers to focus on other vital activities. According to Sofy, it can expedite product delivery timelines by 95%.

In May 2025, EMAS Mobile Testing introduced a cloud-based platform that offers mobile developers and businesses device testing services. Besides, offering a wide range of well-liked models, it also provides a round-the-clock service to assist app developers in identifying any hidden dangers such as software crashes, issues with compatibility, performance problems, and more. In addition, enhancing the quality of the app and user experience lowers user dropout and increases market competitiveness.

In June 2020, IBM announced the expansion of quantum computing efforts to Africa in a new collaboration with the University of the Witwatersrand (Wits University) in South Africa. Expanding the IBM Q Network to include Wits is expected to drive innovation to benefit African-based researchers.

In May 2020, SAP SE announced the project “Embrace,” a collaboration program with Microsoft Azure, Amazon Web Services, and Google Cloud as well as global strategic service partners (GSSPs). “Embrace” puts the customer’s move to SAP S/4HANA in the cloud in the language and context of their primary industry, by recommending the platform, software, and services.

Key Players Profiled in the Mobile Application Testing Solution Market Report

  • Oracle Corporation
  • Hewlett Packard Enterprise
  • IBM Corporation
  • Microsoft Corporation
  • Cognizant Technology Solution Corp.
  • SAP SE
  • Wipro Limited
  • CA Technologies
  • Symantec Corporation
  • Capgemini

Key Coverage in the Mobile Application Testing Solution Market Report

  • Adjacent study on mobile testing market.
  • Importance of mobile application testing in developing nations.
  • Significance of mobile app testing process.
  • Demand analysis of mobile application security testing.

Mobile Application Testing Solution Market Report Scope

Attribute Details
Estimated Market Size (2025) USD 6.77 billion
Projected Market Size (2035) USD 31.99 billion
Anticipated Growth Rate (2025 to 2035) 16.8%
Forecast Period 2025 to 2035
Historical Data Available for 2020 to 2025
Market Analysis USD million or billion for Value and Units for Volume
Key Regions Covered North America; Latin America; Europe; Middle East & Africa (MEA); East Asia; South Asia and Oceania
Key Countries Covered United States, Canada, Brazil, Mexico, Germany, Spain, Italy, France, United Kingdom, Russia, China, India, Australia & New Zealand, GCC Countries, and South Africa
Key Segments Covered By Type, By Platform, By Device, By End User Verticals, and By Region
Key Companies Profiled Oracle Corporation; Hewlett Packard Enterprise; IBM Corporation; Microsoft Corporation; Cognizant Technology Solution Corp; SAP SE; Wipro Limited; CA Technologies; Symantec Corporation; Capgemini
Report Coverage Market Forecast, Company Share Analysis, Competition Intelligence, DROT Analysis, Market Dynamics and Challenges, and Strategic Growth Initiatives
Customization & Pricing Available upon Request

Key Segments Covered by Mobile Application Testing Solution Industry Survey Report

By Solution:

  • Testing Tools
    • Manual Testing Tool
    • Automated Testing Tool
  • Services
    • Mobile App Testing Services
    • Consulting Services
    • Support & Maintenance

By Testing Type:

  • Interactive Testing
  • Automated Testing

By Platform:

  • Android
  • iOS
  • Windows
  • Other Platforms

By Device:

  • Smartphone
  • Tablet

By End User:

  • Residential
  • Corporate
    • Small Enterprises (Less than 1,000 Employees)
    • Medium Enterprises (1,000 to 5,000 Employees)
    • Large Enterprises (1,000 to 5,000 Employees)

By Region:

  • North America
  • Latin America
  • Europe
  • East Asia
  • South Asia and Pacific
  • Middle East and Africa (MEA)

Frequently Asked Questions

How big is the mobile application testing solution market in 2025?

The global mobile application testing solution market is estimated to be valued at USD 7.9 billion in 2025.

What will be the size of mobile application testing solution market in 2035?

The market size for the mobile application testing solution market is projected to reach USD 34.8 billion by 2035.

How much will be the mobile application testing solution market growth between 2025 and 2035?

The mobile application testing solution market is expected to grow at a 16.0% CAGR between 2025 and 2035.

What are the key product types in the mobile application testing solution market?

The key product types in mobile application testing solution market are services, _mobile app testing services, _consulting services, _support & maintenance, testing tools, _manual testing tool and _automated testing tool.

Which testing type segment to contribute significant share in the mobile application testing solution market in 2025?

In terms of testing type, automated testing segment to command 63.7% share in the mobile application testing solution market in 2025.

Table of Content

  1. Executive Summary
    • Global Market Outlook
    • Demand-side Trends
    • Supply-side Trends
    • Technology Roadmap Analysis
    • Analysis and Recommendations
  2. Market Overview
    • Market Coverage / Taxonomy
    • Market Definition / Scope / Limitations
  3. Market Background
    • Market Dynamics
      • Drivers
      • Restraints
      • Opportunity
      • Trends
    • Scenario Forecast
      • Demand in Optimistic Scenario
      • Demand in Likely Scenario
      • Demand in Conservative Scenario
    • Opportunity Map Analysis
    • Product Life Cycle Analysis
    • Supply Chain Analysis
    • Investment Feasibility Matrix
    • Value Chain Analysis
    • PESTLE and Porter’s Analysis
    • Regulatory Landscape
    • Regional Parent Market Outlook
    • Production and Consumption Statistics
    • Import and Export Statistics
  4. Global Market Analysis 2020-2024 and Forecast, 2025-2035
    • Historical Market Size Value (USD Mn) Analysis, 2020-2024
    • Current and Future Market Size Value (USD Mn) Projections, 2025-2035
      • Y-o-Y Growth Trend Analysis
      • Absolute $ Opportunity Analysis
  5. Global Market Pricing Analysis 2020-2024 and Forecast 2025-2035
  6. Global Market Analysis 2020-2024 and Forecast 2025-2035, By Solution
    • Introduction / Key Findings
    • Historical Market Size Value (USD Mn) Analysis By Solution , 2020-2024
    • Current and Future Market Size Value (USD Mn) Analysis and Forecast By Solution , 2025-2035
      • Services
        • Mobile App Testing Services
        • Consulting Services
        • Support & Maintenance
      • Testing Tools
        • Manual Testing Tool
        • Automated Testing Tool
    • Y-o-Y Growth Trend Analysis By Solution , 2020-2024
    • Absolute $ Opportunity Analysis By Solution , 2025-2035
  7. Global Market Analysis 2020-2024 and Forecast 2025-2035, By Testing Type
    • Introduction / Key Findings
    • Historical Market Size Value (USD Mn) Analysis By Testing Type, 2020-2024
    • Current and Future Market Size Value (USD Mn) Analysis and Forecast By Testing Type, 2025-2035
      • Automated Testing
      • Interactive Testing
    • Y-o-Y Growth Trend Analysis By Testing Type, 2020-2024
    • Absolute $ Opportunity Analysis By Testing Type, 2025-2035
  8. Global Market Analysis 2020-2024 and Forecast 2025-2035, By Platform
    • Introduction / Key Findings
    • Historical Market Size Value (USD Mn) Analysis By Platform, 2020-2024
    • Current and Future Market Size Value (USD Mn) Analysis and Forecast By Platform, 2025-2035
      • Android
      • iOS
      • Windows
      • Other Platforms
    • Y-o-Y Growth Trend Analysis By Platform, 2020-2024
    • Absolute $ Opportunity Analysis By Platform, 2025-2035
  9. Global Market Analysis 2020-2024 and Forecast 2025-2035, By Device
    • Introduction / Key Findings
    • Historical Market Size Value (USD Mn) Analysis By Device, 2020-2024
    • Current and Future Market Size Value (USD Mn) Analysis and Forecast By Device, 2025-2035
      • Smartphone
      • Tablet
    • Y-o-Y Growth Trend Analysis By Device, 2020-2024
    • Absolute $ Opportunity Analysis By Device, 2025-2035
  10. Global Market Analysis 2020-2024 and Forecast 2025-2035, By End User
    • Introduction / Key Findings
    • Historical Market Size Value (USD Mn) Analysis By End User, 2020-2024
    • Current and Future Market Size Value (USD Mn) Analysis and Forecast By End User, 2025-2035
      • Corporate
        • Small Enterprises (Less than 1,000 Employees)
        • Medium Enterprises (1,000 to 5,000 Employees)
        • Large Enterprises (1,000 to 5,000 Employees)
      • Residential
    • Y-o-Y Growth Trend Analysis By End User, 2020-2024
    • Absolute $ Opportunity Analysis By End User, 2025-2035
  11. Global Market Analysis 2020-2024 and Forecast 2025-2035, By Region
    • Introduction
    • Historical Market Size Value (USD Mn) Analysis By Region, 2020-2024
    • Current Market Size Value (USD Mn) Analysis and Forecast By Region, 2025-2035
      • North America
      • Latin America
      • Western Europe
      • Eastern Europe
      • East Asia
      • South Asia and Pacific
      • Middle East & Africa
    • Market Attractiveness Analysis By Region
  12. North America Market Analysis 2020-2024 and Forecast 2025-2035, By Country
    • Historical Market Size Value (USD Mn) Trend Analysis By Market Taxonomy, 2020-2024
    • Market Size Value (USD Mn) Forecast By Market Taxonomy, 2025-2035
      • By Country
        • U.S.
        • Canada
        • Mexico
      • By Solution
      • By Testing Type
      • By Platform
      • By Device
      • By End User
    • Market Attractiveness Analysis
      • By Country
      • By Solution
      • By Testing Type
      • By Platform
      • By Device
      • By End User
    • Key Takeaways
  13. Latin America Market Analysis 2020-2024 and Forecast 2025-2035, By Country
    • Historical Market Size Value (USD Mn) Trend Analysis By Market Taxonomy, 2020-2024
    • Market Size Value (USD Mn) Forecast By Market Taxonomy, 2025-2035
      • By Country
        • Brazil
        • Chile
        • Rest of Latin America
      • By Solution
      • By Testing Type
      • By Platform
      • By Device
      • By End User
    • Market Attractiveness Analysis
      • By Country
      • By Solution
      • By Testing Type
      • By Platform
      • By Device
      • By End User
    • Key Takeaways
  14. Western Europe Market Analysis 2020-2024 and Forecast 2025-2035, By Country
    • Historical Market Size Value (USD Mn) Trend Analysis By Market Taxonomy, 2020-2024
    • Market Size Value (USD Mn) Forecast By Market Taxonomy, 2025-2035
      • By Country
        • Germany
        • U.K.
        • Italy
        • Spain
        • France
        • Nordic
        • BENELUX
        • Rest of Western Europe
      • By Solution
      • By Testing Type
      • By Platform
      • By Device
      • By End User
    • Market Attractiveness Analysis
      • By Country
      • By Solution
      • By Testing Type
      • By Platform
      • By Device
      • By End User
    • Key Takeaways
  15. Eastern Europe Market Analysis 2020-2024 and Forecast 2025-2035, By Country
    • Historical Market Size Value (USD Mn) Trend Analysis By Market Taxonomy, 2020-2024
    • Market Size Value (USD Mn) Forecast By Market Taxonomy, 2025-2035
      • By Country
        • Russia
        • Poland
        • Hungary
        • Balkan & Baltic
        • Rest of Eastern Europe
      • By Solution
      • By Testing Type
      • By Platform
      • By Device
      • By End User
    • Market Attractiveness Analysis
      • By Country
      • By Solution
      • By Testing Type
      • By Platform
      • By Device
      • By End User
    • Key Takeaways
  16. East Asia Market Analysis 2020-2024 and Forecast 2025-2035, By Country
    • Historical Market Size Value (USD Mn) Trend Analysis By Market Taxonomy, 2020-2024
    • Market Size Value (USD Mn) Forecast By Market Taxonomy, 2025-2035
      • By Country
        • China
        • Japan
        • South Korea
      • By Solution
      • By Testing Type
      • By Platform
      • By Device
      • By End User
    • Market Attractiveness Analysis
      • By Country
      • By Solution
      • By Testing Type
      • By Platform
      • By Device
      • By End User
    • Key Takeaways
  17. South Asia and Pacific Market Analysis 2020-2024 and Forecast 2025-2035, By Country
    • Historical Market Size Value (USD Mn) Trend Analysis By Market Taxonomy, 2020-2024
    • Market Size Value (USD Mn) Forecast By Market Taxonomy, 2025-2035
      • By Country
        • India
        • ASEAN
        • Australia & New Zealand
        • Rest of South Asia and Pacific
      • By Solution
      • By Testing Type
      • By Platform
      • By Device
      • By End User
    • Market Attractiveness Analysis
      • By Country
      • By Solution
      • By Testing Type
      • By Platform
      • By Device
      • By End User
    • Key Takeaways
  18. Middle East & Africa Market Analysis 2020-2024 and Forecast 2025-2035, By Country
    • Historical Market Size Value (USD Mn) Trend Analysis By Market Taxonomy, 2020-2024
    • Market Size Value (USD Mn) Forecast By Market Taxonomy, 2025-2035
      • By Country
        • Kingdom of Saudi Arabia
        • Other GCC Countries
        • Turkiye
        • South Africa
        • Other African Union
        • Rest of Middle East & Africa
      • By Solution
      • By Testing Type
      • By Platform
      • By Device
      • By End User
    • Market Attractiveness Analysis
      • By Country
      • By Solution
      • By Testing Type
      • By Platform
      • By Device
      • By End User
    • Key Takeaways
  19. Key Countries Market Analysis
    • U.S.
      • Pricing Analysis
      • Market Share Analysis, 2024
        • By Solution
        • By Testing Type
        • By Platform
        • By Device
        • By End User
    • Canada
      • Pricing Analysis
      • Market Share Analysis, 2024
        • By Solution
        • By Testing Type
        • By Platform
        • By Device
        • By End User
    • Mexico
      • Pricing Analysis
      • Market Share Analysis, 2024
        • By Solution
        • By Testing Type
        • By Platform
        • By Device
        • By End User
    • Brazil
      • Pricing Analysis
      • Market Share Analysis, 2024
        • By Solution
        • By Testing Type
        • By Platform
        • By Device
        • By End User
    • Chile
      • Pricing Analysis
      • Market Share Analysis, 2024
        • By Solution
        • By Testing Type
        • By Platform
        • By Device
        • By End User
    • Germany
      • Pricing Analysis
      • Market Share Analysis, 2024
        • By Solution
        • By Testing Type
        • By Platform
        • By Device
        • By End User
    • U.K.
      • Pricing Analysis
      • Market Share Analysis, 2024
        • By Solution
        • By Testing Type
        • By Platform
        • By Device
        • By End User
    • Italy
      • Pricing Analysis
      • Market Share Analysis, 2024
        • By Solution
        • By Testing Type
        • By Platform
        • By Device
        • By End User
    • Spain
      • Pricing Analysis
      • Market Share Analysis, 2024
        • By Solution
        • By Testing Type
        • By Platform
        • By Device
        • By End User
    • France
      • Pricing Analysis
      • Market Share Analysis, 2024
        • By Solution
        • By Testing Type
        • By Platform
        • By Device
        • By End User
    • India
      • Pricing Analysis
      • Market Share Analysis, 2024
        • By Solution
        • By Testing Type
        • By Platform
        • By Device
        • By End User
    • ASEAN
      • Pricing Analysis
      • Market Share Analysis, 2024
        • By Solution
        • By Testing Type
        • By Platform
        • By Device
        • By End User
    • Australia & New Zealand
      • Pricing Analysis
      • Market Share Analysis, 2024
        • By Solution
        • By Testing Type
        • By Platform
        • By Device
        • By End User
    • China
      • Pricing Analysis
      • Market Share Analysis, 2024
        • By Solution
        • By Testing Type
        • By Platform
        • By Device
        • By End User
    • Japan
      • Pricing Analysis
      • Market Share Analysis, 2024
        • By Solution
        • By Testing Type
        • By Platform
        • By Device
        • By End User
    • South Korea
      • Pricing Analysis
      • Market Share Analysis, 2024
        • By Solution
        • By Testing Type
        • By Platform
        • By Device
        • By End User
    • Russia
      • Pricing Analysis
      • Market Share Analysis, 2024
        • By Solution
        • By Testing Type
        • By Platform
        • By Device
        • By End User
    • Poland
      • Pricing Analysis
      • Market Share Analysis, 2024
        • By Solution
        • By Testing Type
        • By Platform
        • By Device
        • By End User
    • Hungary
      • Pricing Analysis
      • Market Share Analysis, 2024
        • By Solution
        • By Testing Type
        • By Platform
        • By Device
        • By End User
    • Kingdom of Saudi Arabia
      • Pricing Analysis
      • Market Share Analysis, 2024
        • By Solution
        • By Testing Type
        • By Platform
        • By Device
        • By End User
    • Turkiye
      • Pricing Analysis
      • Market Share Analysis, 2024
        • By Solution
        • By Testing Type
        • By Platform
        • By Device
        • By End User
    • South Africa
      • Pricing Analysis
      • Market Share Analysis, 2024
        • By Solution
        • By Testing Type
        • By Platform
        • By Device
        • By End User
  20. Market Structure Analysis
    • Competition Dashboard
    • Competition Benchmarking
    • Market Share Analysis of Top Players
      • By Regional
      • By Solution
      • By Testing Type
      • By Platform
      • By Device
      • By End User
  21. Competition Analysis
    • Competition Deep Dive
      • IBM Corporation
        • Overview
        • Product Portfolio
        • Profitability by Market Segments (Product/Age /Sales Channel/Region)
        • Sales Footprint
        • Strategy Overview
          • Marketing Strategy
          • Product Strategy
          • Channel Strategy
      • Oracle Corporation
      • Hewlett Packard Enterprise
      • Microsoft Corporation
      • Cognizant Technology Solution Corp.
      • SAP SE
      • Wipro Limited
      • CA Technologies
      • Symantec Corporation
      • Capgemini
  22. Assumptions & Acronyms Used
  23. Research Methodology

List of Tables

  • Table 1: Global Market Value (USD Million) Forecast by Region, 2020-2035
  • Table 2: Global Market Value (USD Million) Forecast by Solution , 2020-2035
  • Table 3: Global Market Value (USD Million) Forecast by Testing Type, 2020-2035
  • Table 4: Global Market Value (USD Million) Forecast by Platform, 2020-2035
  • Table 5: Global Market Value (USD Million) Forecast by Device, 2020-2035
  • Table 6: Global Market Value (USD Million) Forecast by End User, 2020-2035
  • Table 7: North America Market Value (USD Million) Forecast by Country, 2020-2035
  • Table 8: North America Market Value (USD Million) Forecast by Solution , 2020-2035
  • Table 9: North America Market Value (USD Million) Forecast by Testing Type, 2020-2035
  • Table 10: North America Market Value (USD Million) Forecast by Platform, 2020-2035
  • Table 11: North America Market Value (USD Million) Forecast by Device, 2020-2035
  • Table 12: North America Market Value (USD Million) Forecast by End User, 2020-2035
  • Table 13: Latin America Market Value (USD Million) Forecast by Country, 2020-2035
  • Table 14: Latin America Market Value (USD Million) Forecast by Solution , 2020-2035
  • Table 15: Latin America Market Value (USD Million) Forecast by Testing Type, 2020-2035
  • Table 16: Latin America Market Value (USD Million) Forecast by Platform, 2020-2035
  • Table 17: Latin America Market Value (USD Million) Forecast by Device, 2020-2035
  • Table 18: Latin America Market Value (USD Million) Forecast by End User, 2020-2035
  • Table 19: Western Europe Market Value (USD Million) Forecast by Country, 2020-2035
  • Table 20: Western Europe Market Value (USD Million) Forecast by Solution , 2020-2035
  • Table 21: Western Europe Market Value (USD Million) Forecast by Testing Type, 2020-2035
  • Table 22: Western Europe Market Value (USD Million) Forecast by Platform, 2020-2035
  • Table 23: Western Europe Market Value (USD Million) Forecast by Device, 2020-2035
  • Table 24: Western Europe Market Value (USD Million) Forecast by End User, 2020-2035
  • Table 25: Eastern Europe Market Value (USD Million) Forecast by Country, 2020-2035
  • Table 26: Eastern Europe Market Value (USD Million) Forecast by Solution , 2020-2035
  • Table 27: Eastern Europe Market Value (USD Million) Forecast by Testing Type, 2020-2035
  • Table 28: Eastern Europe Market Value (USD Million) Forecast by Platform, 2020-2035
  • Table 29: Eastern Europe Market Value (USD Million) Forecast by Device, 2020-2035
  • Table 30: Eastern Europe Market Value (USD Million) Forecast by End User, 2020-2035
  • Table 31: East Asia Market Value (USD Million) Forecast by Country, 2020-2035
  • Table 32: East Asia Market Value (USD Million) Forecast by Solution , 2020-2035
  • Table 33: East Asia Market Value (USD Million) Forecast by Testing Type, 2020-2035
  • Table 34: East Asia Market Value (USD Million) Forecast by Platform, 2020-2035
  • Table 35: East Asia Market Value (USD Million) Forecast by Device, 2020-2035
  • Table 36: East Asia Market Value (USD Million) Forecast by End User, 2020-2035
  • Table 37: South Asia and Pacific Market Value (USD Million) Forecast by Country, 2020-2035
  • Table 38: South Asia and Pacific Market Value (USD Million) Forecast by Solution , 2020-2035
  • Table 39: South Asia and Pacific Market Value (USD Million) Forecast by Testing Type, 2020-2035
  • Table 40: South Asia and Pacific Market Value (USD Million) Forecast by Platform, 2020-2035
  • Table 41: South Asia and Pacific Market Value (USD Million) Forecast by Device, 2020-2035
  • Table 42: South Asia and Pacific Market Value (USD Million) Forecast by End User, 2020-2035
  • Table 43: Middle East & Africa Market Value (USD Million) Forecast by Country, 2020-2035
  • Table 44: Middle East & Africa Market Value (USD Million) Forecast by Solution , 2020-2035
  • Table 45: Middle East & Africa Market Value (USD Million) Forecast by Testing Type, 2020-2035
  • Table 46: Middle East & Africa Market Value (USD Million) Forecast by Platform, 2020-2035
  • Table 47: Middle East & Africa Market Value (USD Million) Forecast by Device, 2020-2035
  • Table 48: Middle East & Africa Market Value (USD Million) Forecast by End User, 2020-2035

List of Figures

  • Figure 1: Global Market Pricing Analysis
  • Figure 2: Global Market Value (USD Million) Forecast 2020–2035
  • Figure 3: Global Market Value Share and BPS Analysis by Solution , 2025 and 2035
  • Figure 4: Global Market Y-o-Y Growth Comparison by Solution , 2025–2035
  • Figure 5: Global Market Attractiveness Analysis by Solution
  • Figure 6: Global Market Value Share and BPS Analysis by Testing Type, 2025 and 2035
  • Figure 7: Global Market Y-o-Y Growth Comparison by Testing Type, 2025–2035
  • Figure 8: Global Market Attractiveness Analysis by Testing Type
  • Figure 9: Global Market Value Share and BPS Analysis by Platform, 2025 and 2035
  • Figure 10: Global Market Y-o-Y Growth Comparison by Platform, 2025–2035
  • Figure 11: Global Market Attractiveness Analysis by Platform
  • Figure 12: Global Market Value Share and BPS Analysis by Device, 2025 and 2035
  • Figure 13: Global Market Y-o-Y Growth Comparison by Device, 2025–2035
  • Figure 14: Global Market Attractiveness Analysis by Device
  • Figure 15: Global Market Value Share and BPS Analysis by End User, 2025 and 2035
  • Figure 16: Global Market Y-o-Y Growth Comparison by End User, 2025–2035
  • Figure 17: Global Market Attractiveness Analysis by End User
  • Figure 18: Global Market Value (USD Million) Share and BPS Analysis by Region, 2025 and 2035
  • Figure 19: Global Market Y-o-Y Growth Comparison by Region, 2025–2035
  • Figure 20: Global Market Attractiveness Analysis by Region
  • Figure 21: North America Market Incremental Dollar Opportunity, 2025–2035
  • Figure 22: Latin America Market Incremental Dollar Opportunity, 2025–2035
  • Figure 23: Western Europe Market Incremental Dollar Opportunity, 2025–2035
  • Figure 24: Eastern Europe Market Incremental Dollar Opportunity, 2025–2035
  • Figure 25: East Asia Market Incremental Dollar Opportunity, 2025–2035
  • Figure 26: South Asia and Pacific Market Incremental Dollar Opportunity, 2025–2035
  • Figure 27: Middle East & Africa Market Incremental Dollar Opportunity, 2025–2035
  • Figure 28: North America Market Value Share and BPS Analysis by Country, 2025 and 2035
  • Figure 29: North America Market Value Share and BPS Analysis by Solution , 2025 and 2035
  • Figure 30: North America Market Y-o-Y Growth Comparison by Solution , 2025–2035
  • Figure 31: North America Market Attractiveness Analysis by Solution
  • Figure 32: North America Market Value Share and BPS Analysis by Testing Type, 2025 and 2035
  • Figure 33: North America Market Y-o-Y Growth Comparison by Testing Type, 2025–2035
  • Figure 34: North America Market Attractiveness Analysis by Testing Type
  • Figure 35: North America Market Value Share and BPS Analysis by Platform, 2025 and 2035
  • Figure 36: North America Market Y-o-Y Growth Comparison by Platform, 2025–2035
  • Figure 37: North America Market Attractiveness Analysis by Platform
  • Figure 38: North America Market Value Share and BPS Analysis by Device, 2025 and 2035
  • Figure 39: North America Market Y-o-Y Growth Comparison by Device, 2025–2035
  • Figure 40: North America Market Attractiveness Analysis by Device
  • Figure 41: North America Market Value Share and BPS Analysis by End User, 2025 and 2035
  • Figure 42: North America Market Y-o-Y Growth Comparison by End User, 2025–2035
  • Figure 43: North America Market Attractiveness Analysis by End User
  • Figure 44: Latin America Market Value Share and BPS Analysis by Country, 2025 and 2035
  • Figure 45: Latin America Market Value Share and BPS Analysis by Solution , 2025 and 2035
  • Figure 46: Latin America Market Y-o-Y Growth Comparison by Solution , 2025–2035
  • Figure 47: Latin America Market Attractiveness Analysis by Solution
  • Figure 48: Latin America Market Value Share and BPS Analysis by Testing Type, 2025 and 2035
  • Figure 49: Latin America Market Y-o-Y Growth Comparison by Testing Type, 2025–2035
  • Figure 50: Latin America Market Attractiveness Analysis by Testing Type
  • Figure 51: Latin America Market Value Share and BPS Analysis by Platform, 2025 and 2035
  • Figure 52: Latin America Market Y-o-Y Growth Comparison by Platform, 2025–2035
  • Figure 53: Latin America Market Attractiveness Analysis by Platform
  • Figure 54: Latin America Market Value Share and BPS Analysis by Device, 2025 and 2035
  • Figure 55: Latin America Market Y-o-Y Growth Comparison by Device, 2025–2035
  • Figure 56: Latin America Market Attractiveness Analysis by Device
  • Figure 57: Latin America Market Value Share and BPS Analysis by End User, 2025 and 2035
  • Figure 58: Latin America Market Y-o-Y Growth Comparison by End User, 2025–2035
  • Figure 59: Latin America Market Attractiveness Analysis by End User
  • Figure 60: Western Europe Market Value Share and BPS Analysis by Country, 2025 and 2035
  • Figure 61: Western Europe Market Value Share and BPS Analysis by Solution , 2025 and 2035
  • Figure 62: Western Europe Market Y-o-Y Growth Comparison by Solution , 2025–2035
  • Figure 63: Western Europe Market Attractiveness Analysis by Solution
  • Figure 64: Western Europe Market Value Share and BPS Analysis by Testing Type, 2025 and 2035
  • Figure 65: Western Europe Market Y-o-Y Growth Comparison by Testing Type, 2025–2035
  • Figure 66: Western Europe Market Attractiveness Analysis by Testing Type
  • Figure 67: Western Europe Market Value Share and BPS Analysis by Platform, 2025 and 2035
  • Figure 68: Western Europe Market Y-o-Y Growth Comparison by Platform, 2025–2035
  • Figure 69: Western Europe Market Attractiveness Analysis by Platform
  • Figure 70: Western Europe Market Value Share and BPS Analysis by Device, 2025 and 2035
  • Figure 71: Western Europe Market Y-o-Y Growth Comparison by Device, 2025–2035
  • Figure 72: Western Europe Market Attractiveness Analysis by Device
  • Figure 73: Western Europe Market Value Share and BPS Analysis by End User, 2025 and 2035
  • Figure 74: Western Europe Market Y-o-Y Growth Comparison by End User, 2025–2035
  • Figure 75: Western Europe Market Attractiveness Analysis by End User
  • Figure 76: Eastern Europe Market Value Share and BPS Analysis by Country, 2025 and 2035
  • Figure 77: Eastern Europe Market Value Share and BPS Analysis by Solution , 2025 and 2035
  • Figure 78: Eastern Europe Market Y-o-Y Growth Comparison by Solution , 2025–2035
  • Figure 79: Eastern Europe Market Attractiveness Analysis by Solution
  • Figure 80: Eastern Europe Market Value Share and BPS Analysis by Testing Type, 2025 and 2035
  • Figure 81: Eastern Europe Market Y-o-Y Growth Comparison by Testing Type, 2025–2035
  • Figure 82: Eastern Europe Market Attractiveness Analysis by Testing Type
  • Figure 83: Eastern Europe Market Value Share and BPS Analysis by Platform, 2025 and 2035
  • Figure 84: Eastern Europe Market Y-o-Y Growth Comparison by Platform, 2025–2035
  • Figure 85: Eastern Europe Market Attractiveness Analysis by Platform
  • Figure 86: Eastern Europe Market Value Share and BPS Analysis by Device, 2025 and 2035
  • Figure 87: Eastern Europe Market Y-o-Y Growth Comparison by Device, 2025–2035
  • Figure 88: Eastern Europe Market Attractiveness Analysis by Device
  • Figure 89: Eastern Europe Market Value Share and BPS Analysis by End User, 2025 and 2035
  • Figure 90: Eastern Europe Market Y-o-Y Growth Comparison by End User, 2025–2035
  • Figure 91: Eastern Europe Market Attractiveness Analysis by End User
  • Figure 92: East Asia Market Value Share and BPS Analysis by Country, 2025 and 2035
  • Figure 93: East Asia Market Value Share and BPS Analysis by Solution , 2025 and 2035
  • Figure 94: East Asia Market Y-o-Y Growth Comparison by Solution , 2025–2035
  • Figure 95: East Asia Market Attractiveness Analysis by Solution
  • Figure 96: East Asia Market Value Share and BPS Analysis by Testing Type, 2025 and 2035
  • Figure 97: East Asia Market Y-o-Y Growth Comparison by Testing Type, 2025–2035
  • Figure 98: East Asia Market Attractiveness Analysis by Testing Type
  • Figure 99: East Asia Market Value Share and BPS Analysis by Platform, 2025 and 2035
  • Figure 100: East Asia Market Y-o-Y Growth Comparison by Platform, 2025–2035
  • Figure 101: East Asia Market Attractiveness Analysis by Platform
  • Figure 102: East Asia Market Value Share and BPS Analysis by Device, 2025 and 2035
  • Figure 103: East Asia Market Y-o-Y Growth Comparison by Device, 2025–2035
  • Figure 104: East Asia Market Attractiveness Analysis by Device
  • Figure 105: East Asia Market Value Share and BPS Analysis by End User, 2025 and 2035
  • Figure 106: East Asia Market Y-o-Y Growth Comparison by End User, 2025–2035
  • Figure 107: East Asia Market Attractiveness Analysis by End User
  • Figure 108: South Asia and Pacific Market Value Share and BPS Analysis by Country, 2025 and 2035
  • Figure 109: South Asia and Pacific Market Value Share and BPS Analysis by Solution , 2025 and 2035
  • Figure 110: South Asia and Pacific Market Y-o-Y Growth Comparison by Solution , 2025–2035
  • Figure 111: South Asia and Pacific Market Attractiveness Analysis by Solution
  • Figure 112: South Asia and Pacific Market Value Share and BPS Analysis by Testing Type, 2025 and 2035
  • Figure 113: South Asia and Pacific Market Y-o-Y Growth Comparison by Testing Type, 2025–2035
  • Figure 114: South Asia and Pacific Market Attractiveness Analysis by Testing Type
  • Figure 115: South Asia and Pacific Market Value Share and BPS Analysis by Platform, 2025 and 2035
  • Figure 116: South Asia and Pacific Market Y-o-Y Growth Comparison by Platform, 2025–2035
  • Figure 117: South Asia and Pacific Market Attractiveness Analysis by Platform
  • Figure 118: South Asia and Pacific Market Value Share and BPS Analysis by Device, 2025 and 2035
  • Figure 119: South Asia and Pacific Market Y-o-Y Growth Comparison by Device, 2025–2035
  • Figure 120: South Asia and Pacific Market Attractiveness Analysis by Device
  • Figure 121: South Asia and Pacific Market Value Share and BPS Analysis by End User, 2025 and 2035
  • Figure 122: South Asia and Pacific Market Y-o-Y Growth Comparison by End User, 2025–2035
  • Figure 123: South Asia and Pacific Market Attractiveness Analysis by End User
  • Figure 124: Middle East & Africa Market Value Share and BPS Analysis by Country, 2025 and 2035
  • Figure 125: Middle East & Africa Market Value Share and BPS Analysis by Solution , 2025 and 2035
  • Figure 126: Middle East & Africa Market Y-o-Y Growth Comparison by Solution , 2025–2035
  • Figure 127: Middle East & Africa Market Attractiveness Analysis by Solution
  • Figure 128: Middle East & Africa Market Value Share and BPS Analysis by Testing Type, 2025 and 2035
  • Figure 129: Middle East & Africa Market Y-o-Y Growth Comparison by Testing Type, 2025–2035
  • Figure 130: Middle East & Africa Market Attractiveness Analysis by Testing Type
  • Figure 131: Middle East & Africa Market Value Share and BPS Analysis by Platform, 2025 and 2035
  • Figure 132: Middle East & Africa Market Y-o-Y Growth Comparison by Platform, 2025–2035
  • Figure 133: Middle East & Africa Market Attractiveness Analysis by Platform
  • Figure 134: Middle East & Africa Market Value Share and BPS Analysis by Device, 2025 and 2035
  • Figure 135: Middle East & Africa Market Y-o-Y Growth Comparison by Device, 2025–2035
  • Figure 136: Middle East & Africa Market Attractiveness Analysis by Device
  • Figure 137: Middle East & Africa Market Value Share and BPS Analysis by End User, 2025 and 2035
  • Figure 138: Middle East & Africa Market Y-o-Y Growth Comparison by End User, 2025–2035
  • Figure 139: Middle East & Africa Market Attractiveness Analysis by End User
  • Figure 140: Global Market – Tier Structure Analysis
  • Figure 141: Global Market – Company Share Analysis
Dashboard
Dashboard
Dashboard
Dashboard
Dashboard
Dashboard

Full Research Suite comprises of:

Market outlook & trends analysis

Market outlook & trends analysis

Interviews & case studies

Interviews & case studies

Strategic recommendations

Strategic recommendations

Vendor profiles & capabilities analysis

Vendor profiles & capabilities analysis

5-year forecasts

5-year forecasts

8 regions and 60+ country-level data splits

8 regions and 60+ country-level data splits

Market segment data splits

Market segment data splits

12 months of continuous data updates

12 months of continuous data updates

DELIVERED AS:

PDF EXCEL ONLINE

Full Research Suite


$5000

$7500

$10000

Buy Report Now
Similar Industry Reports

Similar Industry Reports

Mobile Cardiac Telemetry System Market

Mobile Cardiac Telemetry System Market Size and Share Forecast Outlook 2025 to 2035

Mobile Robots Market

Mobile Robots Market Size and Share Forecast Outlook 2025 to 2035

Mobile Crane Market
Mobile Crane Market

Mobile Crane Market Size and Share Forecast Outlook 2025 to 2035

Mobile Vascular Imaging Market

Mobile Vascular Imaging Market Size and Share Forecast Outlook 2025 to 2035

Mobile Animal Inhalation Anesthesia Machine Market

Mobile Animal Inhalation Anesthesia Machine Market Size and Share Forecast Outlook 2025 to 2035

Mobile Data Protection Market

Mobile Data Protection Market Size and Share Forecast Outlook 2025 to 2035

Mobile Medical Tablets Market

Mobile Medical Tablets Market Size and Share Forecast Outlook 2025 to 2035

Mobile WLAN Access Points Market

Mobile WLAN Access Points Market Size and Share Forecast Outlook 2025 to 2035

Mobile Social Networks Market

Mobile Social Networks Market Size and Share Forecast Outlook 2025 to 2035

Mobile Printer Market

Mobile Printer Market Size and Share Forecast Outlook 2025 to 2035

Mobile Threat Management Security Software Market

Mobile Threat Management Security Software Market Size and Share Forecast Outlook 2025 to 2035

Mobile Broadband Infrastructure Market

Mobile Broadband Infrastructure Market Size and Share Forecast Outlook 2025 to 2035

Mobile Analytics Market

Mobile Analytics Market Size and Share Forecast Outlook 2025 to 2035

Mobile Robotics Software Market

Mobile Robotics Software Market Size and Share Forecast Outlook 2025 to 2035

Mobile Notary Public Market

Mobile Notary Public Market Size and Share Forecast Outlook 2025 to 2035

Mobile Messaging Market

Mobile Messaging Market Size and Share Forecast Outlook 2025 to 2035

Mobile Clinic Market

Mobile Clinic Market Analysis - Size, Share, and Forecast Outlook 2025 to 2035

Mobile VoIP Market
Mobile VoIP Market

Mobile VoIP Market Size and Share Forecast Outlook 2025 to 2035

Mobile Laser Scanning Market

Mobile Laser Scanning Market Size and Share Forecast Outlook 2025 to 2035

Mobile Grooming Services Market

Mobile Grooming Services Market Size and Share Forecast Outlook 2025 to 2035

Future Market Insights

Mobile Application Testing Solution Market

Chat With MaRIA

Chat With

MaRIA

Hi There, I am MaRIA, Your Market Research Intelligence Assistant. How may I help you?