The Application Integration Market is estimated to be valued at USD 19.0 billion in 2025 and is projected to reach USD 120.7 billion by 2035, registering a compound annual growth rate (CAGR) of 19.9% over the forecast period.
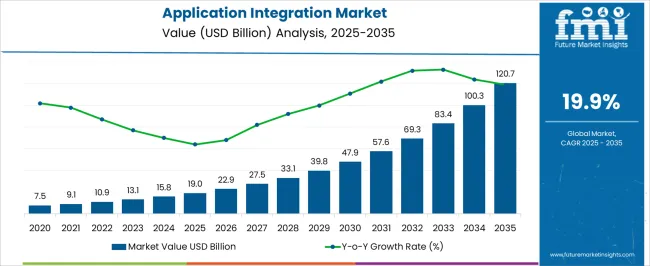
| Metric | Value |
|---|---|
| Application Integration Market Estimated Value in (2025 E) | USD 19.0 billion |
| Application Integration Market Forecast Value in (2035 F) | USD 120.7 billion |
| Forecast CAGR (2025 to 2035) | 19.9% |
The application integration market is expanding at a significant pace, propelled by increasing enterprise reliance on interconnected applications, data-driven decision-making, and cloud adoption. Organizations are seeking seamless workflows across hybrid environments, fueling the demand for advanced integration solutions that improve agility and operational efficiency.
The current market reflects heightened investments in digital transformation initiatives, with platforms enabling end-to-end visibility, process automation, and secure data exchange. The proliferation of SaaS solutions, coupled with the complexity of legacy IT landscapes, has further accelerated adoption.
Vendors are focusing on enhancing real-time integration, scalability, and interoperability to meet evolving enterprise requirements. Looking ahead, growth will be underpinned by the rising importance of API management, microservices architectures, and AI-driven integration, ensuring robust long-term expansion of the market.
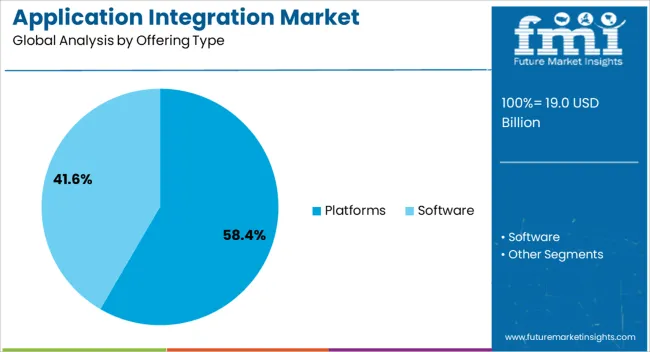
The platforms segment dominates the offering type category, accounting for approximately 58.4% share. This segment’s strength is rooted in its ability to provide enterprises with scalable, unified solutions for managing application connectivity across diverse IT infrastructures.
Platforms deliver a centralized approach to monitoring, orchestration, and automation, reducing operational silos and improving efficiency. Their adoption has been reinforced by enterprises prioritizing vendor-agnostic integration capabilities to manage hybrid and multi-cloud environments effectively.
Platforms are increasingly bundled with advanced security, analytics, and compliance features, enhancing their strategic value. With digital transformation driving enterprises toward more dynamic and interconnected IT ecosystems, the platforms segment is expected to retain its leadership position.
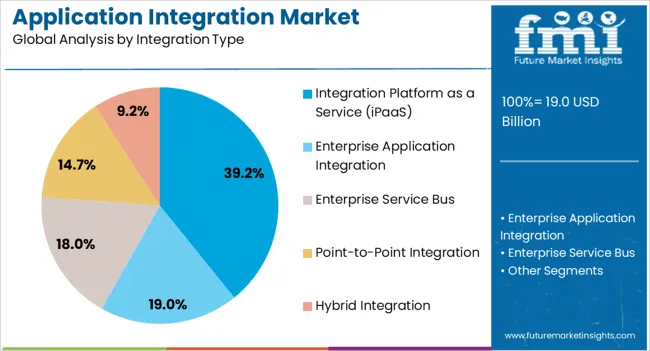
The integration platform as a service (iPaaS) segment holds approximately 39.2% share of the integration type category, reflecting its rising prominence as organizations adopt cloud-native integration frameworks. This segment is favored for its flexibility, cost-efficiency, and ability to support rapid deployment without significant infrastructure investments.
Enterprises benefit from iPaaS solutions’ prebuilt connectors and low-code capabilities, enabling faster integration of SaaS applications and legacy systems. The segment has gained traction in industries undergoing large-scale digital transformation, where agility and scalability are critical.
With the shift toward subscription-based IT models and the growing importance of seamless cloud integration, iPaaS adoption is projected to expand further, consolidating its role as a key enabler of application integration strategies.
The global application integration market was valued at USD 7.5 billion in 2020. In the following years, demand for application integration witnessed an unexpected upward turn due to the pandemic outbreak. The adoption of application integration services surged at 24.1% CAGR between 2020 and 2025. The overall market had reached a valuation of USD 19 billion in 2025.
Modern companies started looking for more ways to make money out of their digital data repository in the years 2024 and 2024. So many organizations and corporations partnered with data integration solution providers during this period. They were mostly preferring scalable integration solution providers who can complement their data monetization initiatives.
| Attributes | Details |
|---|---|
| Application Integration Market Value (2020) | USD 7.5 billion |
| Market Revenue (2025) | USD 19 billion |
| Market Historical Growth Rate(CAGR 2020 to 2025) | 24.1% CAGR |
The success of the integration platform as a service market depends on the industry type in need of application integration solutions. The creation of industry-specific integration solutions is expected to spur the demand. It mostly includes business application integration solutions that are suited to the requirements of diverse industries like healthcare, finance, or manufacturing.
A fair amount of enterprise application integration market players have shifted their attention to providing solutions for edge computing environments. On the other hand, cloud integration allows for a seamless merger of operations and workflows at the network's edge. So development of hybrid integration solutions to handle edge environments as well as cloud servers is forecasted to fuel the market growth.
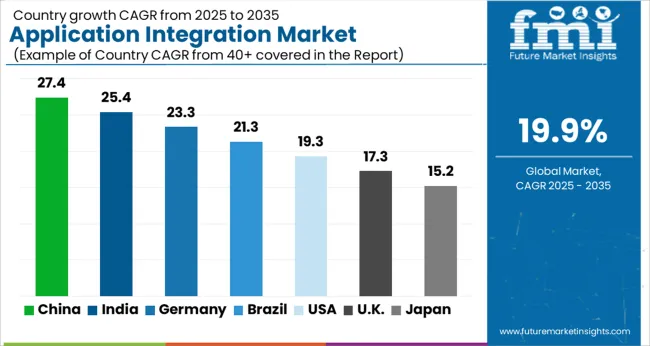
The table below lists the countries that are expected to witness higher growth trends in the advancement of their integration software market till 2035.
The United States application integration market is likely to witness a CAGR of 20.4% from 2025 to 2035. This regional market value is expected to reach USD 17.8 billion by the end of this forecast period.
The demand for application integration solutions and services in the United Kingdom is likely to grow at a rate of 21.5% through 2035. By the end of this forecast period, the total value of this regional market is expected to reach USD 4 billion.
China holds a greater share of the Asia market and is likely to grow at a rate of 20.7% between 2025 and 2035. The overall market in China is likely to reach a valuation of USD 16.3 billion by the end of this forecast period.
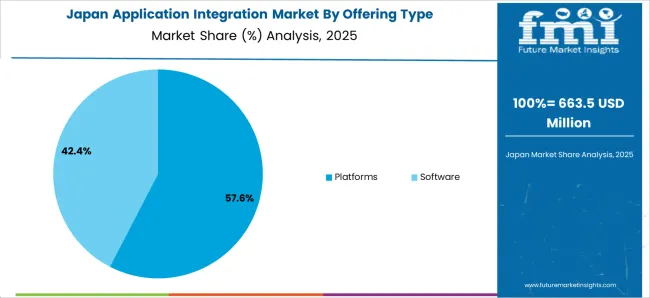
Japan follows China in the adoption of enterprise application integration solutions and is likely to expand at a rate of 21.2% through the projected years. The regional market value is further forecasted to reach USD 120.7 million by 2035.
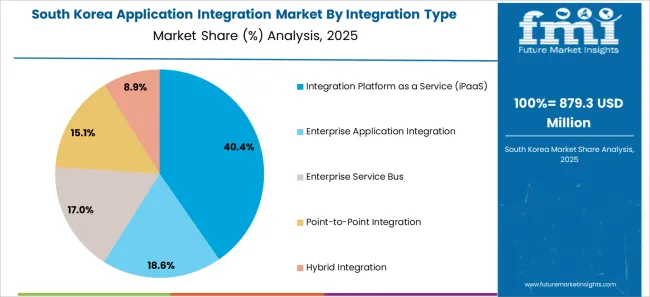
The regional market in South Korea is anticipated to witness a lucrative growth rate of 21.6% through the forecasted year. The South Korean enterprise application software industry value is expected to reach USD 6 billion by 2035 end.
Based on offering type, the application integration platforms market segment currently garners higher revenue than the software segment. This market segment is likely to expand at a rate of 20.1% over the next ten years.
| Attributes | Details |
|---|---|
| Top Offering Type or Segment | Platforms |
| Market Segment Growth Rate from 2025 to 2035 | 20.1% CAGR |
| Market Segment Growth Rate from 2020 to 2025 | 23.8% CAGR |
Based on integration type, the enterprise application integration market segment leads in 2025. The enterprise application integration market trends are expected to drive the segment at 19.8% CAGR through 2035.
| Attributes | Details |
|---|---|
| Top Integration Type or segment | Enterprise Application Integration |
| Market Segment Growth Rate from 2025 to 2035 | 19.8% CAGR |
| Market Segment Growth Rate from 2020 to 2025 | 23.6% CAGR |
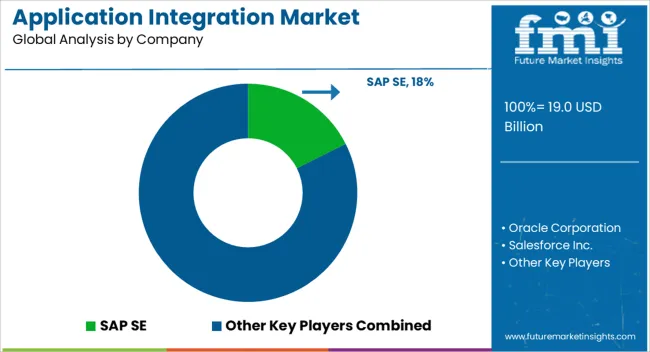
The market is highly consolidated as very few market players like Microsoft and IBM account for a greater market share. Cloud-friendly integration solution providers have gained a competitive edge in the present market by taking advantage of cloud computing capabilities.
Recent Developments in the Global Application Integration Market
| Attribute | Details |
|---|---|
| Estimated Market Size (2025) | USD 15.8 billion |
| Projected Market Size (2035) | USD 100 billion |
| Anticipated Growth Rate (2025 to 2035) | 20.3% |
| Forecast Period | 2025 to 2035 |
| Historical Data Available for | 2020 to 2025 |
| Market Analysis | USD million or billion for Value and Units for Volume |
| Key Regions Covered | North America, Latin America, Europe, Middle East & Africa (MEA), East Asia, South Asia and Oceania |
| Key Countries Covered | United States, Canada, Brazil, Mexico, Germany, Spain, Italy, France, United Kingdom, Russia, China, India, Australia & New Zealand, GCC Countries, and South Africa |
| Key Segments Covered | By Offering Type, By Integration Type, and By Region |
| Key Companies Profiled | SAP SE; Oracle Corporation; Salesforce Inc.; International Business Machines (IBM) Corp; Microsoft Corporation; Informatica Co. |
| Report Coverage | Market Forecast, Company Share Analysis, Competition Intelligence, DROT Analysis, Market Dynamics and Challenges, and Strategic Growth Initiatives |
| Customization & Pricing | Available upon Request |
The global application integration market is estimated to be valued at USD 19.0 billion in 2025.
The market size for the application integration market is projected to reach USD 120.7 billion by 2035.
The application integration market is expected to grow at a 19.9% CAGR between 2025 and 2035.
The key product types in application integration market are platforms and software.
In terms of integration type, integration platform as a service (ipaas) segment to command 39.2% share in the application integration market in 2025.


Our Research Products

The "Full Research Suite" delivers actionable market intel, deep dives on markets or technologies, so clients act faster, cut risk, and unlock growth.

The Leaderboard benchmarks and ranks top vendors, classifying them as Established Leaders, Leading Challengers, or Disruptors & Challengers.

Locates where complements amplify value and substitutes erode it, forecasting net impact by horizon

We deliver granular, decision-grade intel: market sizing, 5-year forecasts, pricing, adoption, usage, revenue, and operational KPIs—plus competitor tracking, regulation, and value chains—across 60 countries broadly.

Spot the shifts before they hit your P&L. We track inflection points, adoption curves, pricing moves, and ecosystem plays to show where demand is heading, why it is changing, and what to do next across high-growth markets and disruptive tech

Real-time reads of user behavior. We track shifting priorities, perceptions of today’s and next-gen services, and provider experience, then pace how fast tech moves from trial to adoption, blending buyer, consumer, and channel inputs with social signals (#WhySwitch, #UX).

Partner with our analyst team to build a custom report designed around your business priorities. From analysing market trends to assessing competitors or crafting bespoke datasets, we tailor insights to your needs.
Supplier Intelligence
Discovery & Profiling
Capacity & Footprint
Performance & Risk
Compliance & Governance
Commercial Readiness
Who Supplies Whom
Scorecards & Shortlists
Playbooks & Docs
Category Intelligence
Definition & Scope
Demand & Use Cases
Cost Drivers
Market Structure
Supply Chain Map
Trade & Policy
Operating Norms
Deliverables
Buyer Intelligence
Account Basics
Spend & Scope
Procurement Model
Vendor Requirements
Terms & Policies
Entry Strategy
Pain Points & Triggers
Outputs
Pricing Analysis
Benchmarks
Trends
Should-Cost
Indexation
Landed Cost
Commercial Terms
Deliverables
Brand Analysis
Positioning & Value Prop
Share & Presence
Customer Evidence
Go-to-Market
Digital & Reputation
Compliance & Trust
KPIs & Gaps
Outputs
Full Research Suite comprises of:
Market outlook & trends analysis
Interviews & case studies
Strategic recommendations
Vendor profiles & capabilities analysis
5-year forecasts
8 regions and 60+ country-level data splits
Market segment data splits
12 months of continuous data updates
DELIVERED AS:
PDF EXCEL ONLINE
Application Crowdtesting Service Market Size and Share Forecast Outlook 2025 to 2035
Application Programming Interface (API) Security Market Size and Share Forecast Outlook 2025 to 2035
Application Development and Modernization (ADM) Market Size and Share Forecast Outlook 2025 to 2035
Application Release Automation Market Size and Share Forecast Outlook 2025 to 2035
Application Delivery Controllers Market Size and Share Forecast Outlook 2025 to 2035
Application Virtualization Market Size and Share Forecast Outlook 2025 to 2035
Application Specific Integrated Circuit Market Size and Share Forecast Outlook 2025 to 2035
Application Processor Market Size and Share Forecast Outlook 2025 to 2035
Application Delivery Network Market by Product, End-user, Environment, Deployment Type, Vertical, and Region, Forecast through 2035
Application Control Software Market Insights – Growth & Forecast 2025-2035
Application Metrics and Monitoring Tools Market Analysis By Component, Mode, Deployment, Verticals, and Region through 2035
Application Centric Infrastructure Market
Application Management Services Market Analysis – Trends & Forecast 2017-2027
Disintegration Analyzers Market
IoT Application Enablement Market Size and Share Forecast Outlook 2025 to 2035
IoT Application Development Services Market Size and Share Forecast Outlook 2025 to 2035
MES Applications For Process Manufacturing Market Size and Share Forecast Outlook 2025 to 2035
CRM Application Software Market Report – Forecast 2017-2022
Data Integration Software/Tool Market
Agile Application Life-Cycle Management Market Size and Share Forecast Outlook 2025 to 2035

Thank you!
You will receive an email from our Business Development Manager. Please be sure to check your SPAM/JUNK folder too.
Chat With
MaRIA