Mobile Data Protection Market Size and Share Forecast Outlook 2025 to 2035

The Mobile Data Protection Market is estimated to be valued at USD 8.9 billion in 2025 and is projected to reach USD 105.5 billion by 2035, registering a compound annual growth rate (CAGR) of 28.0% over the forecast period.
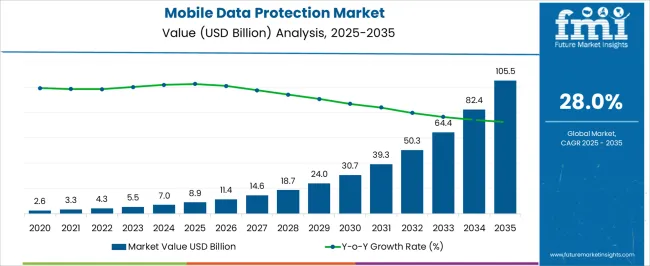
Quick Stats for Mobile Data Protection Market

  • Mobile Data Protection Market Value (2025): USD 8.9 billion
  • Mobile Data Protection Market Forecast Value (2035): USD 105.5 billion
  • Mobile Data Protection Market Forecast CAGR: 28.0%
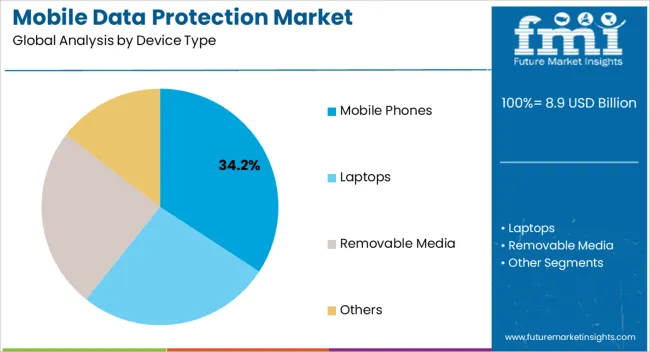
  • Leading Segment in Mobile Data Protection Market in 2025: Mobile Phones (34.2%)
  • Key Growth Regions in Mobile Data Protection Market: North America, Asia-Pacific, Europe
  • Top Key Players in Mobile Data Protection Market: Check Point Software Technologies Ltd., Ciphercloud, Inc., Cisco Systems, Inc., Dell EMC, Druva Inc., Gemalto NV, Hewlett Packard Enterprise Development LP (HPE), McAfee LLC, Microsoft Corporation, Sophos Ltd., Symantec Corporation, Trend Micro, Inc.
Mobile Data Protection Market Market Value Analysis

Mobile Data Protection Market Key Takeaways

Metric Value
Mobile Data Protection Market Estimated Value in (2025 E) USD 8.9 billion
Mobile Data Protection Market Forecast Value in (2035 F) USD 105.5 billion
Forecast CAGR (2025 to 2035) 28.0%

Why is the Mobile Data Protection Market Growing?

The mobile data protection market is witnessing accelerated growth, supported by the increasing reliance on mobile devices for business operations and personal communication. The rise in remote work adoption, cloud connectivity, and mobile-driven transactions has heightened the need for robust data protection solutions that ensure privacy, compliance, and secure access. Enterprises and individuals alike are prioritizing mobile data security as threats such as data breaches, phishing, and malware attacks continue to rise in frequency and sophistication.

Advancements in mobile device management, encryption technologies, and secure authentication frameworks are expanding the scope of protection. Regulatory frameworks across major regions are also influencing market demand, as organizations are required to safeguard sensitive information in compliance with data privacy standards.

Growing adoption of enterprise mobility strategies and the integration of bring-your-own-device policies are further reinforcing the importance of mobile data protection With the increasing penetration of smartphones and applications in both consumer and enterprise ecosystems, the market is anticipated to remain on a robust growth trajectory, offering significant opportunities for solution providers worldwide.

Segmental Analysis

The mobile data protection market is segmented by device type, operating system, user type, verticals, and geographic regions. By device type, mobile data protection market is divided into Mobile Phones, Laptops, Removable Media, and Others. In terms of operating system, mobile data protection market is classified into Android, Mac OS, Windows, Linux, and Others. Based on user type, mobile data protection market is segmented into SME and Large Enterprises. By verticals, mobile data protection market is segmented into IT And Telecommunication, Retail, Manufacturing, Bfsi, Healthcare, Consumer Goods, Media And Entertainment, Aerospace & Defence, and Others. Regionally, the mobile data protection industry is classified into North America, Latin America, Western Europe, Eastern Europe, Balkan & Baltic Countries, Russia & Belarus, Central Asia, East Asia, South Asia & Pacific, and the Middle East & Africa.
Insights into the Mobile Phones Device Type Segment

Mobile Data Protection Market Analysis By Device Type

The mobile phones segment is expected to hold 34.2% of the mobile data protection market revenue share in 2025, making it the leading device type. This leadership is being driven by the exponential growth in smartphone adoption, which has transformed the way individuals and organizations access, store, and share information. Mobile phones are increasingly being used as primary devices for business communications, banking transactions, and data-intensive applications, creating a higher risk profile that necessitates advanced security solutions.

The segment’s dominance is further supported by the rising prevalence of mobile-based workforces and the critical need to protect sensitive enterprise and personal data from cyberattacks. Technological advancements in mobile encryption, secure file sharing, and cloud-integrated protection systems are contributing to the segment’s expansion.

Additionally, the increasing sophistication of cyber threats targeting mobile platforms is prompting stronger investment in mobile device security solutions, ensuring the segment continues to lead The combination of convenience, ubiquity, and high vulnerability makes mobile phones the central focus of data protection strategies globally.
Insights into the Android Operating System Segment

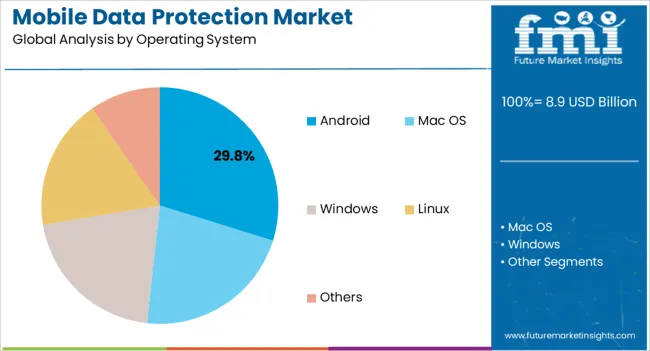
Mobile Data Protection Market Analysis By Operating System

The Android operating system segment is projected to account for 29.8% of the mobile data protection market revenue share in 2025, positioning it as the leading operating system segment. Its dominance is being explained by its widespread global adoption, particularly in emerging markets where cost-effective devices are driving mass penetration. The open-source nature of Android provides extensive flexibility for customization but also exposes users to heightened risks of malware, unauthorized access, and data leakage, thereby driving the need for advanced protection mechanisms.

Growing concerns around security patches and fragmented updates are further stimulating demand for mobile data protection solutions tailored for Android devices. Enterprises are increasingly prioritizing Android security due to the large number of employees using these devices in bring-your-own-device environments.

Continuous developments in threat detection, endpoint protection, and encryption frameworks designed for Android ecosystems are reinforcing adoption As the Android platform continues to dominate the global smartphone market, the demand for mobile data protection solutions within this operating system segment is expected to remain strong.
Insights into the SME User Type Segment

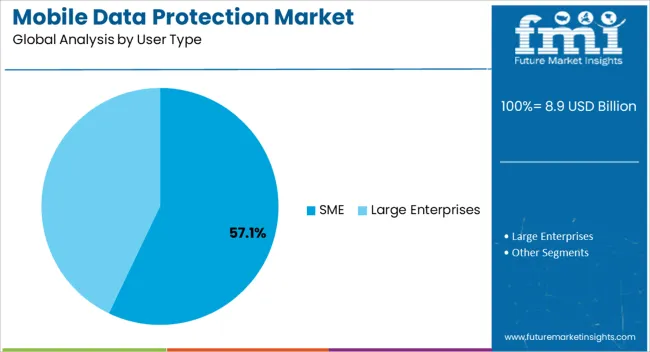
Mobile Data Protection Market Analysis By User Type

The SME segment is anticipated to capture 57.1% of the mobile data protection market revenue share in 2025, making it the largest user type segment. This dominance is being supported by the growing digital transformation of small and medium enterprises, which are increasingly adopting mobile platforms to enhance operational efficiency, customer engagement, and remote working capabilities. SMEs often operate with limited IT infrastructure and cybersecurity expertise, making them highly vulnerable to cyberattacks, data breaches, and financial losses.

As regulatory pressures tighten around data security and privacy, SMEs are recognizing the importance of investing in cost-effective mobile data protection solutions. Cloud-based and subscription-driven security platforms are being widely adopted within this segment due to their scalability, affordability, and ease of deployment.

The increasing frequency of ransomware and phishing attacks targeting smaller businesses is further accelerating demand As SMEs continue to expand their digital footprints, their prioritization of mobile data protection is expected to remain a critical driver of overall market growth, solidifying the segment’s leadership position.

Market Overview

Mobile Data Protection Market Overview

Key firms bring technology to other businesses, customers, and society in a way that allows for extraordinary experiences while not compromising privacy. They believe in privacy-protecting innovation and performance, as well as technologies created with those rights in mind. This 'Privacy Notice' explains how they can utilize personal information while respecting privacy rights. They offer something known as a 'Privacy Notice, in particular, which details how their goods, services, and technology use a customer's personal information. These factors are estimated to surge the adoption of mobile data protection.

Unless a second or additional privacy notice is provided, it applies to their use of personal information throughout their websites, goods, online services, software, applications, tools, and other services and capabilities they provide, both online and offline. Key firms fundamentally gather information as part of their company activities, such as providing services, responding to requests and providing customer assistance, fulfilling legal and contractual duties, and developing innovative goods, which contribute to the mobile data protection market growth.

Some of this information is provided directly by consumers, such as when they purchase a product, contact customer service, or register for an event or publication. These firms also gather information from end users through their interactions with their services and websites, such as through the use of embedded product technology and cookies. Moreover, they also get information from third sources. Virtualization technology can help consumers safeguard endpoint programs and data while maintaining a positive user experience.

Hardware-based security features provide the performance needed to help safeguard apps and data while minimizing user impact. Payment Card Industry (PCI) security requirements are increasingly being met by retailers and other businesses that accept or process credit cards. These standards compel enterprises to improve their networks, safeguard stored customer data, and encrypt data in transmission over public networks, which is likely to assist in the expansion of mobile data protection growth.

Key companies help consumers reduce their risk of data breaches and examine their security posture and setups. It finds shared storage and database resources automatically. Furthermore, by detecting shadow IT on the cloud, their data is kept in SaaS apps. Furthermore, the adoption of mobile data protection may increase amongst stores that accept credit cards and maintain tight access controls, test and monitor access on a regular basis, and have an information security policy in place for workers and contractors.

Consumers may also receive notifications about unwanted and unlawful conduct, as well as capabilities to regulate it all through the Firewall. To keep businesses safe, the Firewall employs cutting-edge next-generation protection technologies such as deep learning and intrusion prevention. The demand for mobile data protection is expected to boost since certain market players are offering a secure Unified Endpoint Management (UEM) solution that allows enterprises to spend less time and effort managing and securing traditional and mobile endpoints.

The General Data Protection Regulation (GDPR) allows people in Europe more control over their personal data while also ensuring improved data security. However, enterprises throughout Europe are walking a tightrope when it comes to data storage and privacy, and they are hurrying to adopt data security protections across their infrastructure. By keeping their data and devices safe, key players may aid end-user efforts to comply with the GDPR and reduce the risk of fines. All these factors are anticipated to expand the global mobile data protection market size.

Protection of data from theft, loss, or misuse has become crucial practice in every enterprise, as breach of data can hamper brand image and result into severe losses. In the recent past, introduction of mobility has altered the operations within an organization globally. However, in spite of the fact that use of mobile or portable devices have brought in remarkable flexibility, it is also associated with potential data security risks.

Mobile data protection is the technology that protects enterprise as well as personal data from cyber-attacks, and other such activities. It inhibits unlicensed access, as well as offers advanced device protection from malware and provides firewalls, anti-virus solutions to the organizations. Mobile data protection facilitates enhanced encryption and decryption techniques within the system enabling the operators to safely store, access, and transfer data.

It primarily secures data stored on portable systems such smartphones, removable media, or even laptops. Moreover, increasing in adoption of portable devices for data storage among organizations in various sectors has resulted in a significant increase in deployment of mobile data protection as a step towards enhancing enterprise data security.
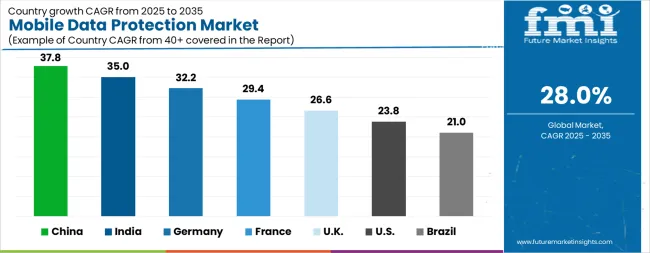
Analysis of Mobile Data Protection Market By Key Countries

Mobile Data Protection Market Cagr Analysis By Country
Country CAGR
China 37.8%
India 35.0%
Germany 32.2%
France 29.4%
UK 26.6%
USA 23.8%
Brazil 21.0%

Country-wise Analysis

The Mobile Data Protection Market is expected to register a CAGR of 28.0% during the forecast period, exhibiting varied country level momentum. China leads with the highest CAGR of 37.8%, followed by India at 35.0%. Developed markets such as Germany, France, and the UK continue to expand steadily, while the USA is likely to grow at consistent rates. Brazil posts the lowest CAGR at 21.0%, yet still underscores a broadly positive trajectory for the global Mobile Data Protection Market. In 2024, Germany held a dominant revenue in the Western Europe market and is expected to grow with a CAGR of 32.2%. The USA Mobile Data Protection Market is estimated to be valued at USD 3.4 billion in 2025 and is anticipated to reach a valuation of USD 28.4 billion by 2035. Sales are projected to rise at a CAGR of 23.8% over the forecast period between 2025 and 2035. While Japan and South Korea markets are estimated to be valued at USD 419.6 million and USD 284.8 million respectively in 2025.
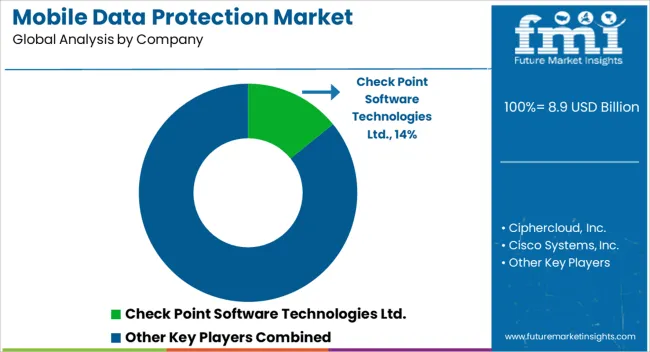
Key Players in the Mobile Data Protection Market

Mobile Data Protection Market Analysis By Company

  • Check Point Software Technologies Ltd.
  • Ciphercloud, Inc.
  • Cisco Systems, Inc.
  • Dell EMC
  • Druva Inc.
  • Gemalto NV
  • Hewlett Packard Enterprise Development LP (HPE)
  • McAfee LLC
  • Microsoft Corporation
  • Sophos Ltd.
  • Symantec Corporation
  • Trend Micro, Inc.

Scope of the Report

Item Value
Quantitative Units USD 8.9 Billion
Device Type Mobile Phones, Laptops, Removable Media, and Others
Operating System Android, Mac OS, Windows, Linux, and Others
User Type SME and Large Enterprises
Verticals IT And Telecommunication, Retail, Manufacturing, Bfsi, Healthcare, Consumer Goods, Media And Entertainment, Aerospace & Defence, and Others
Regions Covered North America, Europe, Asia-Pacific, Latin America, Middle East & Africa
Country Covered United States, Canada, Germany, France, United Kingdom, China, Japan, India, Brazil, South Africa
Key Companies Profiled Check Point Software Technologies Ltd., Ciphercloud, Inc., Cisco Systems, Inc., Dell EMC, Druva Inc., Gemalto NV, Hewlett Packard Enterprise Development LP (HPE), McAfee LLC, Microsoft Corporation, Sophos Ltd., Symantec Corporation, and Trend Micro, Inc.

Mobile Data Protection Market by Segments

Device Type:

  • Mobile Phones
  • Laptops
  • Removable Media
  • Others

Operating System:

  • Android
  • Mac OS
  • Windows
  • Linux
  • Others

User Type:

  • SME
  • Large Enterprises

Verticals:

  • IT And Telecommunication
  • Retail
  • Manufacturing
  • Bfsi
  • Healthcare
  • Consumer Goods
  • Media And Entertainment
  • Aerospace & Defence
  • Others

Region:

  • North America
    • USA
    • Canada
    • Mexico
  • Latin America
    • Brazil
    • Chile
    • Rest of Latin America
  • Western Europe
    • Germany
    • UK
    • Italy
    • Spain
    • France
    • Nordic
    • BENELUX
    • Rest of Western Europe
  • Eastern Europe
    • Russia
    • Poland
    • Hungary
    • Balkan & Baltic
    • Rest of Eastern Europe
  • East Asia
    • China
    • Japan
    • South Korea
  • South Asia and Pacific
    • India
    • ASEAN
    • Australia & New Zealand
    • Rest of South Asia and Pacific
  • Middle East & Africa
    • Kingdom of Saudi Arabia
    • Other GCC Countries
    • Turkiye
    • South Africa
    • Other African Union
    • Rest of Middle East & Africa

Table of Content

  1. Executive Summary
    • Global Market Outlook
    • Demand-side Trends
    • Supply-side Trends
    • Technology Roadmap Analysis
    • Analysis and Recommendations
  2. Market Overview
    • Market Coverage / Taxonomy
    • Market Definition / Scope / Limitations
  3. Market Background
    • Market Dynamics
      • Drivers
      • Restraints
      • Opportunity
      • Trends
    • Scenario Forecast
      • Demand in Optimistic Scenario
      • Demand in Likely Scenario
      • Demand in Conservative Scenario
    • Opportunity Map Analysis
    • Product Life Cycle Analysis
    • Supply Chain Analysis
    • Investment Feasibility Matrix
    • Value Chain Analysis
    • PESTLE and Porter’s Analysis
    • Regulatory Landscape
    • Regional Parent Market Outlook
    • Production and Consumption Statistics
    • Import and Export Statistics
  4. Global Market Analysis 2020 to 2024 and Forecast, 2025 to 2035
    • Historical Market Size Value (USD Million) Analysis, 2020 to 2024
    • Current and Future Market Size Value (USD Million) Projections, 2025 to 2035
      • Y-o-Y Growth Trend Analysis
      • Absolute $ Opportunity Analysis
  5. Global Market Pricing Analysis 2020 to 2024 and Forecast 2025 to 2035
  6. Global Market Analysis 2020 to 2024 and Forecast 2025 to 2035, By Device Type
    • Introduction / Key Findings
    • Historical Market Size Value (USD Million) Analysis By Device Type , 2020 to 2024
    • Current and Future Market Size Value (USD Million) Analysis and Forecast By Device Type , 2025 to 2035
      • Mobile Phones
      • Laptops
      • Removable Media
      • Others
    • Y-o-Y Growth Trend Analysis By Device Type , 2020 to 2024
    • Absolute $ Opportunity Analysis By Device Type , 2025 to 2035
  7. Global Market Analysis 2020 to 2024 and Forecast 2025 to 2035, By Operating System
    • Introduction / Key Findings
    • Historical Market Size Value (USD Million) Analysis By Operating System, 2020 to 2024
    • Current and Future Market Size Value (USD Million) Analysis and Forecast By Operating System, 2025 to 2035
      • Android
      • Mac OS
      • Windows
      • Linux
      • Others
    • Y-o-Y Growth Trend Analysis By Operating System, 2020 to 2024
    • Absolute $ Opportunity Analysis By Operating System, 2025 to 2035
  8. Global Market Analysis 2020 to 2024 and Forecast 2025 to 2035, By User Type
    • Introduction / Key Findings
    • Historical Market Size Value (USD Million) Analysis By User Type, 2020 to 2024
    • Current and Future Market Size Value (USD Million) Analysis and Forecast By User Type, 2025 to 2035
      • SME
      • Large Enterprises
    • Y-o-Y Growth Trend Analysis By User Type, 2020 to 2024
    • Absolute $ Opportunity Analysis By User Type, 2025 to 2035
  9. Global Market Analysis 2020 to 2024 and Forecast 2025 to 2035, By Verticals
    • Introduction / Key Findings
    • Historical Market Size Value (USD Million) Analysis By Verticals, 2020 to 2024
    • Current and Future Market Size Value (USD Million) Analysis and Forecast By Verticals, 2025 to 2035
      • IT And Telecommunication
      • Retail
      • Manufacturing
      • Bfsi
      • Healthcare
      • Consumer Goods
      • Media And Entertainment
      • Aerospace & Defence
      • Others
    • Y-o-Y Growth Trend Analysis By Verticals, 2020 to 2024
    • Absolute $ Opportunity Analysis By Verticals, 2025 to 2035
  10. Global Market Analysis 2020 to 2024 and Forecast 2025 to 2035, By Region
    • Introduction
    • Historical Market Size Value (USD Million) Analysis By Region, 2020 to 2024
    • Current Market Size Value (USD Million) Analysis and Forecast By Region, 2025 to 2035
      • North America
      • Latin America
      • Western Europe
      • Eastern Europe
      • East Asia
      • South Asia and Pacific
      • Middle East & Africa
    • Market Attractiveness Analysis By Region
  11. North America Market Analysis 2020 to 2024 and Forecast 2025 to 2035, By Country
    • Historical Market Size Value (USD Million) Trend Analysis By Market Taxonomy, 2020 to 2024
    • Market Size Value (USD Million) Forecast By Market Taxonomy, 2025 to 2035
      • By Country
        • USA
        • Canada
        • Mexico
      • By Device Type
      • By Operating System
      • By User Type
      • By Verticals
    • Market Attractiveness Analysis
      • By Country
      • By Device Type
      • By Operating System
      • By User Type
      • By Verticals
    • Key Takeaways
  12. Latin America Market Analysis 2020 to 2024 and Forecast 2025 to 2035, By Country
    • Historical Market Size Value (USD Million) Trend Analysis By Market Taxonomy, 2020 to 2024
    • Market Size Value (USD Million) Forecast By Market Taxonomy, 2025 to 2035
      • By Country
        • Brazil
        • Chile
        • Rest of Latin America
      • By Device Type
      • By Operating System
      • By User Type
      • By Verticals
    • Market Attractiveness Analysis
      • By Country
      • By Device Type
      • By Operating System
      • By User Type
      • By Verticals
    • Key Takeaways
  13. Western Europe Market Analysis 2020 to 2024 and Forecast 2025 to 2035, By Country
    • Historical Market Size Value (USD Million) Trend Analysis By Market Taxonomy, 2020 to 2024
    • Market Size Value (USD Million) Forecast By Market Taxonomy, 2025 to 2035
      • By Country
        • Germany
        • UK
        • Italy
        • Spain
        • France
        • Nordic
        • BENELUX
        • Rest of Western Europe
      • By Device Type
      • By Operating System
      • By User Type
      • By Verticals
    • Market Attractiveness Analysis
      • By Country
      • By Device Type
      • By Operating System
      • By User Type
      • By Verticals
    • Key Takeaways
  14. Eastern Europe Market Analysis 2020 to 2024 and Forecast 2025 to 2035, By Country
    • Historical Market Size Value (USD Million) Trend Analysis By Market Taxonomy, 2020 to 2024
    • Market Size Value (USD Million) Forecast By Market Taxonomy, 2025 to 2035
      • By Country
        • Russia
        • Poland
        • Hungary
        • Balkan & Baltic
        • Rest of Eastern Europe
      • By Device Type
      • By Operating System
      • By User Type
      • By Verticals
    • Market Attractiveness Analysis
      • By Country
      • By Device Type
      • By Operating System
      • By User Type
      • By Verticals
    • Key Takeaways
  15. East Asia Market Analysis 2020 to 2024 and Forecast 2025 to 2035, By Country
    • Historical Market Size Value (USD Million) Trend Analysis By Market Taxonomy, 2020 to 2024
    • Market Size Value (USD Million) Forecast By Market Taxonomy, 2025 to 2035
      • By Country
        • China
        • Japan
        • South Korea
      • By Device Type
      • By Operating System
      • By User Type
      • By Verticals
    • Market Attractiveness Analysis
      • By Country
      • By Device Type
      • By Operating System
      • By User Type
      • By Verticals
    • Key Takeaways
  16. South Asia and Pacific Market Analysis 2020 to 2024 and Forecast 2025 to 2035, By Country
    • Historical Market Size Value (USD Million) Trend Analysis By Market Taxonomy, 2020 to 2024
    • Market Size Value (USD Million) Forecast By Market Taxonomy, 2025 to 2035
      • By Country
        • India
        • ASEAN
        • Australia & New Zealand
        • Rest of South Asia and Pacific
      • By Device Type
      • By Operating System
      • By User Type
      • By Verticals
    • Market Attractiveness Analysis
      • By Country
      • By Device Type
      • By Operating System
      • By User Type
      • By Verticals
    • Key Takeaways
  17. Middle East & Africa Market Analysis 2020 to 2024 and Forecast 2025 to 2035, By Country
    • Historical Market Size Value (USD Million) Trend Analysis By Market Taxonomy, 2020 to 2024
    • Market Size Value (USD Million) Forecast By Market Taxonomy, 2025 to 2035
      • By Country
        • Kingdom of Saudi Arabia
        • Other GCC Countries
        • Turkiye
        • South Africa
        • Other African Union
        • Rest of Middle East & Africa
      • By Device Type
      • By Operating System
      • By User Type
      • By Verticals
    • Market Attractiveness Analysis
      • By Country
      • By Device Type
      • By Operating System
      • By User Type
      • By Verticals
    • Key Takeaways
  18. Key Countries Market Analysis
    • USA
      • Pricing Analysis
      • Market Share Analysis, 2024
        • By Device Type
        • By Operating System
        • By User Type
        • By Verticals
    • Canada
      • Pricing Analysis
      • Market Share Analysis, 2024
        • By Device Type
        • By Operating System
        • By User Type
        • By Verticals
    • Mexico
      • Pricing Analysis
      • Market Share Analysis, 2024
        • By Device Type
        • By Operating System
        • By User Type
        • By Verticals
    • Brazil
      • Pricing Analysis
      • Market Share Analysis, 2024
        • By Device Type
        • By Operating System
        • By User Type
        • By Verticals
    • Chile
      • Pricing Analysis
      • Market Share Analysis, 2024
        • By Device Type
        • By Operating System
        • By User Type
        • By Verticals
    • Germany
      • Pricing Analysis
      • Market Share Analysis, 2024
        • By Device Type
        • By Operating System
        • By User Type
        • By Verticals
    • UK
      • Pricing Analysis
      • Market Share Analysis, 2024
        • By Device Type
        • By Operating System
        • By User Type
        • By Verticals
    • Italy
      • Pricing Analysis
      • Market Share Analysis, 2024
        • By Device Type
        • By Operating System
        • By User Type
        • By Verticals
    • Spain
      • Pricing Analysis
      • Market Share Analysis, 2024
        • By Device Type
        • By Operating System
        • By User Type
        • By Verticals
    • France
      • Pricing Analysis
      • Market Share Analysis, 2024
        • By Device Type
        • By Operating System
        • By User Type
        • By Verticals
    • India
      • Pricing Analysis
      • Market Share Analysis, 2024
        • By Device Type
        • By Operating System
        • By User Type
        • By Verticals
    • ASEAN
      • Pricing Analysis
      • Market Share Analysis, 2024
        • By Device Type
        • By Operating System
        • By User Type
        • By Verticals
    • Australia & New Zealand
      • Pricing Analysis
      • Market Share Analysis, 2024
        • By Device Type
        • By Operating System
        • By User Type
        • By Verticals
    • China
      • Pricing Analysis
      • Market Share Analysis, 2024
        • By Device Type
        • By Operating System
        • By User Type
        • By Verticals
    • Japan
      • Pricing Analysis
      • Market Share Analysis, 2024
        • By Device Type
        • By Operating System
        • By User Type
        • By Verticals
    • South Korea
      • Pricing Analysis
      • Market Share Analysis, 2024
        • By Device Type
        • By Operating System
        • By User Type
        • By Verticals
    • Russia
      • Pricing Analysis
      • Market Share Analysis, 2024
        • By Device Type
        • By Operating System
        • By User Type
        • By Verticals
    • Poland
      • Pricing Analysis
      • Market Share Analysis, 2024
        • By Device Type
        • By Operating System
        • By User Type
        • By Verticals
    • Hungary
      • Pricing Analysis
      • Market Share Analysis, 2024
        • By Device Type
        • By Operating System
        • By User Type
        • By Verticals
    • Kingdom of Saudi Arabia
      • Pricing Analysis
      • Market Share Analysis, 2024
        • By Device Type
        • By Operating System
        • By User Type
        • By Verticals
    • Turkiye
      • Pricing Analysis
      • Market Share Analysis, 2024
        • By Device Type
        • By Operating System
        • By User Type
        • By Verticals
    • South Africa
      • Pricing Analysis
      • Market Share Analysis, 2024
        • By Device Type
        • By Operating System
        • By User Type
        • By Verticals
  19. Market Structure Analysis
    • Competition Dashboard
    • Competition Benchmarking
    • Market Share Analysis of Top Players
      • By Regional
      • By Device Type
      • By Operating System
      • By User Type
      • By Verticals
  20. Competition Analysis
    • Competition Deep Dive
      • Check Point Software Technologies Ltd.
        • Overview
        • Product Portfolio
        • Profitability by Market Segments (Product/Age /Sales Channel/Region)
        • Sales Footprint
        • Strategy Overview
          • Marketing Strategy
          • Product Strategy
          • Channel Strategy
      • Ciphercloud, Inc.
      • Cisco Systems, Inc.
      • Dell EMC
      • Druva Inc.
      • Gemalto NV
      • Hewlett Packard Enterprise Development LP (HPE)
      • McAfee LLC
      • Microsoft Corporation
      • Sophos Ltd.
      • Symantec Corporation
      • Trend Micro, Inc.
  21. Assumptions & Acronyms Used
  22. Research Methodology

List of Tables

  • Table 1: Global Market Value (USD Million) Forecast by Region, 2020-2035
  • Table 2: Global Market Value (USD Million) Forecast by Device Type , 2020-2035
  • Table 3: Global Market Value (USD Million) Forecast by Operating System, 2020-2035
  • Table 4: Global Market Value (USD Million) Forecast by User Type, 2020-2035
  • Table 5: Global Market Value (USD Million) Forecast by Verticals, 2020-2035
  • Table 6: North America Market Value (USD Million) Forecast by Country, 2020-2035
  • Table 7: North America Market Value (USD Million) Forecast by Device Type , 2020-2035
  • Table 8: North America Market Value (USD Million) Forecast by Operating System, 2020-2035
  • Table 9: North America Market Value (USD Million) Forecast by User Type, 2020-2035
  • Table 10: North America Market Value (USD Million) Forecast by Verticals, 2020-2035
  • Table 11: Latin America Market Value (USD Million) Forecast by Country, 2020-2035
  • Table 12: Latin America Market Value (USD Million) Forecast by Device Type , 2020-2035
  • Table 13: Latin America Market Value (USD Million) Forecast by Operating System, 2020-2035
  • Table 14: Latin America Market Value (USD Million) Forecast by User Type, 2020-2035
  • Table 15: Latin America Market Value (USD Million) Forecast by Verticals, 2020-2035
  • Table 16: Western Europe Market Value (USD Million) Forecast by Country, 2020-2035
  • Table 17: Western Europe Market Value (USD Million) Forecast by Device Type , 2020-2035
  • Table 18: Western Europe Market Value (USD Million) Forecast by Operating System, 2020-2035
  • Table 19: Western Europe Market Value (USD Million) Forecast by User Type, 2020-2035
  • Table 20: Western Europe Market Value (USD Million) Forecast by Verticals, 2020-2035
  • Table 21: Eastern Europe Market Value (USD Million) Forecast by Country, 2020-2035
  • Table 22: Eastern Europe Market Value (USD Million) Forecast by Device Type , 2020-2035
  • Table 23: Eastern Europe Market Value (USD Million) Forecast by Operating System, 2020-2035
  • Table 24: Eastern Europe Market Value (USD Million) Forecast by User Type, 2020-2035
  • Table 25: Eastern Europe Market Value (USD Million) Forecast by Verticals, 2020-2035
  • Table 26: East Asia Market Value (USD Million) Forecast by Country, 2020-2035
  • Table 27: East Asia Market Value (USD Million) Forecast by Device Type , 2020-2035
  • Table 28: East Asia Market Value (USD Million) Forecast by Operating System, 2020-2035
  • Table 29: East Asia Market Value (USD Million) Forecast by User Type, 2020-2035
  • Table 30: East Asia Market Value (USD Million) Forecast by Verticals, 2020-2035
  • Table 31: South Asia and Pacific Market Value (USD Million) Forecast by Country, 2020-2035
  • Table 32: South Asia and Pacific Market Value (USD Million) Forecast by Device Type , 2020-2035
  • Table 33: South Asia and Pacific Market Value (USD Million) Forecast by Operating System, 2020-2035
  • Table 34: South Asia and Pacific Market Value (USD Million) Forecast by User Type, 2020-2035
  • Table 35: South Asia and Pacific Market Value (USD Million) Forecast by Verticals, 2020-2035
  • Table 36: Middle East & Africa Market Value (USD Million) Forecast by Country, 2020-2035
  • Table 37: Middle East & Africa Market Value (USD Million) Forecast by Device Type , 2020-2035
  • Table 38: Middle East & Africa Market Value (USD Million) Forecast by Operating System, 2020-2035
  • Table 39: Middle East & Africa Market Value (USD Million) Forecast by User Type, 2020-2035
  • Table 40: Middle East & Africa Market Value (USD Million) Forecast by Verticals, 2020-2035

List of Figures

  • Figure 1: Global Market Pricing Analysis
  • Figure 2: Global Market Value (USD Million) Forecast 2020-2035
  • Figure 3: Global Market Value Share and BPS Analysis by Device Type , 2025 and 2035
  • Figure 4: Global Market Y-o-Y Growth Comparison by Device Type , 2025-2035
  • Figure 5: Global Market Attractiveness Analysis by Device Type
  • Figure 6: Global Market Value Share and BPS Analysis by Operating System, 2025 and 2035
  • Figure 7: Global Market Y-o-Y Growth Comparison by Operating System, 2025-2035
  • Figure 8: Global Market Attractiveness Analysis by Operating System
  • Figure 9: Global Market Value Share and BPS Analysis by User Type, 2025 and 2035
  • Figure 10: Global Market Y-o-Y Growth Comparison by User Type, 2025-2035
  • Figure 11: Global Market Attractiveness Analysis by User Type
  • Figure 12: Global Market Value Share and BPS Analysis by Verticals, 2025 and 2035
  • Figure 13: Global Market Y-o-Y Growth Comparison by Verticals, 2025-2035
  • Figure 14: Global Market Attractiveness Analysis by Verticals
  • Figure 15: Global Market Value (USD Million) Share and BPS Analysis by Region, 2025 and 2035
  • Figure 16: Global Market Y-o-Y Growth Comparison by Region, 2025-2035
  • Figure 17: Global Market Attractiveness Analysis by Region
  • Figure 18: North America Market Incremental Dollar Opportunity, 2025-2035
  • Figure 19: Latin America Market Incremental Dollar Opportunity, 2025-2035
  • Figure 20: Western Europe Market Incremental Dollar Opportunity, 2025-2035
  • Figure 21: Eastern Europe Market Incremental Dollar Opportunity, 2025-2035
  • Figure 22: East Asia Market Incremental Dollar Opportunity, 2025-2035
  • Figure 23: South Asia and Pacific Market Incremental Dollar Opportunity, 2025-2035
  • Figure 24: Middle East & Africa Market Incremental Dollar Opportunity, 2025-2035
  • Figure 25: North America Market Value Share and BPS Analysis by Country, 2025 and 2035
  • Figure 26: North America Market Value Share and BPS Analysis by Device Type , 2025 and 2035
  • Figure 27: North America Market Y-o-Y Growth Comparison by Device Type , 2025-2035
  • Figure 28: North America Market Attractiveness Analysis by Device Type
  • Figure 29: North America Market Value Share and BPS Analysis by Operating System, 2025 and 2035
  • Figure 30: North America Market Y-o-Y Growth Comparison by Operating System, 2025-2035
  • Figure 31: North America Market Attractiveness Analysis by Operating System
  • Figure 32: North America Market Value Share and BPS Analysis by User Type, 2025 and 2035
  • Figure 33: North America Market Y-o-Y Growth Comparison by User Type, 2025-2035
  • Figure 34: North America Market Attractiveness Analysis by User Type
  • Figure 35: North America Market Value Share and BPS Analysis by Verticals, 2025 and 2035
  • Figure 36: North America Market Y-o-Y Growth Comparison by Verticals, 2025-2035
  • Figure 37: North America Market Attractiveness Analysis by Verticals
  • Figure 38: Latin America Market Value Share and BPS Analysis by Country, 2025 and 2035
  • Figure 39: Latin America Market Value Share and BPS Analysis by Device Type , 2025 and 2035
  • Figure 40: Latin America Market Y-o-Y Growth Comparison by Device Type , 2025-2035
  • Figure 41: Latin America Market Attractiveness Analysis by Device Type
  • Figure 42: Latin America Market Value Share and BPS Analysis by Operating System, 2025 and 2035
  • Figure 43: Latin America Market Y-o-Y Growth Comparison by Operating System, 2025-2035
  • Figure 44: Latin America Market Attractiveness Analysis by Operating System
  • Figure 45: Latin America Market Value Share and BPS Analysis by User Type, 2025 and 2035
  • Figure 46: Latin America Market Y-o-Y Growth Comparison by User Type, 2025-2035
  • Figure 47: Latin America Market Attractiveness Analysis by User Type
  • Figure 48: Latin America Market Value Share and BPS Analysis by Verticals, 2025 and 2035
  • Figure 49: Latin America Market Y-o-Y Growth Comparison by Verticals, 2025-2035
  • Figure 50: Latin America Market Attractiveness Analysis by Verticals
  • Figure 51: Western Europe Market Value Share and BPS Analysis by Country, 2025 and 2035
  • Figure 52: Western Europe Market Value Share and BPS Analysis by Device Type , 2025 and 2035
  • Figure 53: Western Europe Market Y-o-Y Growth Comparison by Device Type , 2025-2035
  • Figure 54: Western Europe Market Attractiveness Analysis by Device Type
  • Figure 55: Western Europe Market Value Share and BPS Analysis by Operating System, 2025 and 2035
  • Figure 56: Western Europe Market Y-o-Y Growth Comparison by Operating System, 2025-2035
  • Figure 57: Western Europe Market Attractiveness Analysis by Operating System
  • Figure 58: Western Europe Market Value Share and BPS Analysis by User Type, 2025 and 2035
  • Figure 59: Western Europe Market Y-o-Y Growth Comparison by User Type, 2025-2035
  • Figure 60: Western Europe Market Attractiveness Analysis by User Type
  • Figure 61: Western Europe Market Value Share and BPS Analysis by Verticals, 2025 and 2035
  • Figure 62: Western Europe Market Y-o-Y Growth Comparison by Verticals, 2025-2035
  • Figure 63: Western Europe Market Attractiveness Analysis by Verticals
  • Figure 64: Eastern Europe Market Value Share and BPS Analysis by Country, 2025 and 2035
  • Figure 65: Eastern Europe Market Value Share and BPS Analysis by Device Type , 2025 and 2035
  • Figure 66: Eastern Europe Market Y-o-Y Growth Comparison by Device Type , 2025-2035
  • Figure 67: Eastern Europe Market Attractiveness Analysis by Device Type
  • Figure 68: Eastern Europe Market Value Share and BPS Analysis by Operating System, 2025 and 2035
  • Figure 69: Eastern Europe Market Y-o-Y Growth Comparison by Operating System, 2025-2035
  • Figure 70: Eastern Europe Market Attractiveness Analysis by Operating System
  • Figure 71: Eastern Europe Market Value Share and BPS Analysis by User Type, 2025 and 2035
  • Figure 72: Eastern Europe Market Y-o-Y Growth Comparison by User Type, 2025-2035
  • Figure 73: Eastern Europe Market Attractiveness Analysis by User Type
  • Figure 74: Eastern Europe Market Value Share and BPS Analysis by Verticals, 2025 and 2035
  • Figure 75: Eastern Europe Market Y-o-Y Growth Comparison by Verticals, 2025-2035
  • Figure 76: Eastern Europe Market Attractiveness Analysis by Verticals
  • Figure 77: East Asia Market Value Share and BPS Analysis by Country, 2025 and 2035
  • Figure 78: East Asia Market Value Share and BPS Analysis by Device Type , 2025 and 2035
  • Figure 79: East Asia Market Y-o-Y Growth Comparison by Device Type , 2025-2035
  • Figure 80: East Asia Market Attractiveness Analysis by Device Type
  • Figure 81: East Asia Market Value Share and BPS Analysis by Operating System, 2025 and 2035
  • Figure 82: East Asia Market Y-o-Y Growth Comparison by Operating System, 2025-2035
  • Figure 83: East Asia Market Attractiveness Analysis by Operating System
  • Figure 84: East Asia Market Value Share and BPS Analysis by User Type, 2025 and 2035
  • Figure 85: East Asia Market Y-o-Y Growth Comparison by User Type, 2025-2035
  • Figure 86: East Asia Market Attractiveness Analysis by User Type
  • Figure 87: East Asia Market Value Share and BPS Analysis by Verticals, 2025 and 2035
  • Figure 88: East Asia Market Y-o-Y Growth Comparison by Verticals, 2025-2035
  • Figure 89: East Asia Market Attractiveness Analysis by Verticals
  • Figure 90: South Asia and Pacific Market Value Share and BPS Analysis by Country, 2025 and 2035
  • Figure 91: South Asia and Pacific Market Value Share and BPS Analysis by Device Type , 2025 and 2035
  • Figure 92: South Asia and Pacific Market Y-o-Y Growth Comparison by Device Type , 2025-2035
  • Figure 93: South Asia and Pacific Market Attractiveness Analysis by Device Type
  • Figure 94: South Asia and Pacific Market Value Share and BPS Analysis by Operating System, 2025 and 2035
  • Figure 95: South Asia and Pacific Market Y-o-Y Growth Comparison by Operating System, 2025-2035
  • Figure 96: South Asia and Pacific Market Attractiveness Analysis by Operating System
  • Figure 97: South Asia and Pacific Market Value Share and BPS Analysis by User Type, 2025 and 2035
  • Figure 98: South Asia and Pacific Market Y-o-Y Growth Comparison by User Type, 2025-2035
  • Figure 99: South Asia and Pacific Market Attractiveness Analysis by User Type
  • Figure 100: South Asia and Pacific Market Value Share and BPS Analysis by Verticals, 2025 and 2035
  • Figure 101: South Asia and Pacific Market Y-o-Y Growth Comparison by Verticals, 2025-2035
  • Figure 102: South Asia and Pacific Market Attractiveness Analysis by Verticals
  • Figure 103: Middle East & Africa Market Value Share and BPS Analysis by Country, 2025 and 2035
  • Figure 104: Middle East & Africa Market Value Share and BPS Analysis by Device Type , 2025 and 2035
  • Figure 105: Middle East & Africa Market Y-o-Y Growth Comparison by Device Type , 2025-2035
  • Figure 106: Middle East & Africa Market Attractiveness Analysis by Device Type
  • Figure 107: Middle East & Africa Market Value Share and BPS Analysis by Operating System, 2025 and 2035
  • Figure 108: Middle East & Africa Market Y-o-Y Growth Comparison by Operating System, 2025-2035
  • Figure 109: Middle East & Africa Market Attractiveness Analysis by Operating System
  • Figure 110: Middle East & Africa Market Value Share and BPS Analysis by User Type, 2025 and 2035
  • Figure 111: Middle East & Africa Market Y-o-Y Growth Comparison by User Type, 2025-2035
  • Figure 112: Middle East & Africa Market Attractiveness Analysis by User Type
  • Figure 113: Middle East & Africa Market Value Share and BPS Analysis by Verticals, 2025 and 2035
  • Figure 114: Middle East & Africa Market Y-o-Y Growth Comparison by Verticals, 2025-2035
  • Figure 115: Middle East & Africa Market Attractiveness Analysis by Verticals
  • Figure 116: Global Market - Tier Structure Analysis
  • Figure 117: Global Market - Company Share Analysis

Frequently Asked Questions

How big is the mobile data protection market in 2025?

The global mobile data protection market is estimated to be valued at USD 8.9 billion in 2025.

What will be the size of mobile data protection market in 2035?

The market size for the mobile data protection market is projected to reach USD 105.5 billion by 2035.

How much will be the mobile data protection market growth between 2025 and 2035?

The mobile data protection market is expected to grow at a 28.0% CAGR between 2025 and 2035.

What are the key product types in the mobile data protection market?

The key product types in mobile data protection market are mobile phones, laptops, removable media and others.

Which operating system segment to contribute significant share in the mobile data protection market in 2025?

In terms of operating system, android segment to command 29.8% share in the mobile data protection market in 2025.

Explore Similar Insights

Future Market Insights

Mobile Data Protection Market

Chat With

MaRIA

Hi There, I am MaRIA, Your Market Research Intelligence Assistant. How may I help you?